$750,000
Investment Summary
- Monthly Cash Flow
- -$1,784
- Cap Rate
- 3.3%
- Cash-on-Cash Return
- -12.4%
- Debt Coverage Ratio
- 0.54
- Internal Rate of Return (5 years)
- -8.0%
Cash Flow
Net Operating Income (NOI) minus mortgage payments.
Calculation:
NOI - Mortgage Payments
Cap Rate (Market Value)
Capitalization Rate is a rate of return that compares the yearly Net Operating Income (NOI) to the market value.
Calculation:
NOI / Market Value
Cash-on-Cash Return (CoC)
Annual Cash Flow / Cash Invested
Calculation:
Annual cash flow divided by initial cash invested.
Debt Coverage Ratio (DCR)
Net Operating Income (NOI) divided by total debt payments.
Calculation:
NOI / Total Debt Payments
Internal Rate of Return (IRR)
A metric for assessing profitability over time. IRR is the discount rate at which the net present value (NPV) of all future cash flows (positive and negative) from an investment equals zero — including both periodic cash flow (such as rent) and a projected sale at the end of the holding period. It represents the expected annualized return, accounting for income, expenses, and the recovery of capital through a future sale.
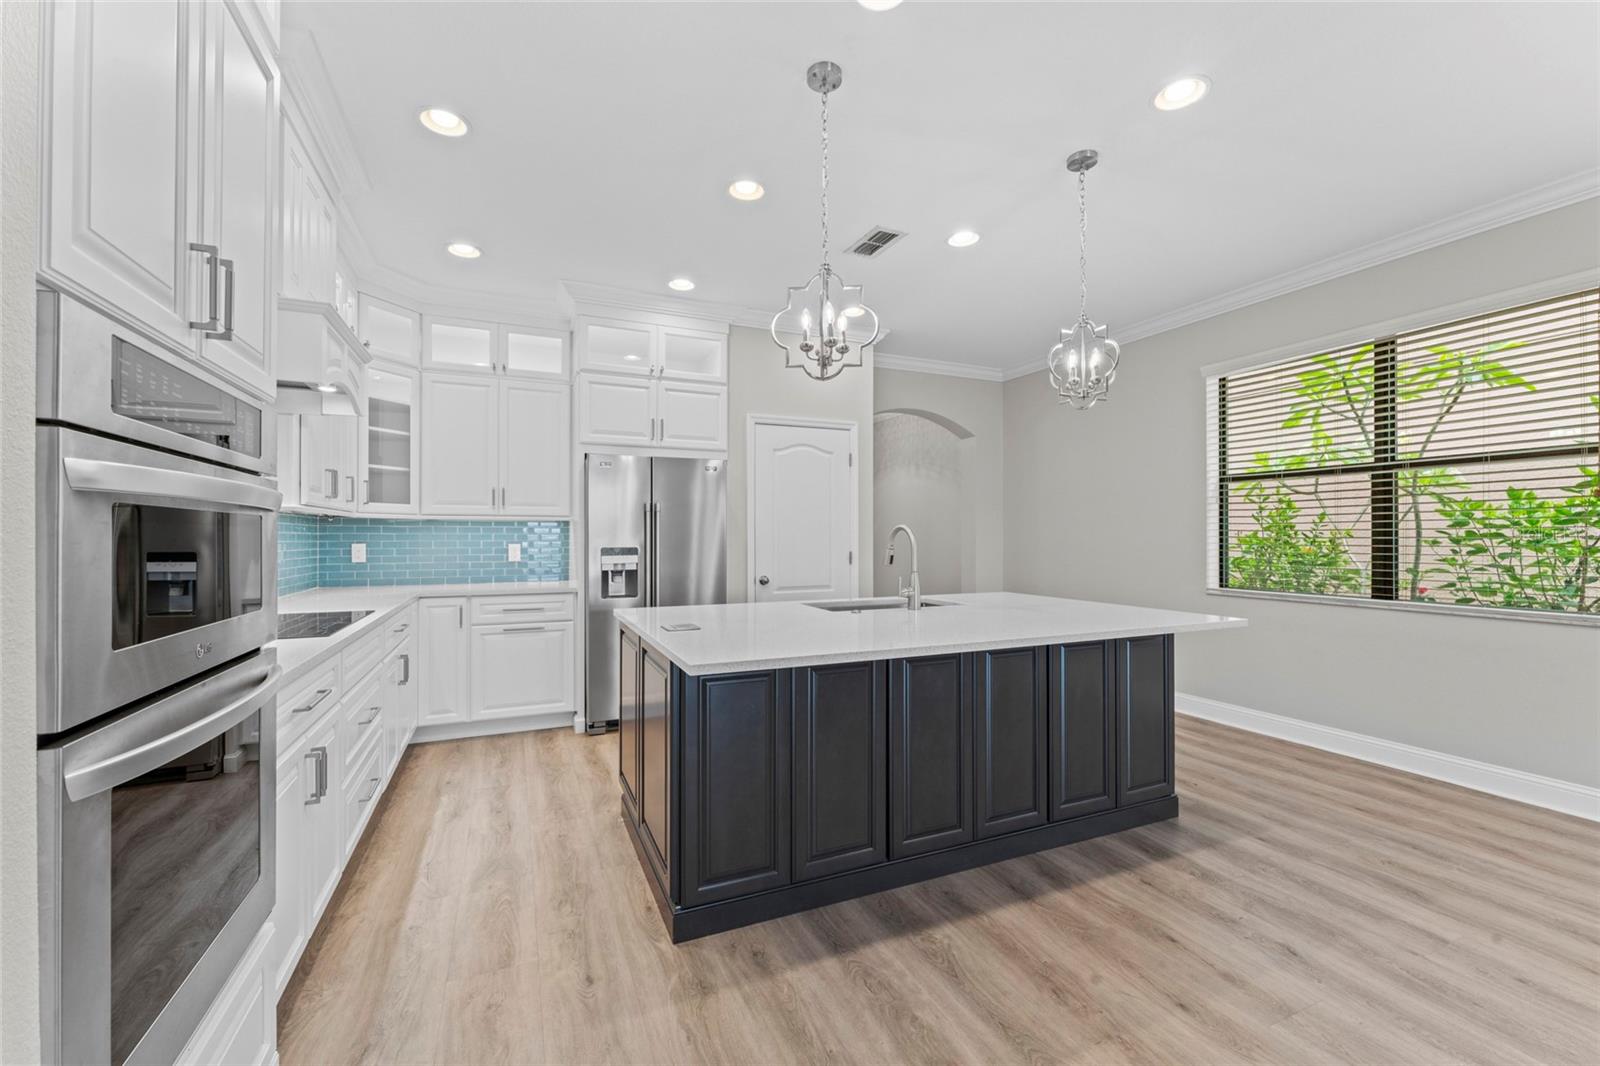
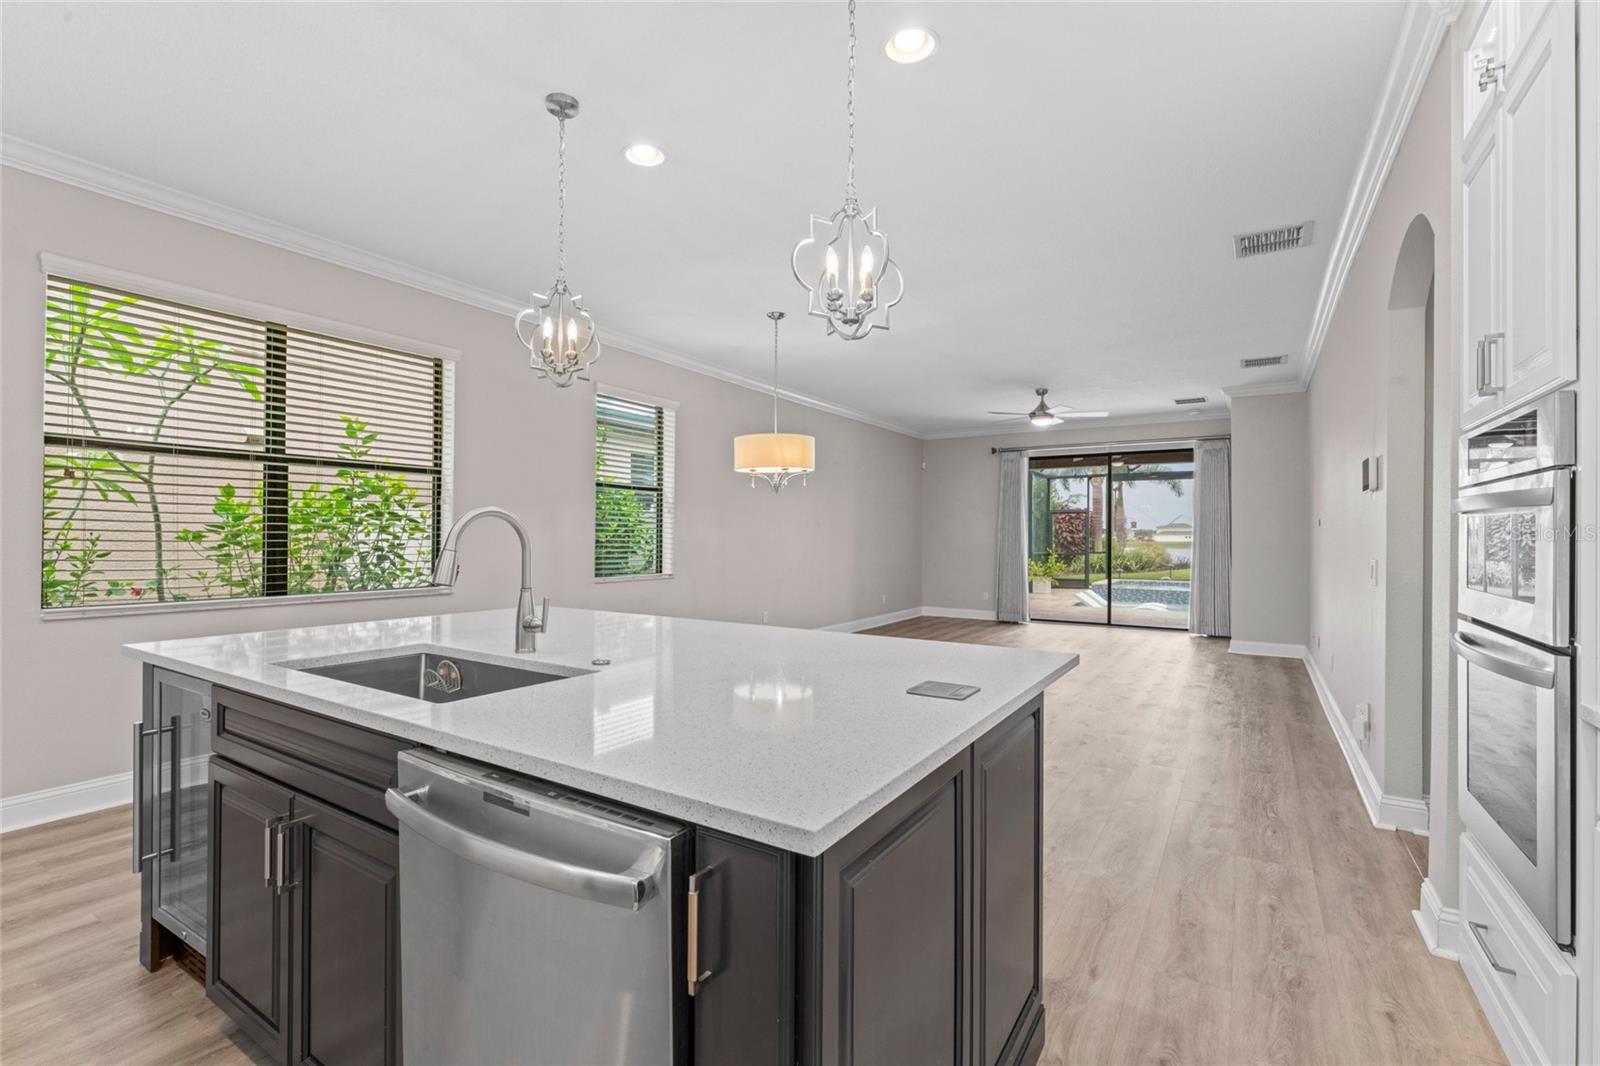
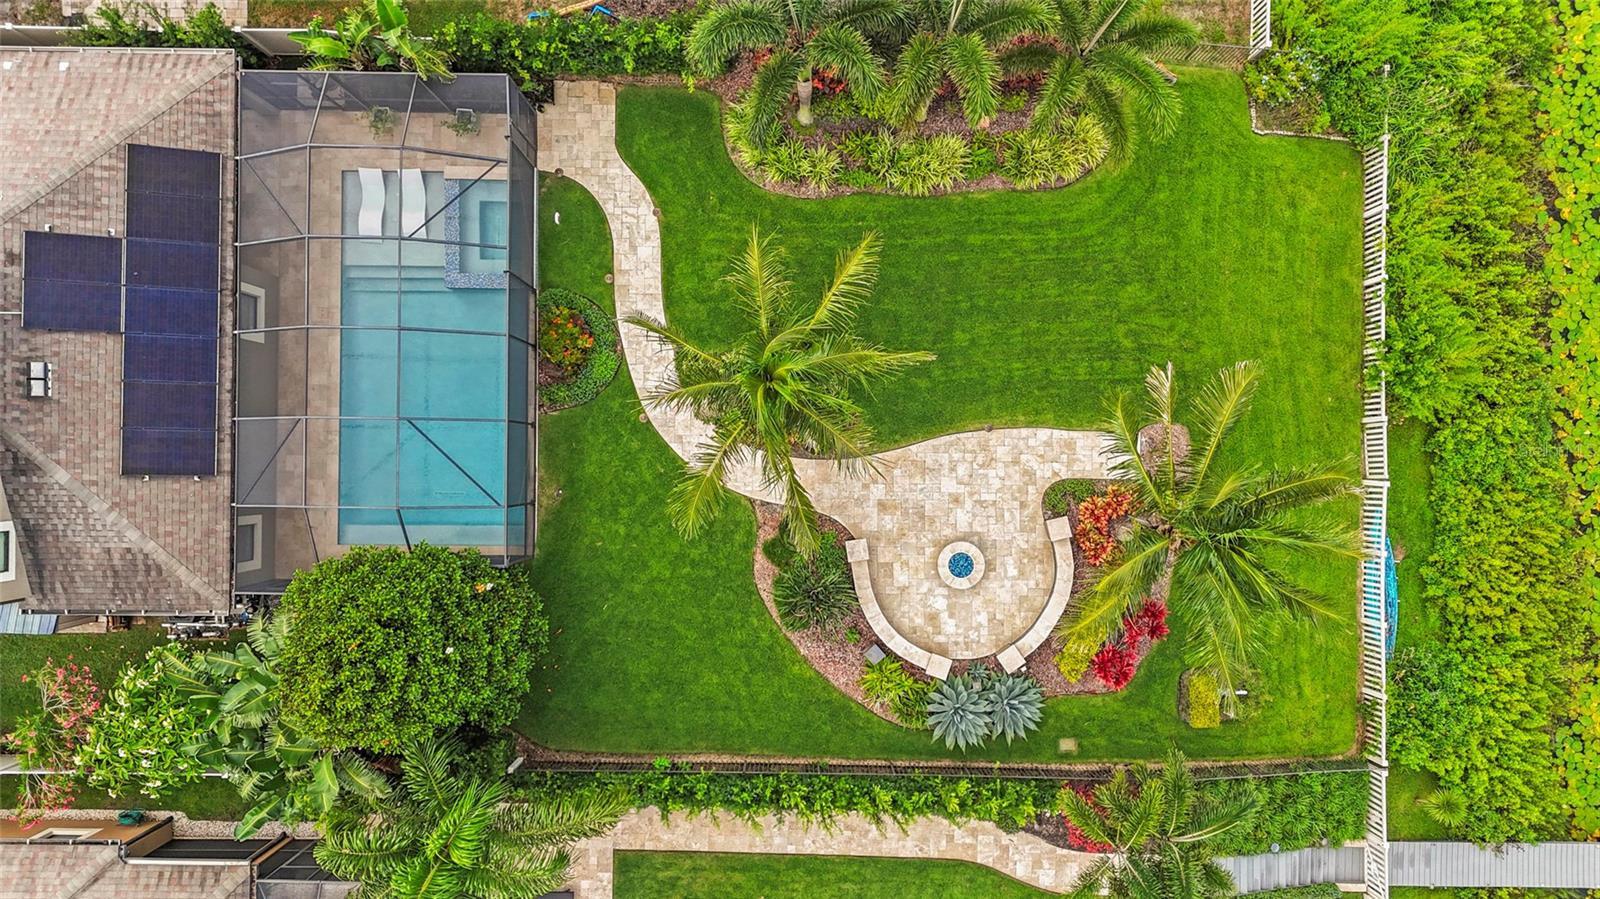
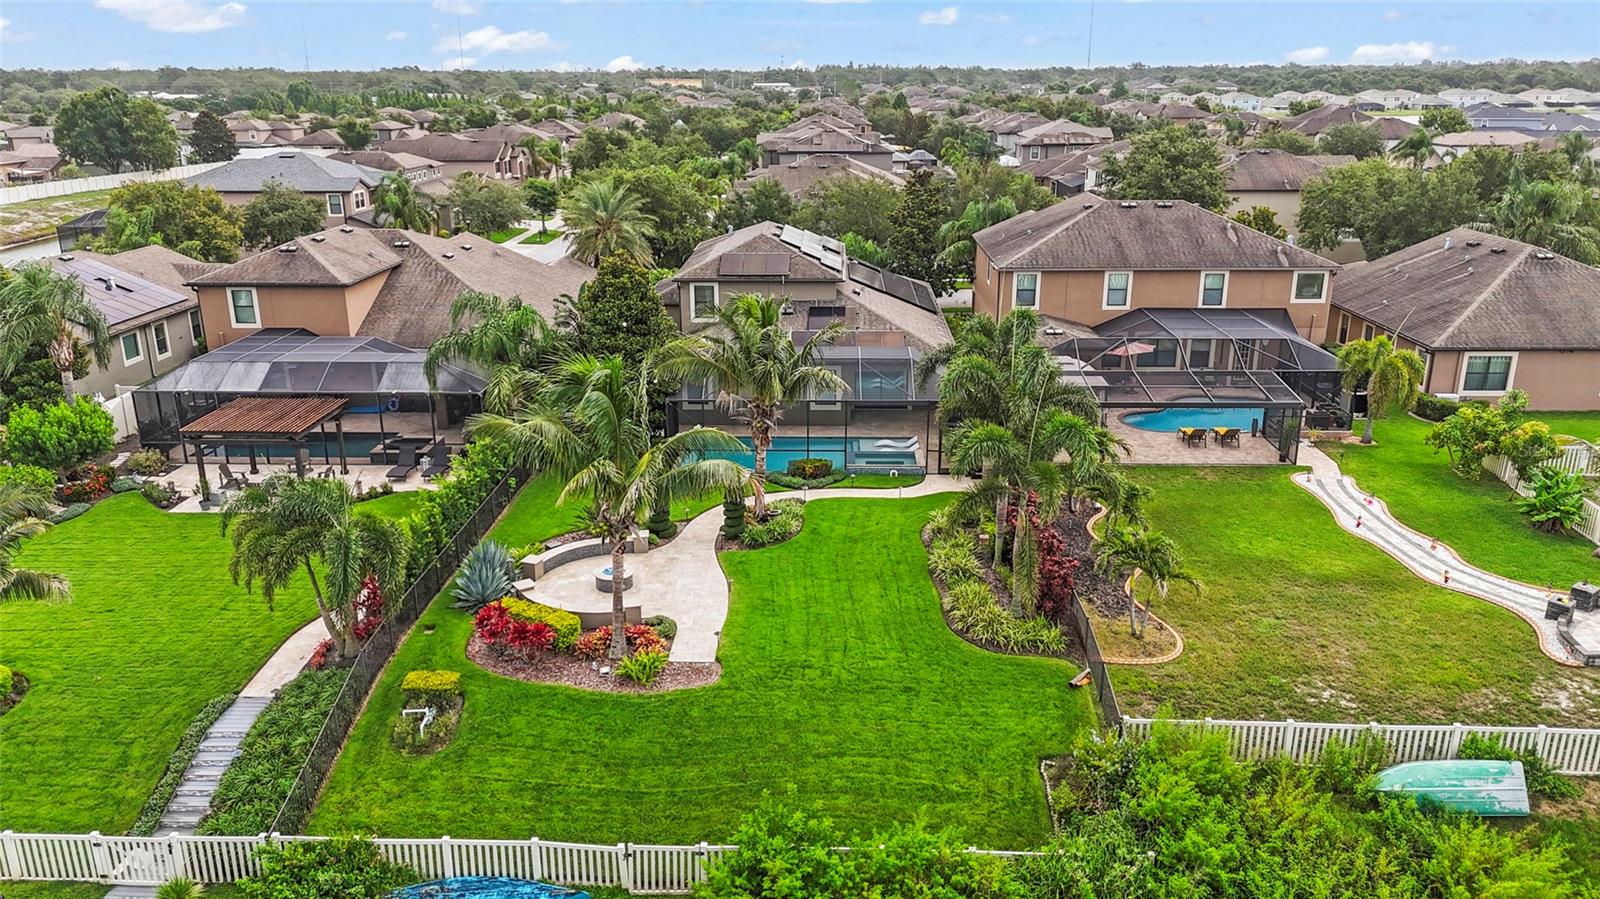
Property Description
Under contract-accepting backup offers. Lakeside Luxury with Pool, Spa, and Solar — Your Dream Home Awaits! Welcome to 11603 Heron Watch Place, a beautifully remodeled four-bedroom, three-bathroom home nestled in the peaceful community of Riverview. Offering 2,988 square feet of thoughtfully updated living space, this property is truly one-of-a-kind, FEATURING AN ADDITIONAL PARCEL WITH PRIVATE LAKE ACCESS, 80FT OF WATER RIGHTS, AND NO HOA JURISDICTION—an exceptional combination of privacy, functionality, and freedom. ENJOY 60FT OF SERENE LAKE FRONTAGE AND STUNNING SUNSET VIEWS from your own backyard. The additional parcel behind the home provides both flexibility and value, with ultra-low taxes and zoning that allows for future creative use. The interior of the home has been completely renovated with upscale finishes, featuring custom cabinetry in both the kitchen and bathrooms, Brizo shower and tub faucets in the primary bathroom with lighted vanity mirrors, built-in closets on the main floor, a spacious second-floor bonus/flex space with a built-in wet bar that flows into a generously sized guest room, and a layout that seamlessly combines modern design with everyday comfort. Step outside to your own resort-style escape, complete with a SALTWATER HEATED POOL and OVERSIZED SPA featuring tri-vent therapeutic seating. Surrounded by elegant travertine pavers and custom tile work installed in 2021, the outdoor space is both luxurious and low-maintenance. The pool and spa are fully automated and can be controlled remotely through the Pentair app. Lush landscaping adds to the tranquil atmosphere, including mature coconut and foxtail palms along with a majestic southern magnolia. The irrigation system, serviced in 2024, DRAWS WATER DIRECTLY FROM THE LAKE, keeping your lawn vibrant while keeping WATER BILLS REMARKABLY LOW, typically between $40 and $50 per month. Energy efficiency is a standout feature, thanks to a robust, OWNED SOLAR PANEL system that REDUCES ELECTRIC BILLS from approximately $600 to just $35 per month. For pet lovers, the yard includes a durable, pet-friendly artificial turf dog run. A custom propane firepit creates a warm and inviting space for outdoor entertaining. Additional highlights include a spacious three-car garage with a wide driveway, HOA dues of just $180 per quarter, and NO CDD fees. The home is NOT located in a flood zone and features a fully fenced backyard with custom landscape lighting for added ambiance and privacy. This is more than just a home—it's a private retreat that perfectly blends comfort, beauty, and efficiency. Schedule your private tour today and discover everything this exceptional lakeside property has to offer. VA loan is assumable with a low 2.25% interest rate!
Build Your Team
Quickly find investor-friendly professionals who can help you succeed in real estate investing at any stage of the investing journey.


Agents
Match with investor-friendly agents who can help you find, analyze, and close your next deal


Lenders
Get the best funding…find investor-friendly lenders who specialize in your deal strategy


Property Managers
Transition to passive investing. Find a trusted property management partnership that lasts.


Tax Pros & Accountants
Taxes and financial reporting made easy—find experts to create tax savings strategies, file taxes, and more
Location
Property Details
Parking
- Description: Garage
- Details: Driveway, Garage Door Opener, Oversized, Attached
- Garage Spaces: 3
- Spaces Total: 0
Bedroom Information
- # of Bedrooms: 4
Bathroom Information
- # of Baths (Full): 3
- # of Baths (Total): 3.0
Interior Features
- # of Rooms: 3
- # of Stories: 2
Exterior Features
- Exterior Walls Materials: Stucco
- Foundation: Slab
- Roof Type: Gable or Hip
- Roof Material: Shingle
- Pool: Yes
HOA
- Has HOA: Yes
- Association: McNeil Management Services - Jeff Shreaves
- HOA Fee: $180/quarterly
Land Information
- Land Use: Residential
- Land Use Subtype: Single Family Residential
Lot Information
- Parcel ID: U3330209UN000008000060
- Lot Size: 11313 sqft
Property Information
- Property Type: Single Family Residence
- Year Built: 2014
Tax Information
- Annual Tax: $1,079
Utilities
- Water & Sewer: Public
- Heating: Central
- Cooling: Central Air
Location
- County: Hillsborough
Listing Details
Investment Summary
- Monthly Cash Flow
- -$1,784
- Cap Rate
- 3.3%
- Cash-on-Cash Return
- -12.4%
- Debt Coverage Ratio
- 0.54
- Internal Rate of Return (5 years)
- -8.0%
Cash Flow
Net Operating Income (NOI) minus mortgage payments.
Calculation:
NOI - Mortgage Payments
Cap Rate (Market Value)
Capitalization Rate is a rate of return that compares the yearly Net Operating Income (NOI) to the market value.
Calculation:
NOI / Market Value
Cash-on-Cash Return (CoC)
Annual Cash Flow / Cash Invested
Calculation:
Annual cash flow divided by initial cash invested.
Debt Coverage Ratio (DCR)
Net Operating Income (NOI) divided by total debt payments.
Calculation:
NOI / Total Debt Payments
Internal Rate of Return (IRR)
A metric for assessing profitability over time. IRR is the discount rate at which the net present value (NPV) of all future cash flows (positive and negative) from an investment equals zero — including both periodic cash flow (such as rent) and a projected sale at the end of the holding period. It represents the expected annualized return, accounting for income, expenses, and the recovery of capital through a future sale.
Purchase Details
Purchase PriceThe price paid for the property. Purchase price:
| $750,000 |
|---|---|
Amount FinancedThe amount of the purchase financed through a loan. Amount financed:
| -$600,000 |
Down paymentThe initial payment made towards the purchase. Down payment:
| $150,000 |
Closing CostsFees and expenses associated with purchasing a property, typically ranging from 2% to 5% of the home’s purchase price, paid at the end of a home purchase to cover services like lending, title transfer, and taxes. Closing costs:
| $22,500 |
Rehab CostsCosts incurred to repair or improve the property, including: roof, flooring, exterior siding, kitchen, exterior paint, bathrooms, etc. Rehab costs:
| $0 |
Initial Cash InvestedThe total initial cash invested in the property. Calculation:Down payment + Buying costs + Rehab costs Initial cash invested:
| $172,500 |
Square Feet (SQFT)The total square footage of the property. Square feet:
| 2,988 |
Cost Per Square FootCost per square foot of the property. Calculation:Purchase Price / Square Feet Cost per square foot:
| $251 |
Monthly Rent Per Square FootMonthly rent divided by the number of square feet. This ratio helps investors compare rental income efficiency across properties, markets, and unit sizes Calculation:Monthly Rent / Square Feet Monthly rent per square foot:
| $1.07 |
Financing Details
Loan AmountThe total sum of money borrowed from a lender to finance a property purchase. Calculation:Purchase Price - Down Payment
Loan amount:
| $600,000 |
|---|---|
Loan to Value Ratio (LTV)Loan amount divided by the market value of the property. Calculation:Loan Amount / Market Value
Loan to value ratio:
| 80.0% |
Loan TypeThe type of loan (e.g., fixed, adjustable).
Loan type:
| Amortizing |
TermThe loan repayment period in years.
Term:
| 30 years |
Interest RateThe percentage a lender charges on the borrowed amount of a loan, determining the cost of borrowing money.
Interest rate:
| 6.625% |
Principal & Interest (PI)The principal is the portion of the loan payment that reduces the loan balance. The interest is the lender's charge for borrowing money. Calculation:(P * r * (1 + r) ** n) / ((1 + r) ** n - 1) Where:
P = Loan amount (principal)
Principal & interest:
| $3,842 |
Property TaxesAnnual taxes levied by local governments on real estate properties. These taxes fund public services like schools, roads, and emergency services.
Property tax:
| $90 |
InsuranceThe costs for insurance coverage to protect against financial losses due to risks like fire, natural disasters, theft, liability, or tenant-related damages. Calculation:Assumes 7% of gross rental income, unless insurance rates are specified.
Insurance:
| $224 |
Private Mortgage Insurance (PMI)A fee that borrowers pay when they take out a conventional loan with a loan-to-value (LTV) ratio above 80%.
Private mortgage insurance (PMI):
| $0 |
Monthly PaymentThe fixed amount a borrower pays each month to repay a loan. It typically includes principal and interest (P&I) and may also cover property taxes, insurance, HOA fees, and PMI if escrowed. Monthly payment:
| $4,156 |
Operating Income
| % Rent | Monthly | Yearly | |
|---|---|---|---|
Gross RentThe total rental income received from tenants before deducting any expenses. Includes base rent, late fees, pet fees, parking fees, and other recurring charges.
Gross rent:
| $3,200 | $38,400 | |
Vacancy LossExpected loss of rent due to vacancies.
Vacancy loss:
(6%)
| 6% | -$192 | -$2,304 |
Operating IncomeGross rental income minus vacancy loss. Calculation:Gross rent - Vacancy loss
Operating income:
| $3,008 | $36,096 |
Operating Expenses
| % Rent | Monthly | Yearly | |
|---|---|---|---|
Property TaxesAnnual taxes levied by local governments on real estate properties. These taxes fund public services like schools, roads, and emergency services. | 3% | -$90 | -$1,080 |
InsuranceThe costs for insurance coverage to protect against financial losses due to risks like fire, natural disasters, theft, liability, or tenant-related damages. Calculation:Assumes 7% of gross rental income, unless insurance rates are specified. | 7% | -$224 | -$2,688 |
Property ManagementThe costs associated with hiring a property manager to handle the day-to-day operations of a rental property. Includes management fees, leasing fes, eviction fees, etc. Calculation:Assumes 8% of gross rental income. | 8% | -$256 | -$3,072 |
Repairs & MaintenanceOngoing costs for routine upkeep and minor fixes needed to keep a property in good working condition. Calculation:Assumes 5% of gross rental income. Varies by property age and condition. | 5% | -$160 | -$1,920 |
Capital ExpensesLarge, infrequent costs for major improvements or replacements, like a new roof, HVAC system, or appliances. Calculation:Assumes 5% of gross rental income. Varies by property age. | 5% | -$160 | -$1,920 |
HOA FeesRegular dues paid to a Homeowners Association for community maintenance, amenities, and management. Similar fees include: Condo Association Fees, Co-op Maintenance Fees, etc. | 2% | -$60 | -$720 |
Operating ExpensesRecurring costs required to maintain and manage a rental property, including property taxes, insurance, maintenance, repairs, utilities (if paid by the owner), property management fees, and other day-to-day expenses. Calculation:Insurance + Property Taxes + Property Management + Repairs & Maintenance + Capital Expenditures + HOA Fees | 30% | -$950 | -$11,400 |
Cash Flow
| Monthly | Yearly | |
|---|---|---|
Net Operating Income (NOI)The income generated from a property after deducting all operating expenses but before deducting mortgage payments, taxes, and capital expenditures. Calculation:Gross Operating Income - Operating Expenses
Net operating income:
| $2,058 | $24,696 |
Mortgage PaymentThe fixed amount a borrower pays each month to repay a loan. It typically includes principal and interest (P&I) and may also cover property taxes, insurance, HOA fees, and PMI if escrowed. | -$3,842 | -$46,104 |
Cash FlowNet Operating Income (NOI) minus mortgage payments. Calculation:NOI - Mortgage Payments | $1,784 | $21,408 |