$499,950
Investment Summary
- Monthly Cash Flow
- -$971
- Cap Rate
- 3.8%
- Cash-on-Cash Return
- -10.1%
- Debt Coverage Ratio
- 0.62
- Internal Rate of Return (5 years)
- -5.8%
Cash Flow
Net Operating Income (NOI) minus mortgage payments.
Calculation:
NOI - Mortgage Payments
Cap Rate (Market Value)
Capitalization Rate is a rate of return that compares the yearly Net Operating Income (NOI) to the market value.
Calculation:
NOI / Market Value
Cash-on-Cash Return (CoC)
Annual Cash Flow / Cash Invested
Calculation:
Annual cash flow divided by initial cash invested.
Debt Coverage Ratio (DCR)
Net Operating Income (NOI) divided by total debt payments.
Calculation:
NOI / Total Debt Payments
Internal Rate of Return (IRR)
A metric for assessing profitability over time. IRR is the discount rate at which the net present value (NPV) of all future cash flows (positive and negative) from an investment equals zero — including both periodic cash flow (such as rent) and a projected sale at the end of the holding period. It represents the expected annualized return, accounting for income, expenses, and the recovery of capital through a future sale.
Property Description
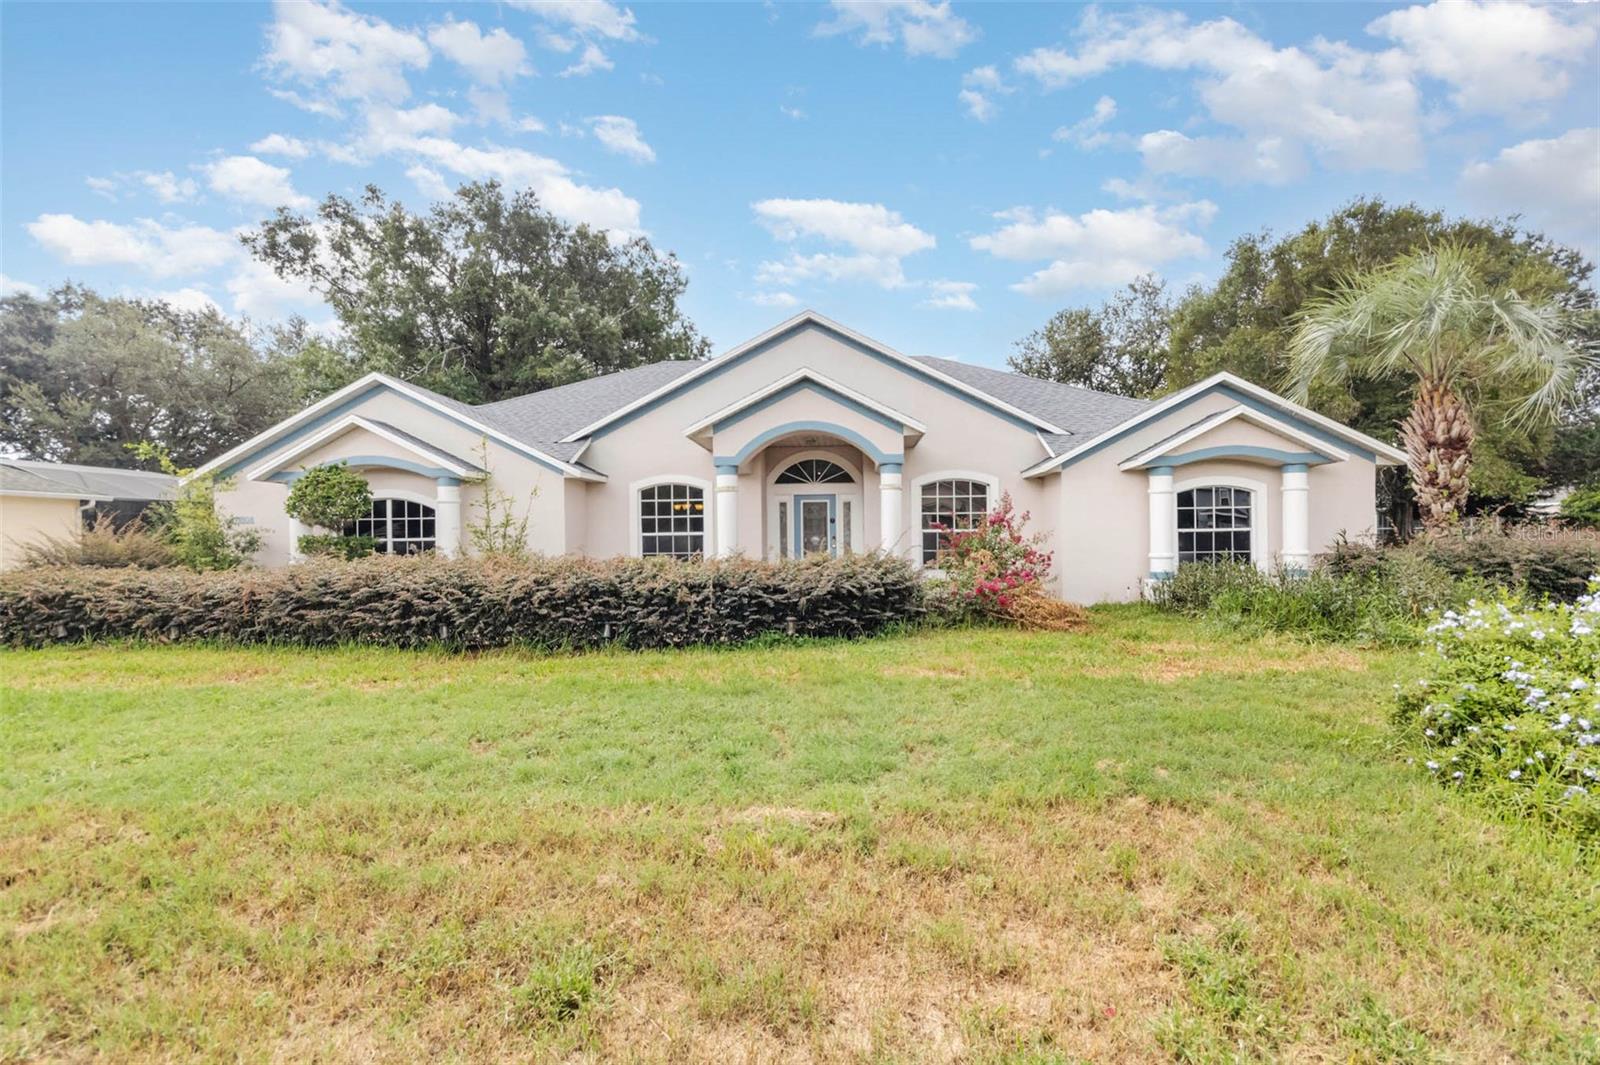
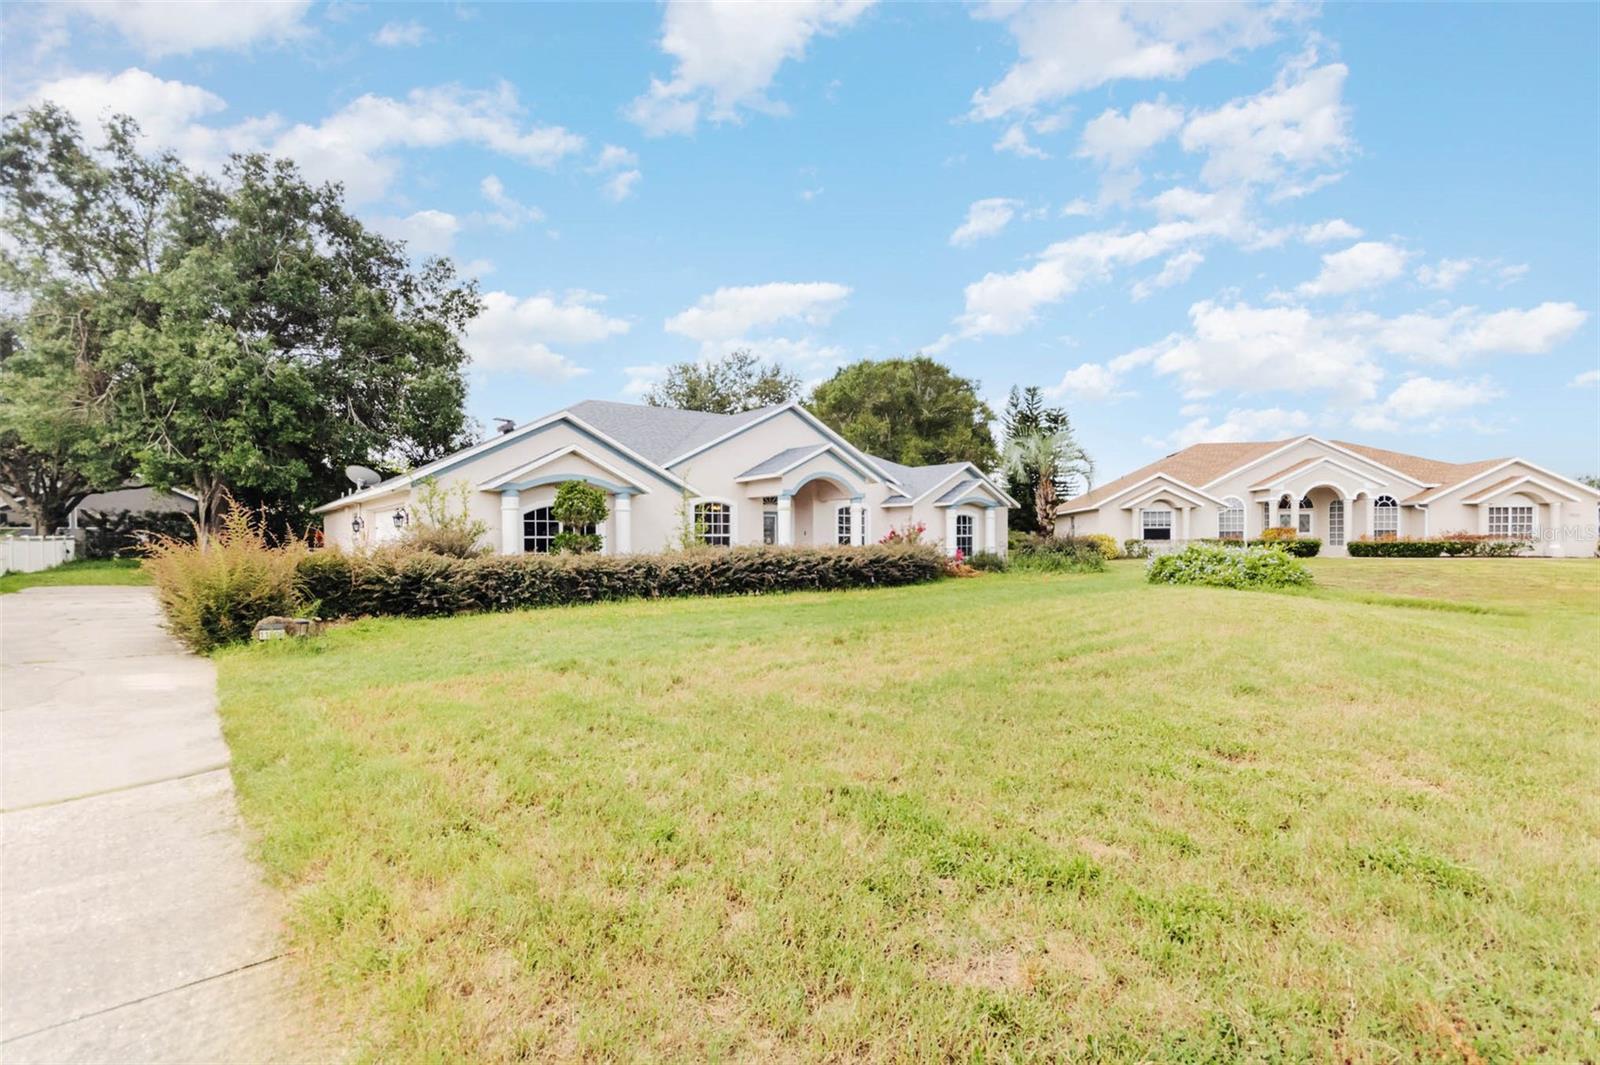
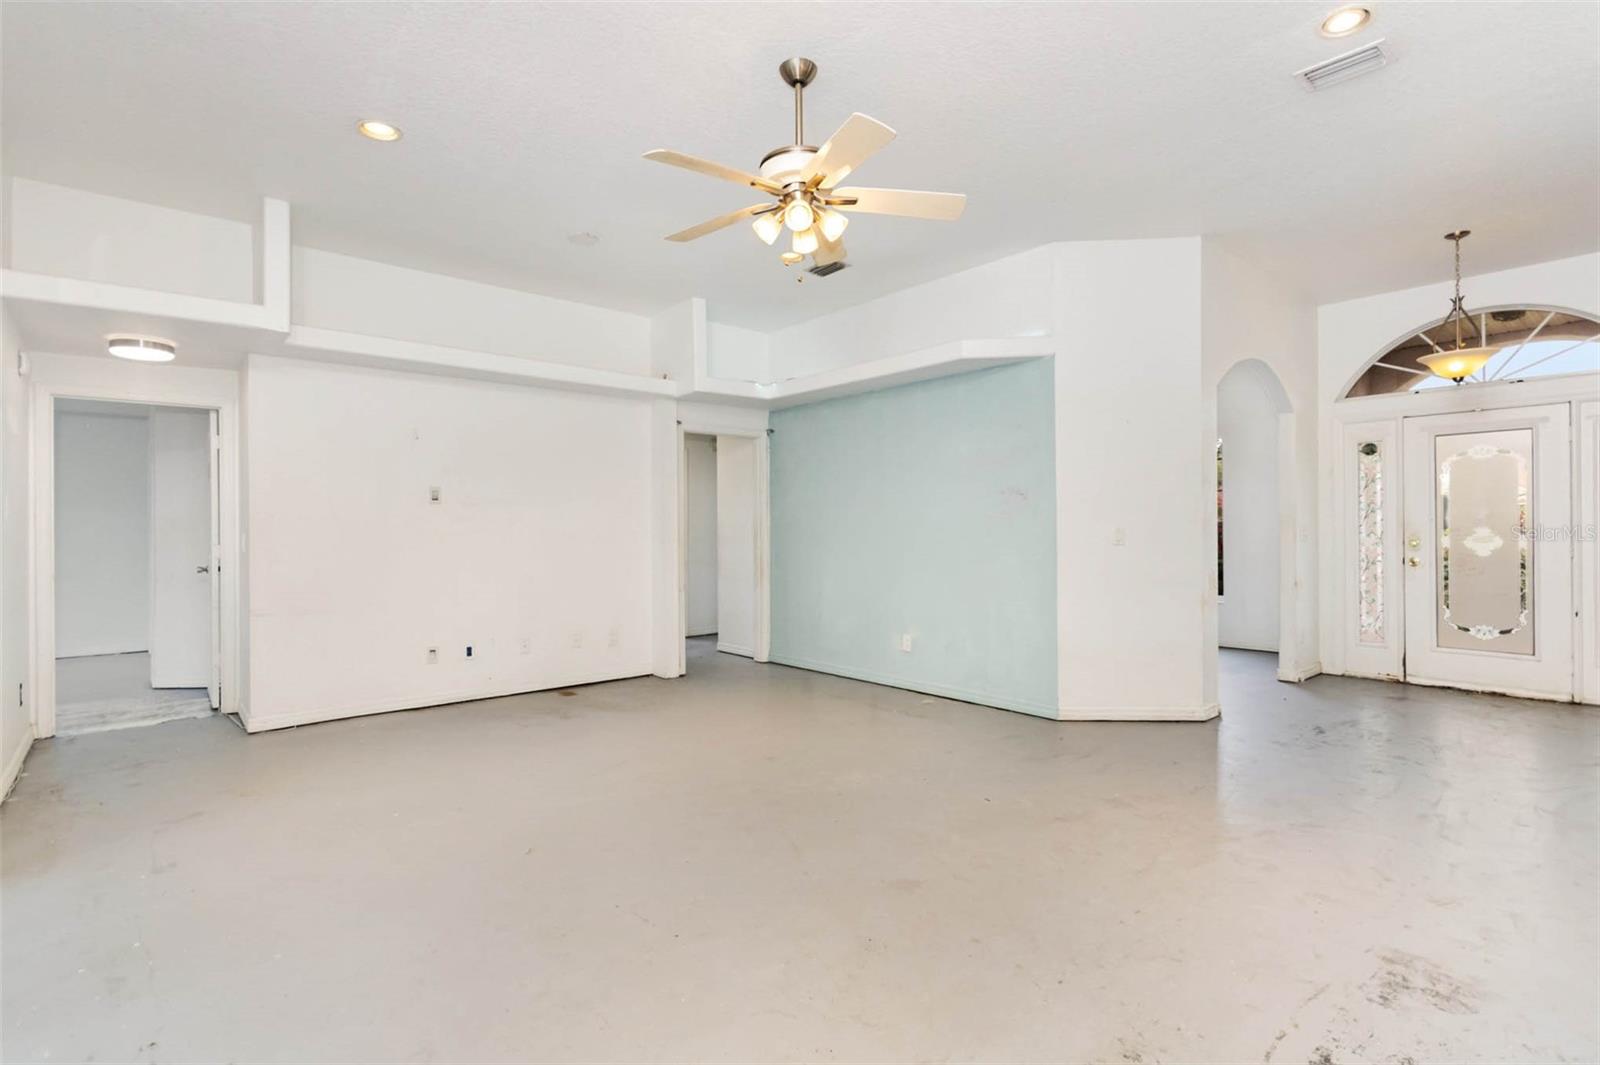
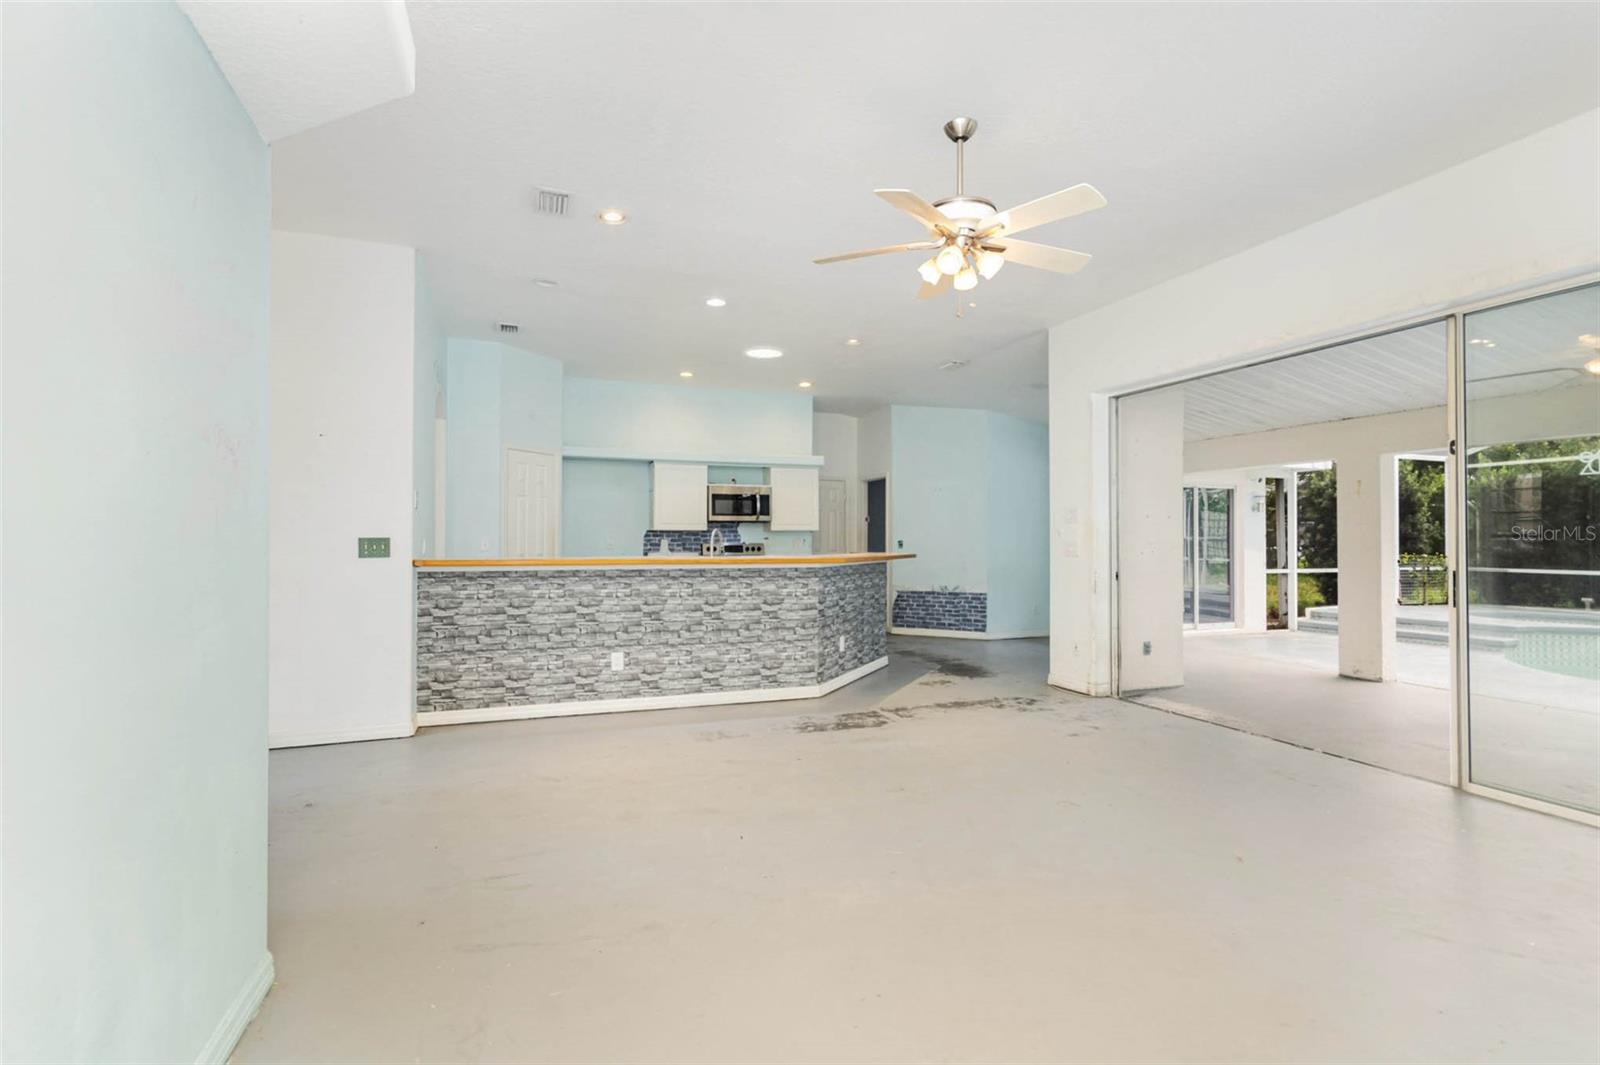
One or more photo(s) has been virtually staged. Welcome to 11808 Ridge View Cir in beautiful Clermont, Florida! This impressive 4-bedroom, 3-bathroom home boasts over 2,400 square feet of living space and is nestled within the sought-after Lake Ridge Club community, offering both privacy and peace of mind. There is a community pool, clubhouse and boat/RV storage available. With its spacious layout, oversized bedrooms, and expansive common areas, this home provides the perfect canvas for your personal touches and creative vision. As you step through the front door, you’re immediately greeted by a generously sized foyer and open-concept living and dining areas that flow seamlessly into a spacious family room ideal for hosting guests, movie nights, or cozy evenings at home. Natural light pours in through large windows, highlighting the home's open layout and airy atmosphere. The kitchen offers ample cabinetry, a large pantry, and plenty of counter space for meal prep or entertaining. There's also a casual dining area that overlooks the backyard, perfect for morning coffee or casual family meals. Each of the 4 bedrooms is generously sized, providing plenty of room for relaxation, play, or productivity. Whether you need a home office, guest suite, or private retreat, this home has the flexibility to accommodate your lifestyle. The primary suite is a true standout, featuring an oversized layout, a spacious en-suite bathroom, and a large walk-in closet that will more than satisfy your storage needs. Additional bedrooms also offer large closets, giving everyone the space they need to stay organized and clutter-free. With 3 full bathrooms, there's no shortage of comfort and convenience for family and guests alike. A large 2-car garage with laundry hookups and plenty of storage options add to the home’s practical appeal. This home presents a fantastic opportunity for a buyer to freshen it up and make it truly shine. Whether you're a growing family or someone looking to invest in a home with great bones in a desirable community, this property delivers on space, value, and potential. Outside, the home sits on a quiet cul-de-sac with a spacious yard ready for your landscaping ideas or outdoor entertainment dreams. Enjoy the tranquility of a quiet subdivision while being just minutes from Clermont’s many offerings. Living in Clermont means you're close to it all, from beautiful nature escapes like Richloam Wildlife Management and Crystal Springs to shopping, dining, and top-rated schools. Outdoor enthusiasts will appreciate the abundance of hiking, biking, kayaking, and fishing opportunities, while commuters will love the easy access to I-4, connecting you to Orlando and surrounding areas with ease. Don’t miss your chance to own a home of this size and potential in one of Clermont’s sought-after communities. Schedule your private showing today and imagine the possibilities that await at 11808 Ridge View Cir!
Build Your Team
Quickly find investor-friendly professionals who can help you succeed in real estate investing at any stage of the investing journey.


Agents
Match with investor-friendly agents who can help you find, analyze, and close your next deal


Lenders
Get the best funding…find investor-friendly lenders who specialize in your deal strategy


Property Managers
Transition to passive investing. Find a trusted property management partnership that lasts.


Tax Pros & Accountants
Taxes and financial reporting made easy—find experts to create tax savings strategies, file taxes, and more
Location
Property Details
Parking
- Description: Garage Door Opener, Garage Faces Rear, Garage Faces Side, Oversized
- Details: Driveway, Off Street, Other, Attached
- Garage Spaces: 2
- Spaces Total: 0
Bedroom Information
- # of Bedrooms: 4
Bathroom Information
- # of Baths (Full): 3
- # of Baths (Total): 3.0
Interior Features
- # of Rooms: 8
- # of Stories: 1
Exterior Features
- Exterior Walls Materials: Brick Veneer
- Foundation: Slab
- Roof Material: Shingle
- Pool: Yes
HOA
- Has HOA: Yes
- Association: Lake Ridge Club / Empire Management Group
- HOA Fee: $185/quarterly
Land Information
- Land Use: Residential
- Land Use Subtype: Single Family Residential
Lot Information
- Parcel ID: 312226035500006100
- Lot Size: 16611 sqft
Property Information
- Property Type: Single Family Residence
- Year Built: 1996
Tax Information
- Annual Tax: $3,357
Utilities
- Water & Sewer: Public
- Heating: Central
- Cooling: Central Air
Location
- County: Lake
Listing Details
Investment Summary
- Monthly Cash Flow
- -$971
- Cap Rate
- 3.8%
- Cash-on-Cash Return
- -10.1%
- Debt Coverage Ratio
- 0.62
- Internal Rate of Return (5 years)
- -5.8%
Cash Flow
Net Operating Income (NOI) minus mortgage payments.
Calculation:
NOI - Mortgage Payments
Cap Rate (Market Value)
Capitalization Rate is a rate of return that compares the yearly Net Operating Income (NOI) to the market value.
Calculation:
NOI / Market Value
Cash-on-Cash Return (CoC)
Annual Cash Flow / Cash Invested
Calculation:
Annual cash flow divided by initial cash invested.
Debt Coverage Ratio (DCR)
Net Operating Income (NOI) divided by total debt payments.
Calculation:
NOI / Total Debt Payments
Internal Rate of Return (IRR)
A metric for assessing profitability over time. IRR is the discount rate at which the net present value (NPV) of all future cash flows (positive and negative) from an investment equals zero — including both periodic cash flow (such as rent) and a projected sale at the end of the holding period. It represents the expected annualized return, accounting for income, expenses, and the recovery of capital through a future sale.
Purchase Details
Purchase PriceThe price paid for the property. Purchase price:
| $499,950 |
|---|---|
Amount FinancedThe amount of the purchase financed through a loan. Amount financed:
| -$399,960 |
Down paymentThe initial payment made towards the purchase. Down payment:
| $99,990 |
Closing CostsFees and expenses associated with purchasing a property, typically ranging from 2% to 5% of the home’s purchase price, paid at the end of a home purchase to cover services like lending, title transfer, and taxes. Closing costs:
| $14,999 |
Rehab CostsCosts incurred to repair or improve the property, including: roof, flooring, exterior siding, kitchen, exterior paint, bathrooms, etc. Rehab costs:
| $0 |
Initial Cash InvestedThe total initial cash invested in the property. Calculation:Down payment + Buying costs + Rehab costs Initial cash invested:
| $114,989 |
Square Feet (SQFT)The total square footage of the property. Square feet:
| 2,430 |
Cost Per Square FootCost per square foot of the property. Calculation:Purchase Price / Square Feet Cost per square foot:
| $206 |
Monthly Rent Per Square FootMonthly rent divided by the number of square feet. This ratio helps investors compare rental income efficiency across properties, markets, and unit sizes Calculation:Monthly Rent / Square Feet Monthly rent per square foot:
| $1.15 |
Financing Details
Loan AmountThe total sum of money borrowed from a lender to finance a property purchase. Calculation:Purchase Price - Down Payment
Loan amount:
| $399,960 |
|---|---|
Loan to Value Ratio (LTV)Loan amount divided by the market value of the property. Calculation:Loan Amount / Market Value
Loan to value ratio:
| 80.0% |
Loan TypeThe type of loan (e.g., fixed, adjustable).
Loan type:
| Amortizing |
TermThe loan repayment period in years.
Term:
| 30 years |
Interest RateThe percentage a lender charges on the borrowed amount of a loan, determining the cost of borrowing money.
Interest rate:
| 6.625% |
Principal & Interest (PI)The principal is the portion of the loan payment that reduces the loan balance. The interest is the lender's charge for borrowing money. Calculation:(P * r * (1 + r) ** n) / ((1 + r) ** n - 1) Where:
P = Loan amount (principal)
Principal & interest:
| $2,561 |
Property TaxesAnnual taxes levied by local governments on real estate properties. These taxes fund public services like schools, roads, and emergency services.
Property tax:
| $280 |
InsuranceThe costs for insurance coverage to protect against financial losses due to risks like fire, natural disasters, theft, liability, or tenant-related damages. Calculation:Assumes 7% of gross rental income, unless insurance rates are specified.
Insurance:
| $196 |
Private Mortgage Insurance (PMI)A fee that borrowers pay when they take out a conventional loan with a loan-to-value (LTV) ratio above 80%.
Private mortgage insurance (PMI):
| $0 |
Monthly PaymentThe fixed amount a borrower pays each month to repay a loan. It typically includes principal and interest (P&I) and may also cover property taxes, insurance, HOA fees, and PMI if escrowed. Monthly payment:
| $3,037 |
Operating Income
| % Rent | Monthly | Yearly | |
|---|---|---|---|
Gross RentThe total rental income received from tenants before deducting any expenses. Includes base rent, late fees, pet fees, parking fees, and other recurring charges.
Gross rent:
| $2,800 | $33,600 | |
Vacancy LossExpected loss of rent due to vacancies.
Vacancy loss:
(6%)
| 6% | -$168 | -$2,016 |
Operating IncomeGross rental income minus vacancy loss. Calculation:Gross rent - Vacancy loss
Operating income:
| $2,632 | $31,584 |
Operating Expenses
| % Rent | Monthly | Yearly | |
|---|---|---|---|
Property TaxesAnnual taxes levied by local governments on real estate properties. These taxes fund public services like schools, roads, and emergency services. | 10% | -$280 | -$3,357 |
InsuranceThe costs for insurance coverage to protect against financial losses due to risks like fire, natural disasters, theft, liability, or tenant-related damages. Calculation:Assumes 7% of gross rental income, unless insurance rates are specified. | 7% | -$196 | -$2,352 |
Property ManagementThe costs associated with hiring a property manager to handle the day-to-day operations of a rental property. Includes management fees, leasing fes, eviction fees, etc. Calculation:Assumes 8% of gross rental income. | 8% | -$224 | -$2,688 |
Repairs & MaintenanceOngoing costs for routine upkeep and minor fixes needed to keep a property in good working condition. Calculation:Assumes 5% of gross rental income. Varies by property age and condition. | 5% | -$140 | -$1,680 |
Capital ExpensesLarge, infrequent costs for major improvements or replacements, like a new roof, HVAC system, or appliances. Calculation:Assumes 5% of gross rental income. Varies by property age. | 5% | -$140 | -$1,680 |
HOA FeesRegular dues paid to a Homeowners Association for community maintenance, amenities, and management. Similar fees include: Condo Association Fees, Co-op Maintenance Fees, etc. | 2% | -$62 | -$744 |
Operating ExpensesRecurring costs required to maintain and manage a rental property, including property taxes, insurance, maintenance, repairs, utilities (if paid by the owner), property management fees, and other day-to-day expenses. Calculation:Insurance + Property Taxes + Property Management + Repairs & Maintenance + Capital Expenditures + HOA Fees | 37% | -$1,042 | -$12,501 |
Cash Flow
| Monthly | Yearly | |
|---|---|---|
Net Operating Income (NOI)The income generated from a property after deducting all operating expenses but before deducting mortgage payments, taxes, and capital expenditures. Calculation:Gross Operating Income - Operating Expenses
Net operating income:
| $1,590 | $19,080 |
Mortgage PaymentThe fixed amount a borrower pays each month to repay a loan. It typically includes principal and interest (P&I) and may also cover property taxes, insurance, HOA fees, and PMI if escrowed. | -$2,561 | -$30,732 |
Cash FlowNet Operating Income (NOI) minus mortgage payments. Calculation:NOI - Mortgage Payments | $971 | $11,652 |