$699,900
Investment Summary
- Monthly Cash Flow
- -$1,416
- Cap Rate
- 3.7%
- Cash-on-Cash Return
- -10.6%
- Debt Coverage Ratio
- 0.61
- Internal Rate of Return (5 years)
- -6.2%
Cash Flow
Net Operating Income (NOI) minus mortgage payments.
Calculation:
NOI - Mortgage Payments
Cap Rate (Market Value)
Capitalization Rate is a rate of return that compares the yearly Net Operating Income (NOI) to the market value.
Calculation:
NOI / Market Value
Cash-on-Cash Return (CoC)
Annual Cash Flow / Cash Invested
Calculation:
Annual cash flow divided by initial cash invested.
Debt Coverage Ratio (DCR)
Net Operating Income (NOI) divided by total debt payments.
Calculation:
NOI / Total Debt Payments
Internal Rate of Return (IRR)
A metric for assessing profitability over time. IRR is the discount rate at which the net present value (NPV) of all future cash flows (positive and negative) from an investment equals zero — including both periodic cash flow (such as rent) and a projected sale at the end of the holding period. It represents the expected annualized return, accounting for income, expenses, and the recovery of capital through a future sale.
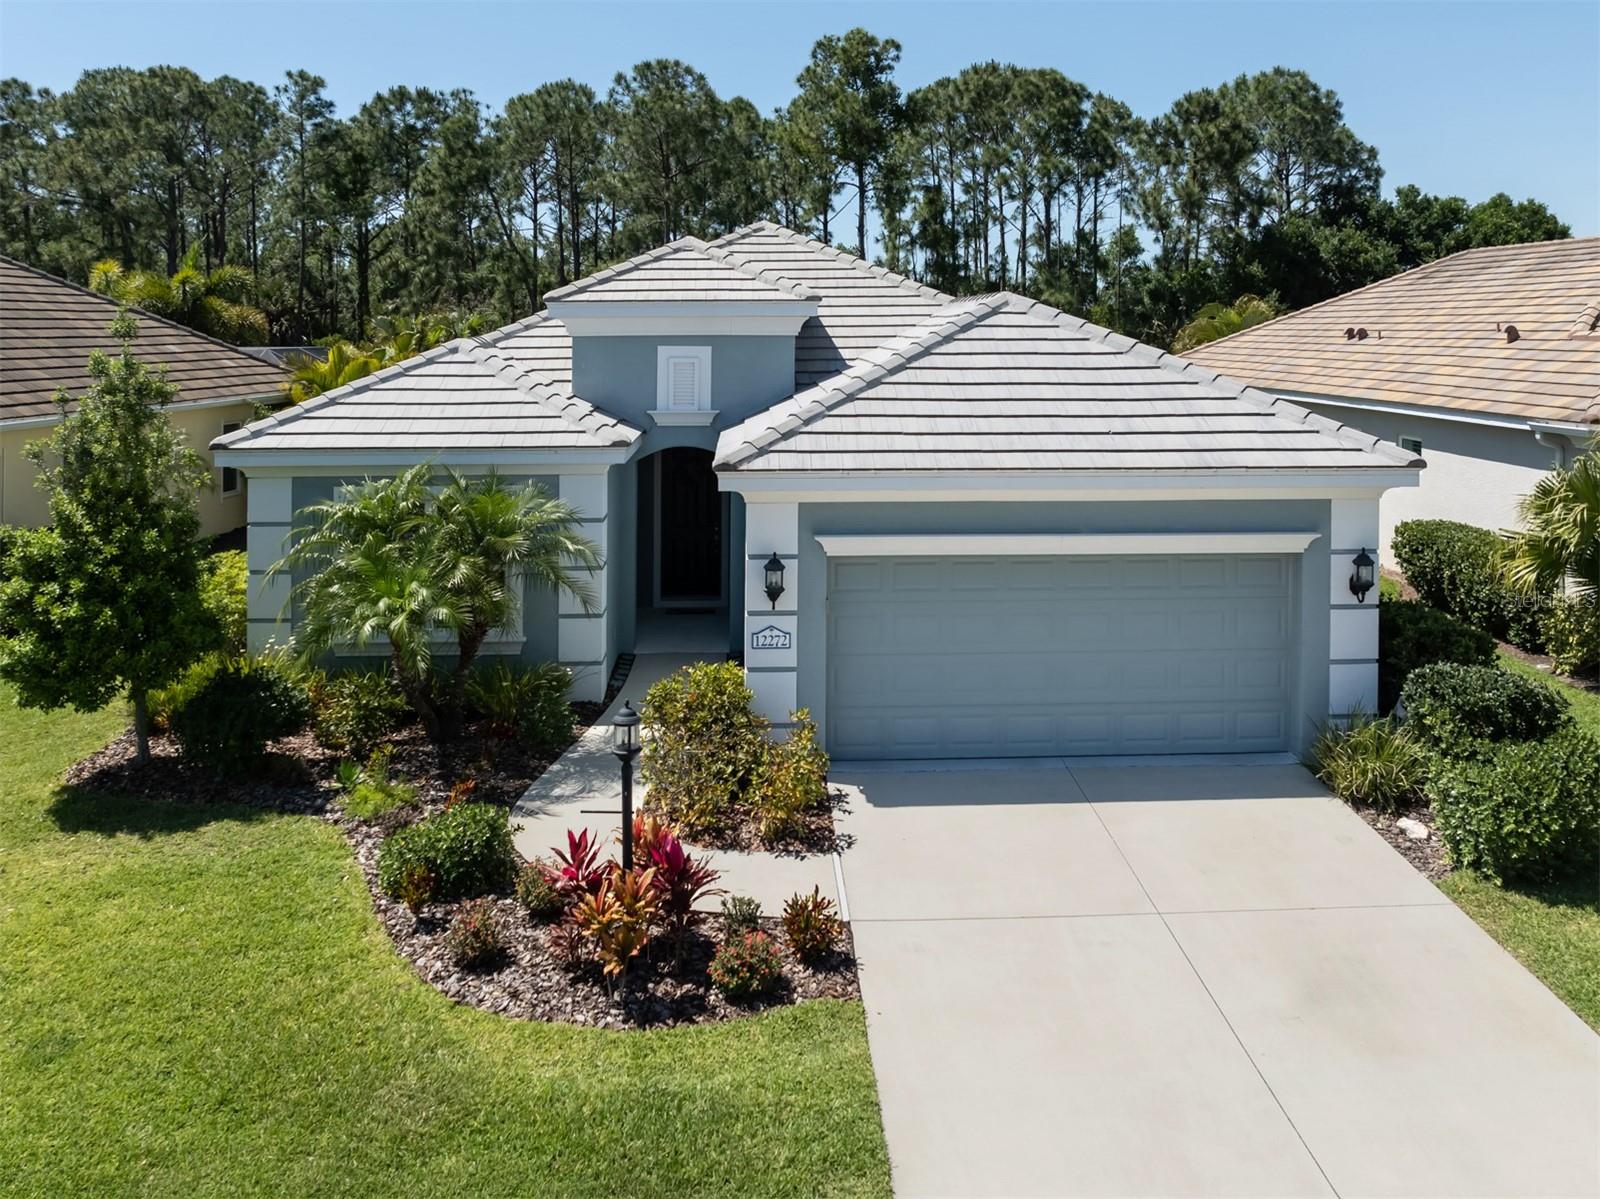
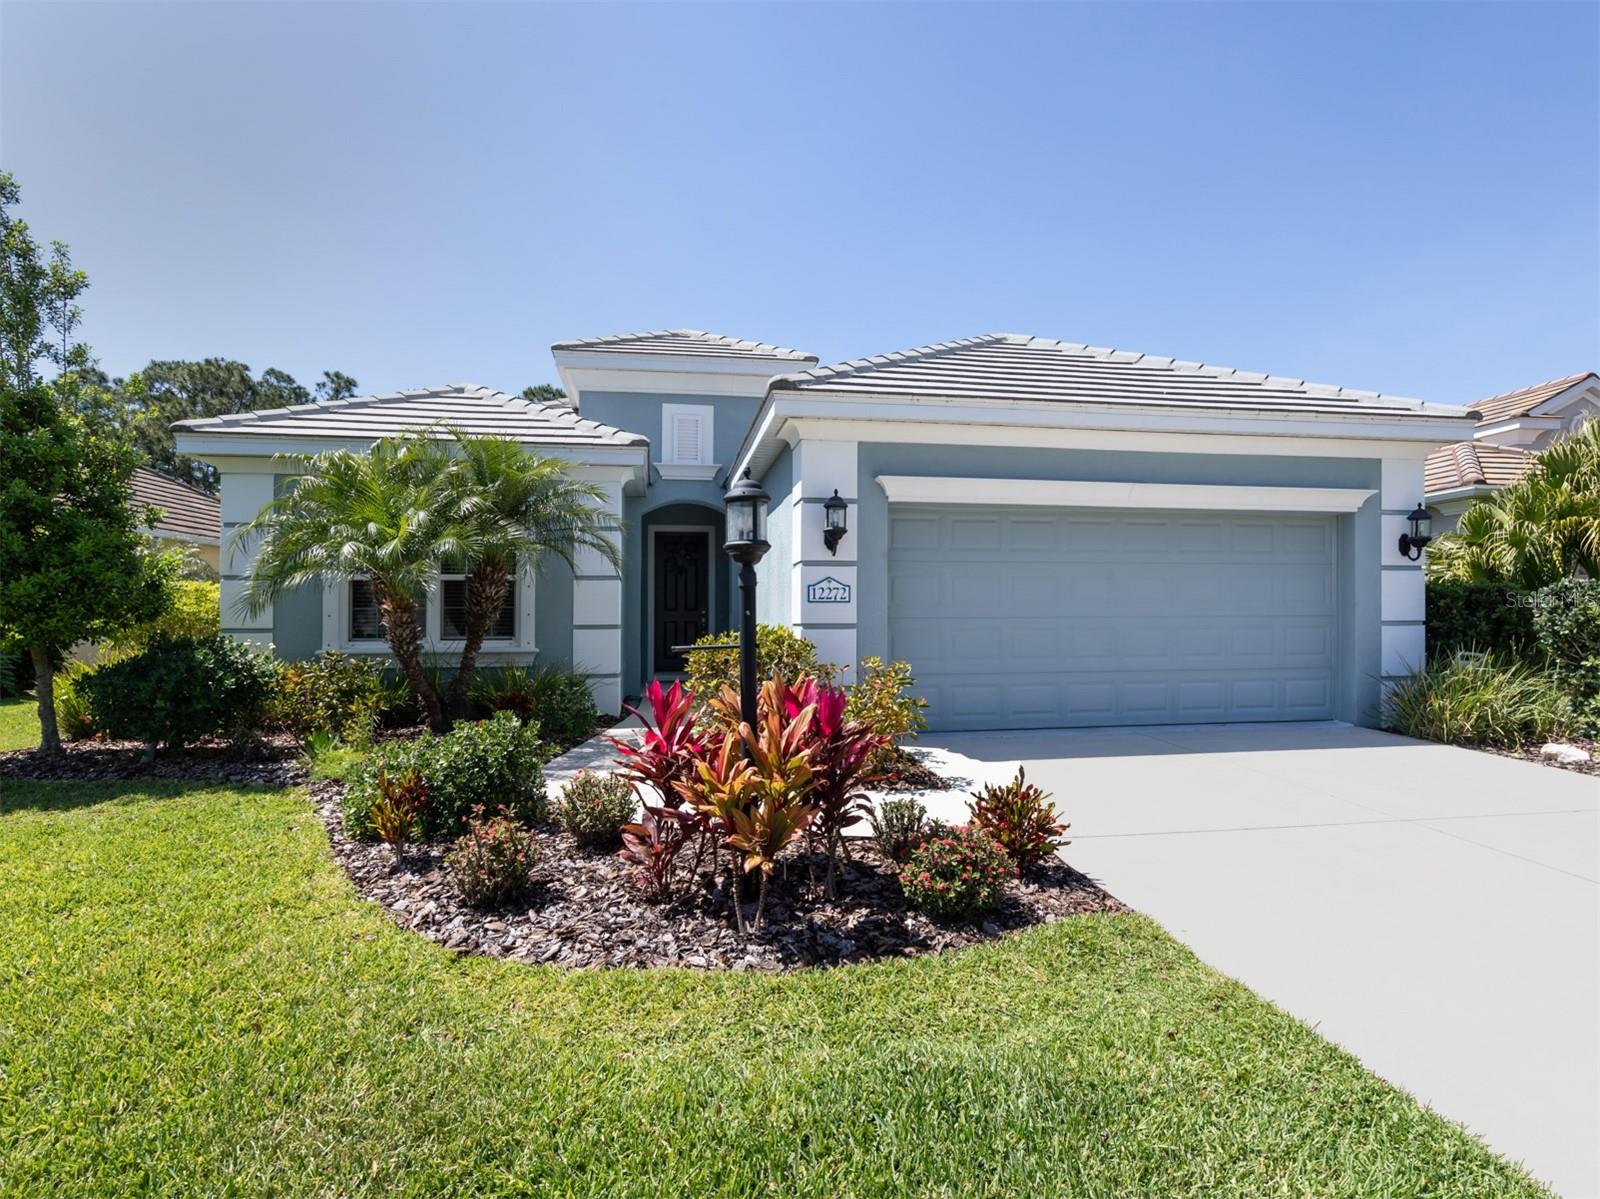
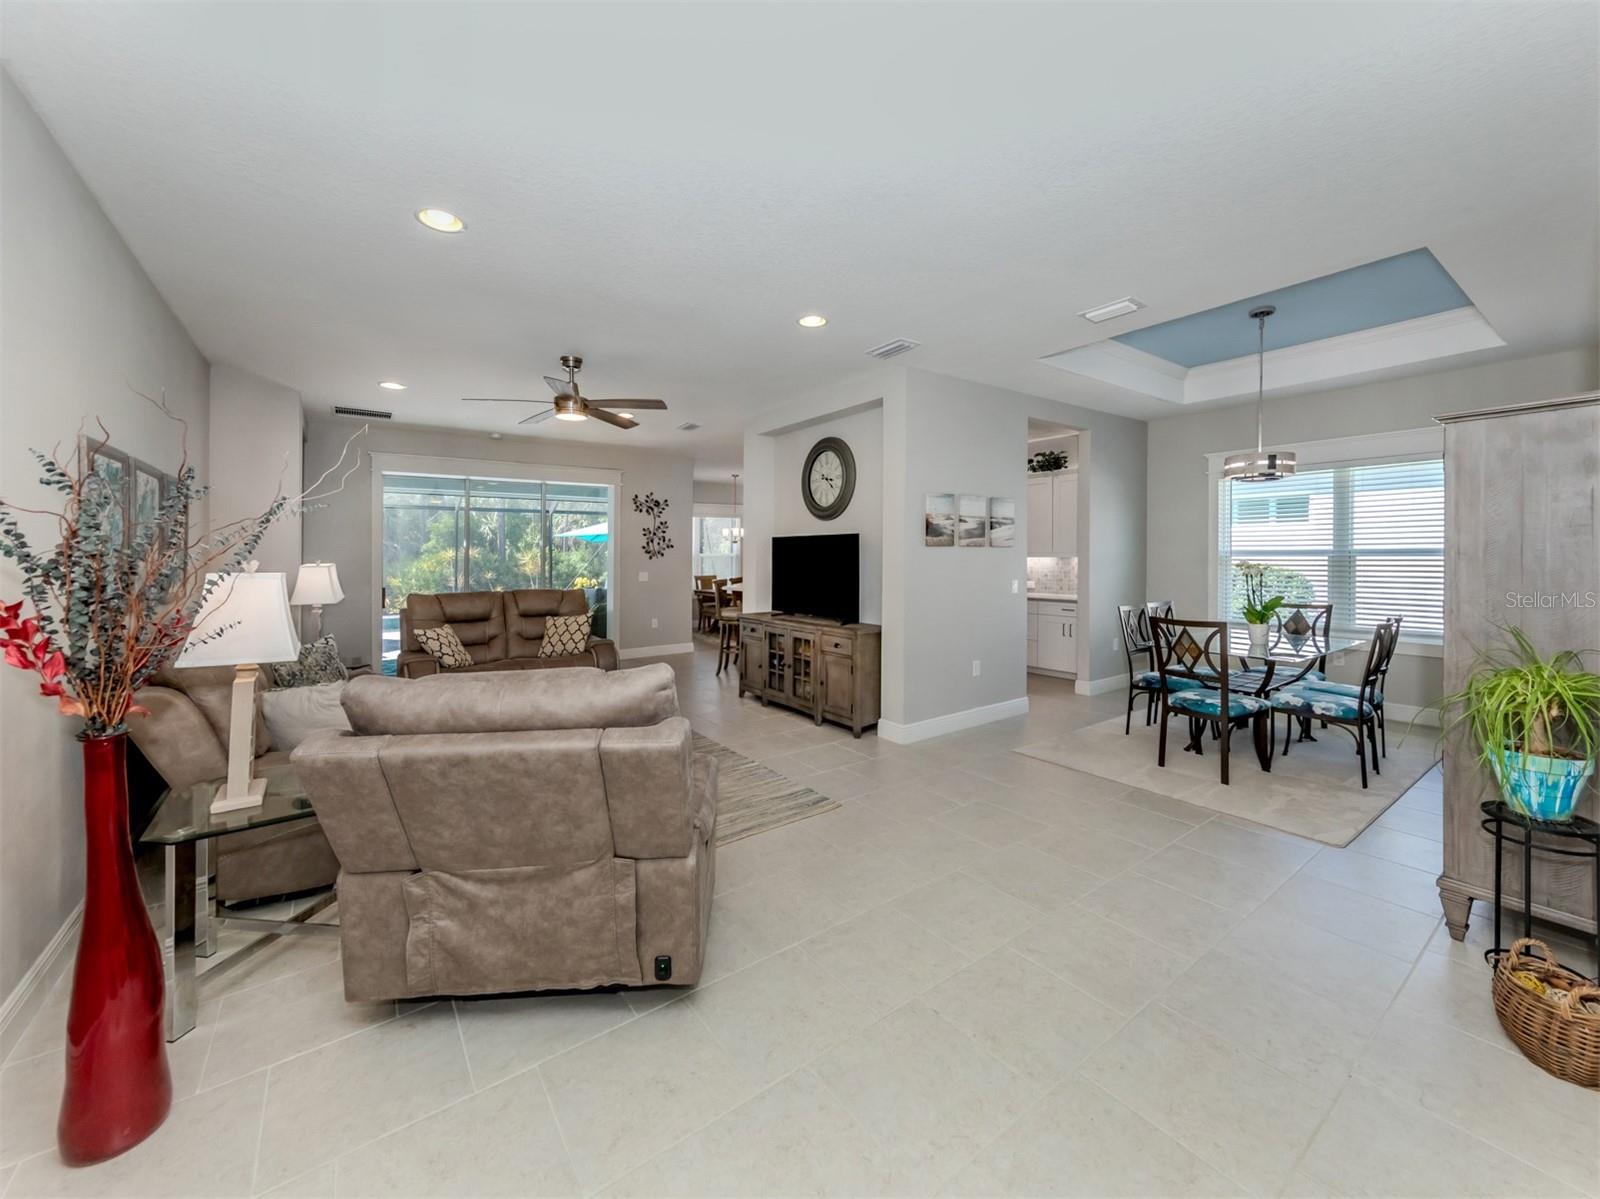
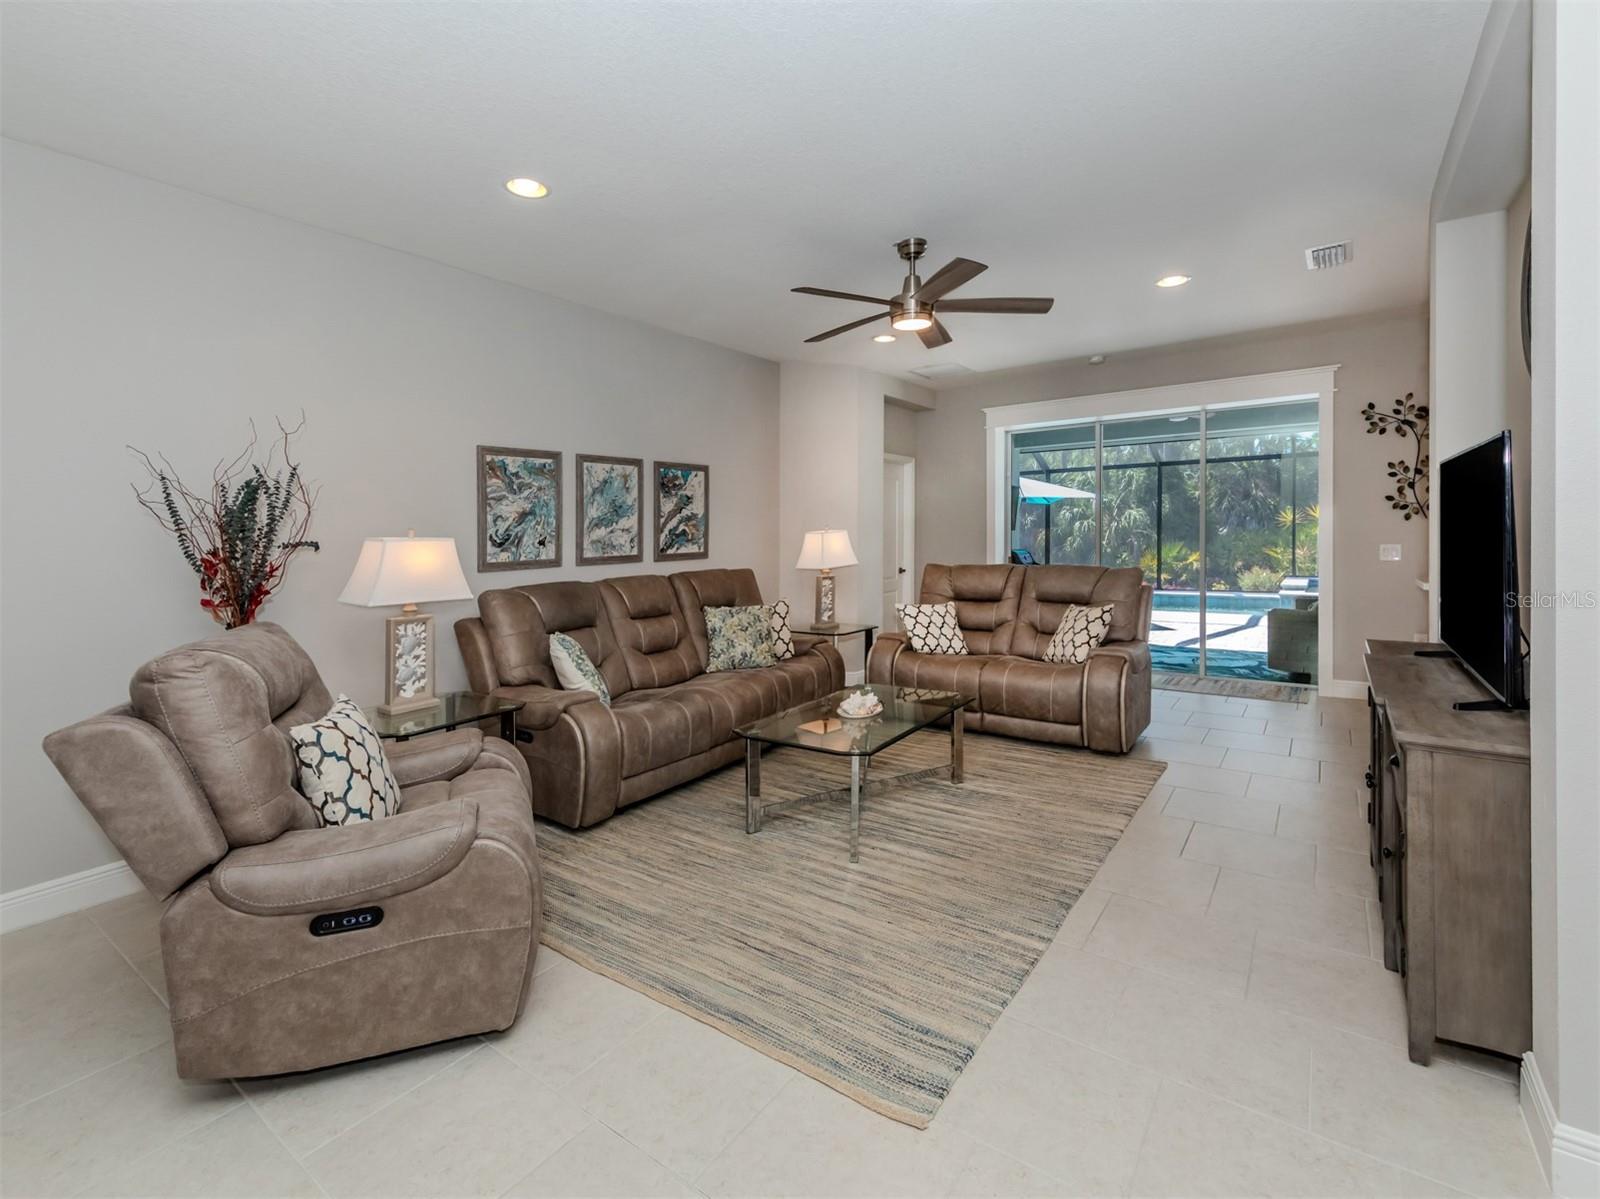
Property Description
Poised in the cherished award-winning community of Grand Palm, this elegant residence exemplifies luxury, privacy and sophistication. Offering an impeccably maintained extraordinary living experience with spacious three bedrooms plus an office/den and gorgeous newly built large pool/spa resting on your private conservation preserve lot awaits you. Extensive home updates are apparent throughout including shaker wood trim added to all windows, newer blinds and ceiling fans. A neutral pallet flows throughout this artfully designed home. Dining room with tray ceiling adorned with crown molding and family room accented with a TV alcove flow seamlessly. Neutral 18-inch offset tile pattern and recessed lighting complement the main living space. Chef’s kitchen features quartz countertops with tile backsplash, stainless steel gas range, wood cabinets with under mount LED lighting, breakfast bar with pendant lights, Bosch dishwasher, pantry, butcher block prep space, separate beverage cooler and a dinette with light wood cabinets featuring indirect overhead LED lighting. Second and third bedrooms have an entry sliding barn door adding treasured privacy to the guest rooms and bath. The office/den highlights a glass panel French double door with wood floor. The lanai embodies Florida outdoor living with your private and lush backyard preserve featuring a saltwater 26’x12’ pool and 7’x7’ spa with pebble finish, paver deck, Stormsmart motorized lanai screen with remote, covered sitting area with outdoor TV and newer ceiling fan. Sit back and enjoy your private and quiet oasis in paradise. Numerous landscaping updates and enhancements make this home a complete package. Low HOA fees. Flood zone was revalidated on March 28, 2024 and confirmed to be X, outside of the flood zone; detailed documentation is available in MLS Attachments. Two overhead garage storage racks are also added to keep the garage neat and organized. Grand Palm is one of the most desirable communities in the Venice area. With approximately 1,000 acres and an estimated 33% open space, Grand Palm is packed full of walking paths, bicycle trails, two dog parks, lakes, ponds, wildlife, and resort-style amenities. Two clubhouses, three pools with shaded cabanas, a water slide, splash pad play park, playground, fitness center, basketball, pickleball, bocce, volleyball, tennis courts and sporting lake with a kayak or canoe launch and an on-site activities director. Conveniently close to shopping, restaurants, golf courses, Interstate 75, airports, theater, cultural events, the world-renowned city on the Island of Venice and Venice City treasured beaches with 14 miles of open coastline. Wellen Park is less than 4 miles away with special programs and activities year-long including the Atlanta Braves Stadium offering dining, movies, concerts and sports. Explore all that living in Venice has to offer in this move-in-ready best-of-the-best resort style active living communities in paradise. Look no further, you have arrived!
Build Your Team
Quickly find investor-friendly professionals who can help you succeed in real estate investing at any stage of the investing journey.


Agents
Match with investor-friendly agents who can help you find, analyze, and close your next deal


Lenders
Get the best funding…find investor-friendly lenders who specialize in your deal strategy


Property Managers
Transition to passive investing. Find a trusted property management partnership that lasts.


Tax Pros & Accountants
Taxes and financial reporting made easy—find experts to create tax savings strategies, file taxes, and more
Location
Property Details
Parking
- Description: Garage
- Details: Attached
- Garage Spaces: 2
- Spaces Total: 0
Bedroom Information
- # of Bedrooms: 3
Bathroom Information
- # of Baths (Full): 2
- # of Baths (Total): 2.0
Interior Features
- # of Rooms: 9
- # of Stories: 1
Exterior Features
- Exterior Walls Materials: Stucco
- Foundation: Slab
- Roof Type: Hip
- Roof Material: Tile
HOA
- Has HOA: Yes
- Association: Castle Group / Toni Michel
- HOA Fee: $66/quarterly
- Additional Association: Castle Group
- Additional HOA Fee: $594/quarterly
Land Information
- Land Use: Residential
- Land Use Subtype: Single Family Residential
Lot Information
- Parcel ID: 0758060031
- Lot Size: 7451 sqft
Property Information
- Property Type: Single Family Residence
- Year Built: 2017
Tax Information
- Annual Tax: $7,759
Utilities
- Water & Sewer: Public
- Heating: Central
- Cooling: Central Air
Location
- County: Sarasota
Listing Details
Investment Summary
- Monthly Cash Flow
- -$1,416
- Cap Rate
- 3.7%
- Cash-on-Cash Return
- -10.6%
- Debt Coverage Ratio
- 0.61
- Internal Rate of Return (5 years)
- -6.2%
Cash Flow
Net Operating Income (NOI) minus mortgage payments.
Calculation:
NOI - Mortgage Payments
Cap Rate (Market Value)
Capitalization Rate is a rate of return that compares the yearly Net Operating Income (NOI) to the market value.
Calculation:
NOI / Market Value
Cash-on-Cash Return (CoC)
Annual Cash Flow / Cash Invested
Calculation:
Annual cash flow divided by initial cash invested.
Debt Coverage Ratio (DCR)
Net Operating Income (NOI) divided by total debt payments.
Calculation:
NOI / Total Debt Payments
Internal Rate of Return (IRR)
A metric for assessing profitability over time. IRR is the discount rate at which the net present value (NPV) of all future cash flows (positive and negative) from an investment equals zero — including both periodic cash flow (such as rent) and a projected sale at the end of the holding period. It represents the expected annualized return, accounting for income, expenses, and the recovery of capital through a future sale.
Purchase Details
Purchase PriceThe price paid for the property. Purchase price:
| $699,900 |
|---|---|
Amount FinancedThe amount of the purchase financed through a loan. Amount financed:
| -$559,920 |
Down paymentThe initial payment made towards the purchase. Down payment:
| $139,980 |
Closing CostsFees and expenses associated with purchasing a property, typically ranging from 2% to 5% of the home’s purchase price, paid at the end of a home purchase to cover services like lending, title transfer, and taxes. Closing costs:
| $20,997 |
Rehab CostsCosts incurred to repair or improve the property, including: roof, flooring, exterior siding, kitchen, exterior paint, bathrooms, etc. Rehab costs:
| $0 |
Initial Cash InvestedThe total initial cash invested in the property. Calculation:Down payment + Buying costs + Rehab costs Initial cash invested:
| $160,977 |
Square Feet (SQFT)The total square footage of the property. Square feet:
| 2,152 |
Cost Per Square FootCost per square foot of the property. Calculation:Purchase Price / Square Feet Cost per square foot:
| $325 |
Monthly Rent Per Square FootMonthly rent divided by the number of square feet. This ratio helps investors compare rental income efficiency across properties, markets, and unit sizes Calculation:Monthly Rent / Square Feet Monthly rent per square foot:
| $2.04 |
Financing Details
Loan AmountThe total sum of money borrowed from a lender to finance a property purchase. Calculation:Purchase Price - Down Payment
Loan amount:
| $559,920 |
|---|---|
Loan to Value Ratio (LTV)Loan amount divided by the market value of the property. Calculation:Loan Amount / Market Value
Loan to value ratio:
| 80.0% |
Loan TypeThe type of loan (e.g., fixed, adjustable).
Loan type:
| Amortizing |
TermThe loan repayment period in years.
Term:
| 30 years |
Interest RateThe percentage a lender charges on the borrowed amount of a loan, determining the cost of borrowing money.
Interest rate:
| 6.625% |
Principal & Interest (PI)The principal is the portion of the loan payment that reduces the loan balance. The interest is the lender's charge for borrowing money. Calculation:(P * r * (1 + r) ** n) / ((1 + r) ** n - 1) Where:
P = Loan amount (principal)
Principal & interest:
| $3,585 |
Property TaxesAnnual taxes levied by local governments on real estate properties. These taxes fund public services like schools, roads, and emergency services.
Property tax:
| $647 |
InsuranceThe costs for insurance coverage to protect against financial losses due to risks like fire, natural disasters, theft, liability, or tenant-related damages. Calculation:Assumes 7% of gross rental income, unless insurance rates are specified.
Insurance:
| $308 |
Private Mortgage Insurance (PMI)A fee that borrowers pay when they take out a conventional loan with a loan-to-value (LTV) ratio above 80%.
Private mortgage insurance (PMI):
| $0 |
Monthly PaymentThe fixed amount a borrower pays each month to repay a loan. It typically includes principal and interest (P&I) and may also cover property taxes, insurance, HOA fees, and PMI if escrowed. Monthly payment:
| $4,540 |
Operating Income
| % Rent | Monthly | Yearly | |
|---|---|---|---|
Gross RentThe total rental income received from tenants before deducting any expenses. Includes base rent, late fees, pet fees, parking fees, and other recurring charges.
Gross rent:
| $4,400 | $52,800 | |
Vacancy LossExpected loss of rent due to vacancies.
Vacancy loss:
(6%)
| 6% | -$264 | -$3,168 |
Operating IncomeGross rental income minus vacancy loss. Calculation:Gross rent - Vacancy loss
Operating income:
| $4,136 | $49,632 |
Operating Expenses
| % Rent | Monthly | Yearly | |
|---|---|---|---|
Property TaxesAnnual taxes levied by local governments on real estate properties. These taxes fund public services like schools, roads, and emergency services. | 15% | -$647 | -$7,759 |
InsuranceThe costs for insurance coverage to protect against financial losses due to risks like fire, natural disasters, theft, liability, or tenant-related damages. Calculation:Assumes 7% of gross rental income, unless insurance rates are specified. | 7% | -$308 | -$3,696 |
Property ManagementThe costs associated with hiring a property manager to handle the day-to-day operations of a rental property. Includes management fees, leasing fes, eviction fees, etc. Calculation:Assumes 8% of gross rental income. | 8% | -$352 | -$4,224 |
Repairs & MaintenanceOngoing costs for routine upkeep and minor fixes needed to keep a property in good working condition. Calculation:Assumes 5% of gross rental income. Varies by property age and condition. | 5% | -$220 | -$2,640 |
Capital ExpensesLarge, infrequent costs for major improvements or replacements, like a new roof, HVAC system, or appliances. Calculation:Assumes 5% of gross rental income. Varies by property age. | 5% | -$220 | -$2,640 |
HOA FeesRegular dues paid to a Homeowners Association for community maintenance, amenities, and management. Similar fees include: Condo Association Fees, Co-op Maintenance Fees, etc. | 5% | -$220 | -$2,640 |
Operating ExpensesRecurring costs required to maintain and manage a rental property, including property taxes, insurance, maintenance, repairs, utilities (if paid by the owner), property management fees, and other day-to-day expenses. Calculation:Insurance + Property Taxes + Property Management + Repairs & Maintenance + Capital Expenditures + HOA Fees | 45% | -$1,967 | -$23,599 |
Cash Flow
| Monthly | Yearly | |
|---|---|---|
Net Operating Income (NOI)The income generated from a property after deducting all operating expenses but before deducting mortgage payments, taxes, and capital expenditures. Calculation:Gross Operating Income - Operating Expenses
Net operating income:
| $2,169 | $26,028 |
Mortgage PaymentThe fixed amount a borrower pays each month to repay a loan. It typically includes principal and interest (P&I) and may also cover property taxes, insurance, HOA fees, and PMI if escrowed. | -$3,585 | -$43,020 |
Cash FlowNet Operating Income (NOI) minus mortgage payments. Calculation:NOI - Mortgage Payments | $1,416 | $16,992 |