
$574,000
Investment Summary
- Monthly Cash Flow
- -$955
- Cap Rate
- 4.1%
- Cash-on-Cash Return
- -8.7%
- Debt Coverage Ratio
- 0.68
- Internal Rate of Return (5 years)
- -4.4%
Cash Flow
Net Operating Income (NOI) minus mortgage payments.
Calculation:
NOI - Mortgage Payments
Cap Rate (Market Value)
Capitalization Rate is a rate of return that compares the yearly Net Operating Income (NOI) to the market value.
Calculation:
NOI / Market Value
Cash-on-Cash Return (CoC)
Annual Cash Flow / Cash Invested
Calculation:
Annual cash flow divided by initial cash invested.
Debt Coverage Ratio (DCR)
Net Operating Income (NOI) divided by total debt payments.
Calculation:
NOI / Total Debt Payments
Internal Rate of Return (IRR)
A metric for assessing profitability over time. IRR is the discount rate at which the net present value (NPV) of all future cash flows (positive and negative) from an investment equals zero — including both periodic cash flow (such as rent) and a projected sale at the end of the holding period. It represents the expected annualized return, accounting for income, expenses, and the recovery of capital through a future sale.
Property Description
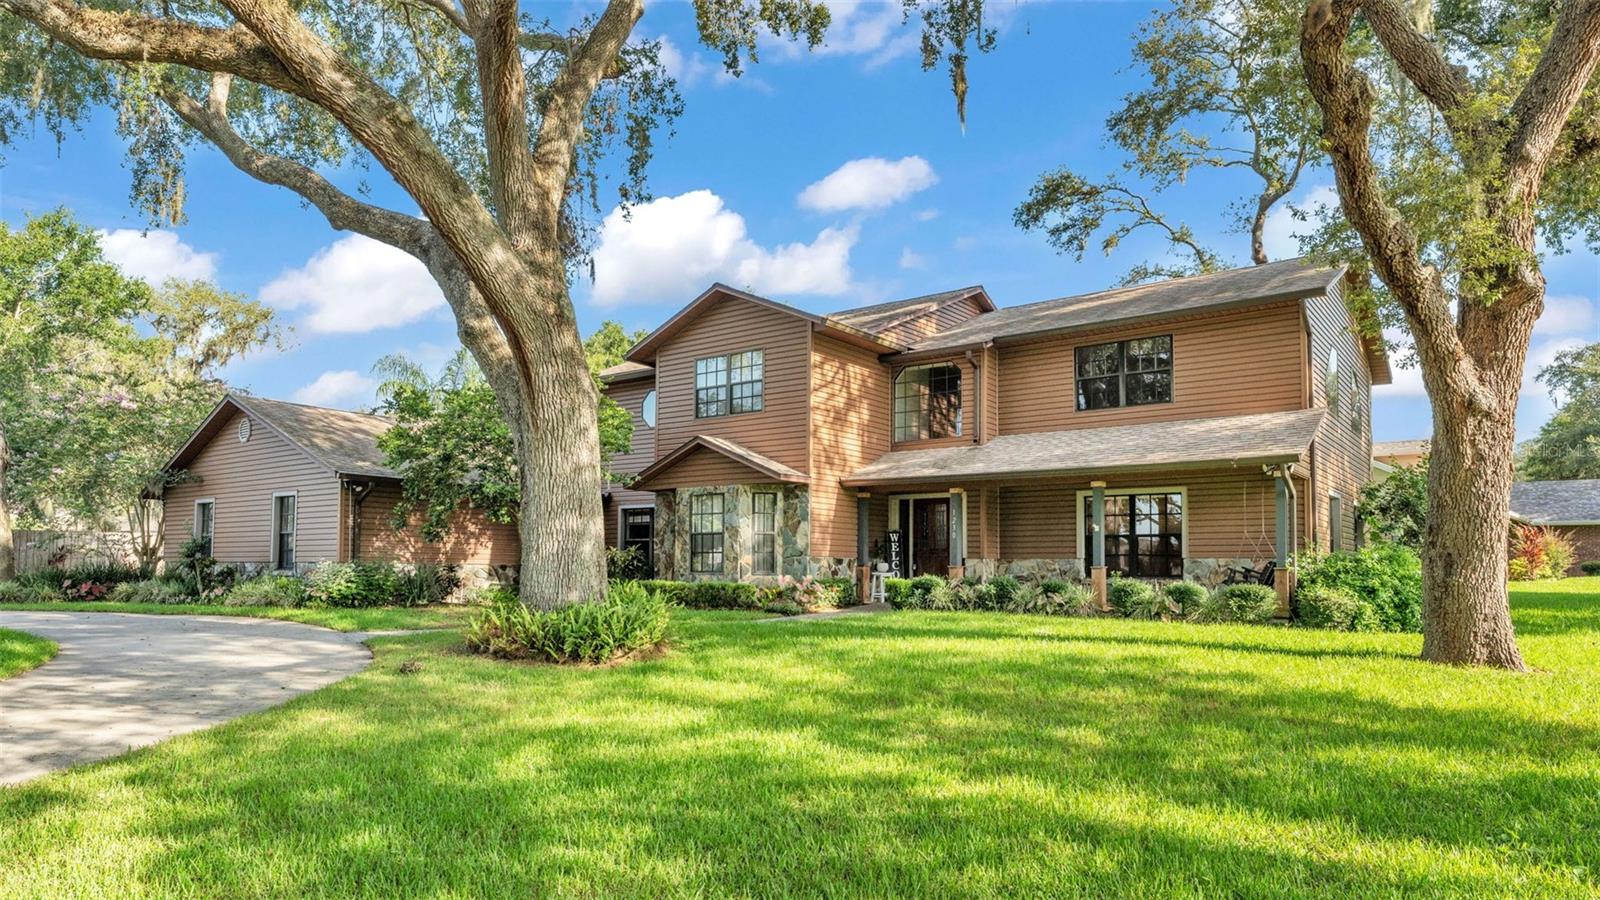
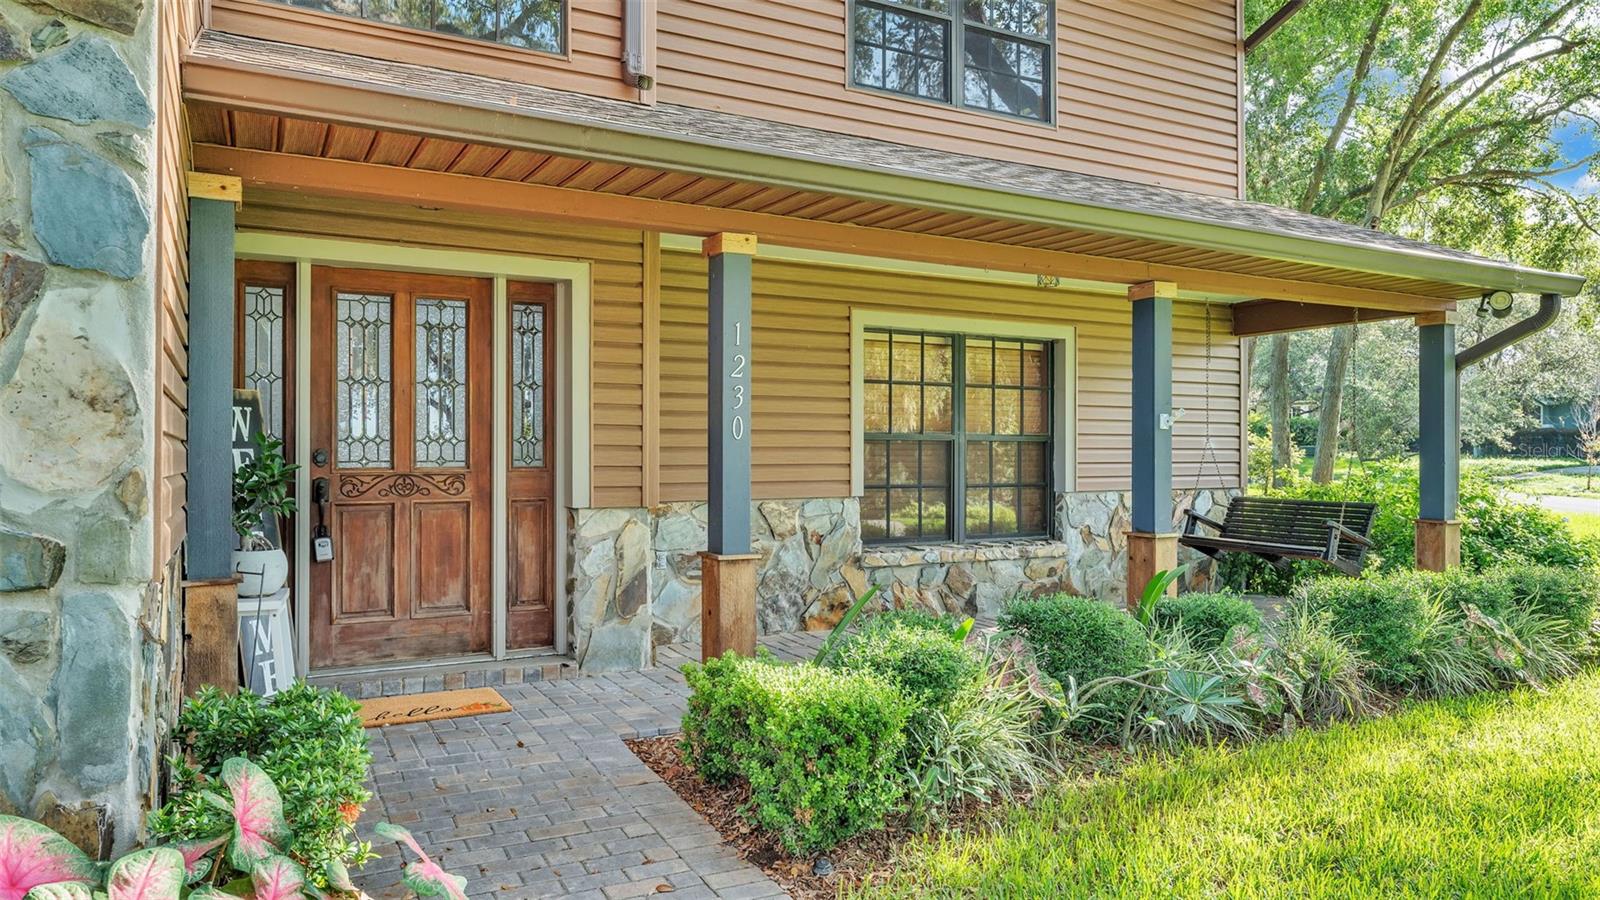
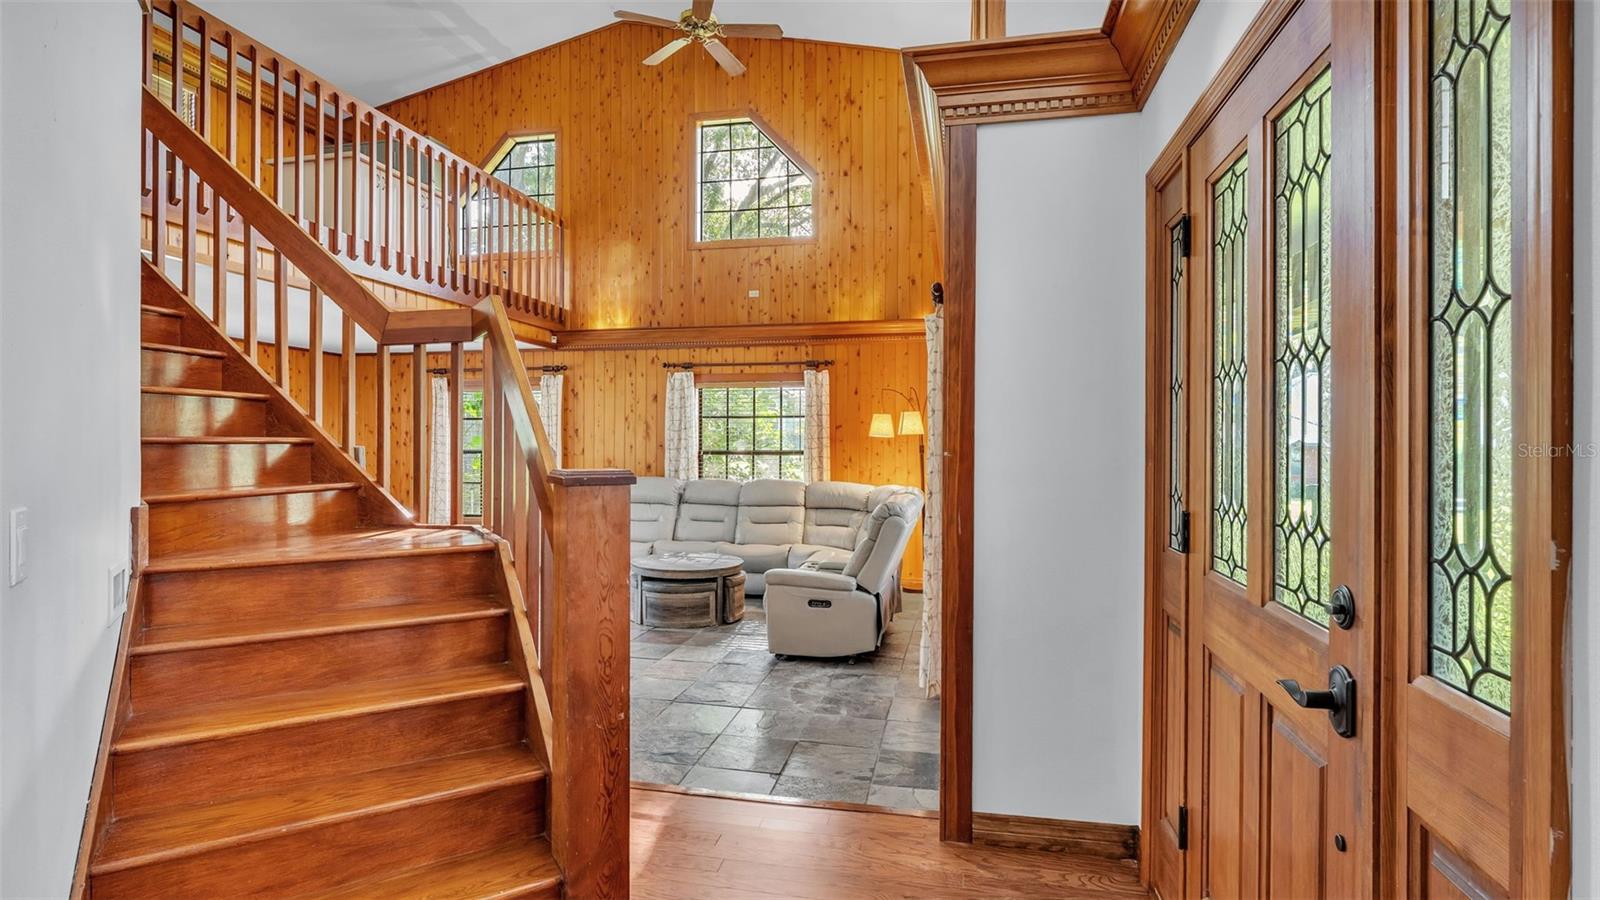
Welcome Home! This custom-designed two-story home has been lovingly maintained and is nestled on an oversized, shaded corner lot in the highly desirable Country Oaks neighborhood of Lakeland. Ideally located just minutes from golf courses, shopping, top-rated schools, churches, medical facilities, and with convenient access to I-4 for an easy commute to Tampa or Orlando. From the moment you arrive, the inviting circle driveway and thoughtfully landscaped yard—accented by uplighting at night—set the tone for what’s inside. Step through the front door into a warm and welcoming space featuring soaring 16-foot ceilings, natural wood walls, and slate tile flooring in the great room. Rich engineered hardwood floors flow throughout the rest of the home. On the first floor, you’ll find the primary bedroom suite with a custom-designed walk-in closet and a spacious ensuite bathroom. A second bedroom—currently used as a home office—is also located on the main level, along with a half bath that offers direct access to the pool area. The laundry room includes built-in cabinetry and a utility sink for added convenience. The spacious kitchen is beautifully appointed with granite countertops, cabinet pull-outs, and a breakfast nook that overlooks the screened pool and paver patio. A formal dining room with a charming bay window completes the first floor. The wood staircase at the entrance leads to the second floor, where you'll find two separate loft areas offering flexible living space—ideal for entertaining, studying, or creating a private office or library. Two generously sized bedrooms, each with their own bathroom and custom walk-in closet, are also located upstairs. Outside, the heated pool—resurfaced, retiled, and re-screened in 2022—sits within an enclosed paver patio and deck. Just beyond the screen enclosure is an additional paver patio, perfect for grilling, entertaining, or relaxing around a fire pit. The oversized and deep three-car garage includes a spacious workshop and a utility sink/counter area for easy clean-ups. Hurricane-rated garage doors were installed in 2022. Behind two 10-foot-wide privacy gates, you'll find a 10x30 aluminum-covered parking area—ideal for RV or boat storage. Additional highlights include a roof replacement in 2012, two newer A/C units (installed in 2016 and 2020), and a voluntary annual HOA. With countless custom features throughout, this exceptional home offers a rare combination of quality, comfort, and versatility. Come see it for yourself—this is the one you’ve been waiting for!
Build Your Team
Quickly find investor-friendly professionals who can help you succeed in real estate investing at any stage of the investing journey.


Agents
Match with investor-friendly agents who can help you find, analyze, and close your next deal


Lenders
Get the best funding…find investor-friendly lenders who specialize in your deal strategy


Property Managers
Transition to passive investing. Find a trusted property management partnership that lasts.


Tax Pros & Accountants
Taxes and financial reporting made easy—find experts to create tax savings strategies, file taxes, and more
Location
Property Details
Parking
- Description: Boat, Circular Driveway, Driveway, Garage Door Opener, Garage Faces Side, Ground Level, Workshop in Garage
- Details: Boat, Circular Driveway, Driveway, Garage Door Opener, Garage Faces Side, Workshop in Garage, Attached
- Garage Spaces: 3
- Spaces Total: 0
Bedroom Information
- # of Bedrooms: 4
Bathroom Information
- # of Baths (Full): 3
- # of Baths (Partial): 1
- # of Baths (Total): 4.0
Interior Features
- # of Rooms: 14
- # of Stories: 2
- Fireplace: Yes
Exterior Features
- Exterior Walls Materials: Siding (Alum/Vinyl)
- Foundation: Slab
- Roof Type: Gable
- Roof Material: Shingle
- Pool: Yes
HOA
- Has HOA: Yes
- Association: Shannon Popa
- HOA Fee: $75/annually
Land Information
- Land Use: Residential
- Land Use Subtype: Single Family Residential
Lot Information
- Parcel ID: 242717161100001240
- Lot Size: 16901 sqft
Property Information
- Property Type: Single Family Residence
- Style: Other
- Year Built: 1994
Tax Information
- Annual Tax: $5,920
Utilities
- Water & Sewer: None
- Heating: Central, Electric, Heat Pump
- Cooling: Central Air
Location
- County: Polk
Listing Details
Investment Summary
- Monthly Cash Flow
- -$955
- Cap Rate
- 4.1%
- Cash-on-Cash Return
- -8.7%
- Debt Coverage Ratio
- 0.68
- Internal Rate of Return (5 years)
- -4.4%
Cash Flow
Net Operating Income (NOI) minus mortgage payments.
Calculation:
NOI - Mortgage Payments
Cap Rate (Market Value)
Capitalization Rate is a rate of return that compares the yearly Net Operating Income (NOI) to the market value.
Calculation:
NOI / Market Value
Cash-on-Cash Return (CoC)
Annual Cash Flow / Cash Invested
Calculation:
Annual cash flow divided by initial cash invested.
Debt Coverage Ratio (DCR)
Net Operating Income (NOI) divided by total debt payments.
Calculation:
NOI / Total Debt Payments
Internal Rate of Return (IRR)
A metric for assessing profitability over time. IRR is the discount rate at which the net present value (NPV) of all future cash flows (positive and negative) from an investment equals zero — including both periodic cash flow (such as rent) and a projected sale at the end of the holding period. It represents the expected annualized return, accounting for income, expenses, and the recovery of capital through a future sale.
Purchase Details
Purchase PriceThe price paid for the property. Purchase price:
| $574,000 |
|---|---|
Amount FinancedThe amount of the purchase financed through a loan. Amount financed:
| -$459,200 |
Down paymentThe initial payment made towards the purchase. Down payment:
| $114,800 |
Closing CostsFees and expenses associated with purchasing a property, typically ranging from 2% to 5% of the home’s purchase price, paid at the end of a home purchase to cover services like lending, title transfer, and taxes. Closing costs:
| $17,220 |
Rehab CostsCosts incurred to repair or improve the property, including: roof, flooring, exterior siding, kitchen, exterior paint, bathrooms, etc. Rehab costs:
| $0 |
Initial Cash InvestedThe total initial cash invested in the property. Calculation:Down payment + Buying costs + Rehab costs Initial cash invested:
| $132,020 |
Square Feet (SQFT)The total square footage of the property. Square feet:
| 3,095 |
Cost Per Square FootCost per square foot of the property. Calculation:Purchase Price / Square Feet Cost per square foot:
| $185 |
Monthly Rent Per Square FootMonthly rent divided by the number of square feet. This ratio helps investors compare rental income efficiency across properties, markets, and unit sizes Calculation:Monthly Rent / Square Feet Monthly rent per square foot:
| $1.16 |
Financing Details
Loan AmountThe total sum of money borrowed from a lender to finance a property purchase. Calculation:Purchase Price - Down Payment
Loan amount:
| $459,200 |
|---|---|
Loan to Value Ratio (LTV)Loan amount divided by the market value of the property. Calculation:Loan Amount / Market Value
Loan to value ratio:
| 80.0% |
Loan TypeThe type of loan (e.g., fixed, adjustable).
Loan type:
| Amortizing |
TermThe loan repayment period in years.
Term:
| 30 years |
Interest RateThe percentage a lender charges on the borrowed amount of a loan, determining the cost of borrowing money.
Interest rate:
| 6.625% |
Principal & Interest (PI)The principal is the portion of the loan payment that reduces the loan balance. The interest is the lender's charge for borrowing money. Calculation:(P * r * (1 + r) ** n) / ((1 + r) ** n - 1) Where:
P = Loan amount (principal)
Principal & interest:
| $2,940 |
Property TaxesAnnual taxes levied by local governments on real estate properties. These taxes fund public services like schools, roads, and emergency services.
Property tax:
| $493 |
InsuranceThe costs for insurance coverage to protect against financial losses due to risks like fire, natural disasters, theft, liability, or tenant-related damages. Calculation:Assumes 7% of gross rental income, unless insurance rates are specified.
Insurance:
| $252 |
Private Mortgage Insurance (PMI)A fee that borrowers pay when they take out a conventional loan with a loan-to-value (LTV) ratio above 80%.
Private mortgage insurance (PMI):
| $0 |
Monthly PaymentThe fixed amount a borrower pays each month to repay a loan. It typically includes principal and interest (P&I) and may also cover property taxes, insurance, HOA fees, and PMI if escrowed. Monthly payment:
| $3,685 |
Operating Income
| % Rent | Monthly | Yearly | |
|---|---|---|---|
Gross RentThe total rental income received from tenants before deducting any expenses. Includes base rent, late fees, pet fees, parking fees, and other recurring charges.
Gross rent:
| $3,600 | $43,200 | |
Vacancy LossExpected loss of rent due to vacancies.
Vacancy loss:
(6%)
| 6% | -$216 | -$2,592 |
Operating IncomeGross rental income minus vacancy loss. Calculation:Gross rent - Vacancy loss
Operating income:
| $3,384 | $40,608 |
Operating Expenses
| % Rent | Monthly | Yearly | |
|---|---|---|---|
Property TaxesAnnual taxes levied by local governments on real estate properties. These taxes fund public services like schools, roads, and emergency services. | 14% | -$493 | -$5,920 |
InsuranceThe costs for insurance coverage to protect against financial losses due to risks like fire, natural disasters, theft, liability, or tenant-related damages. Calculation:Assumes 7% of gross rental income, unless insurance rates are specified. | 7% | -$252 | -$3,024 |
Property ManagementThe costs associated with hiring a property manager to handle the day-to-day operations of a rental property. Includes management fees, leasing fes, eviction fees, etc. Calculation:Assumes 8% of gross rental income. | 8% | -$288 | -$3,456 |
Repairs & MaintenanceOngoing costs for routine upkeep and minor fixes needed to keep a property in good working condition. Calculation:Assumes 5% of gross rental income. Varies by property age and condition. | 5% | -$180 | -$2,160 |
Capital ExpensesLarge, infrequent costs for major improvements or replacements, like a new roof, HVAC system, or appliances. Calculation:Assumes 5% of gross rental income. Varies by property age. | 5% | -$180 | -$2,160 |
HOA FeesRegular dues paid to a Homeowners Association for community maintenance, amenities, and management. Similar fees include: Condo Association Fees, Co-op Maintenance Fees, etc. | 0% | -$6 | -$72 |
Operating ExpensesRecurring costs required to maintain and manage a rental property, including property taxes, insurance, maintenance, repairs, utilities (if paid by the owner), property management fees, and other day-to-day expenses. Calculation:Insurance + Property Taxes + Property Management + Repairs & Maintenance + Capital Expenditures + HOA Fees | 39% | -$1,399 | -$16,792 |
Cash Flow
| Monthly | Yearly | |
|---|---|---|
Net Operating Income (NOI)The income generated from a property after deducting all operating expenses but before deducting mortgage payments, taxes, and capital expenditures. Calculation:Gross Operating Income - Operating Expenses
Net operating income:
| $1,985 | $23,820 |
Mortgage PaymentThe fixed amount a borrower pays each month to repay a loan. It typically includes principal and interest (P&I) and may also cover property taxes, insurance, HOA fees, and PMI if escrowed. | -$2,940 | -$35,280 |
Cash FlowNet Operating Income (NOI) minus mortgage payments. Calculation:NOI - Mortgage Payments | $955 | $11,460 |