$554,900
Investment Summary
- Monthly Cash Flow
- -$2,024
- Cap Rate
- 1.8%
- Cash-on-Cash Return
- -19.0%
- Debt Coverage Ratio
- 0.29
- Internal Rate of Return (5 years)
- -14.4%
Cash Flow
Net Operating Income (NOI) minus mortgage payments.
Calculation:
NOI - Mortgage Payments
Cap Rate (Market Value)
Capitalization Rate is a rate of return that compares the yearly Net Operating Income (NOI) to the market value.
Calculation:
NOI / Market Value
Cash-on-Cash Return (CoC)
Annual Cash Flow / Cash Invested
Calculation:
Annual cash flow divided by initial cash invested.
Debt Coverage Ratio (DCR)
Net Operating Income (NOI) divided by total debt payments.
Calculation:
NOI / Total Debt Payments
Internal Rate of Return (IRR)
A metric for assessing profitability over time. IRR is the discount rate at which the net present value (NPV) of all future cash flows (positive and negative) from an investment equals zero — including both periodic cash flow (such as rent) and a projected sale at the end of the holding period. It represents the expected annualized return, accounting for income, expenses, and the recovery of capital through a future sale.
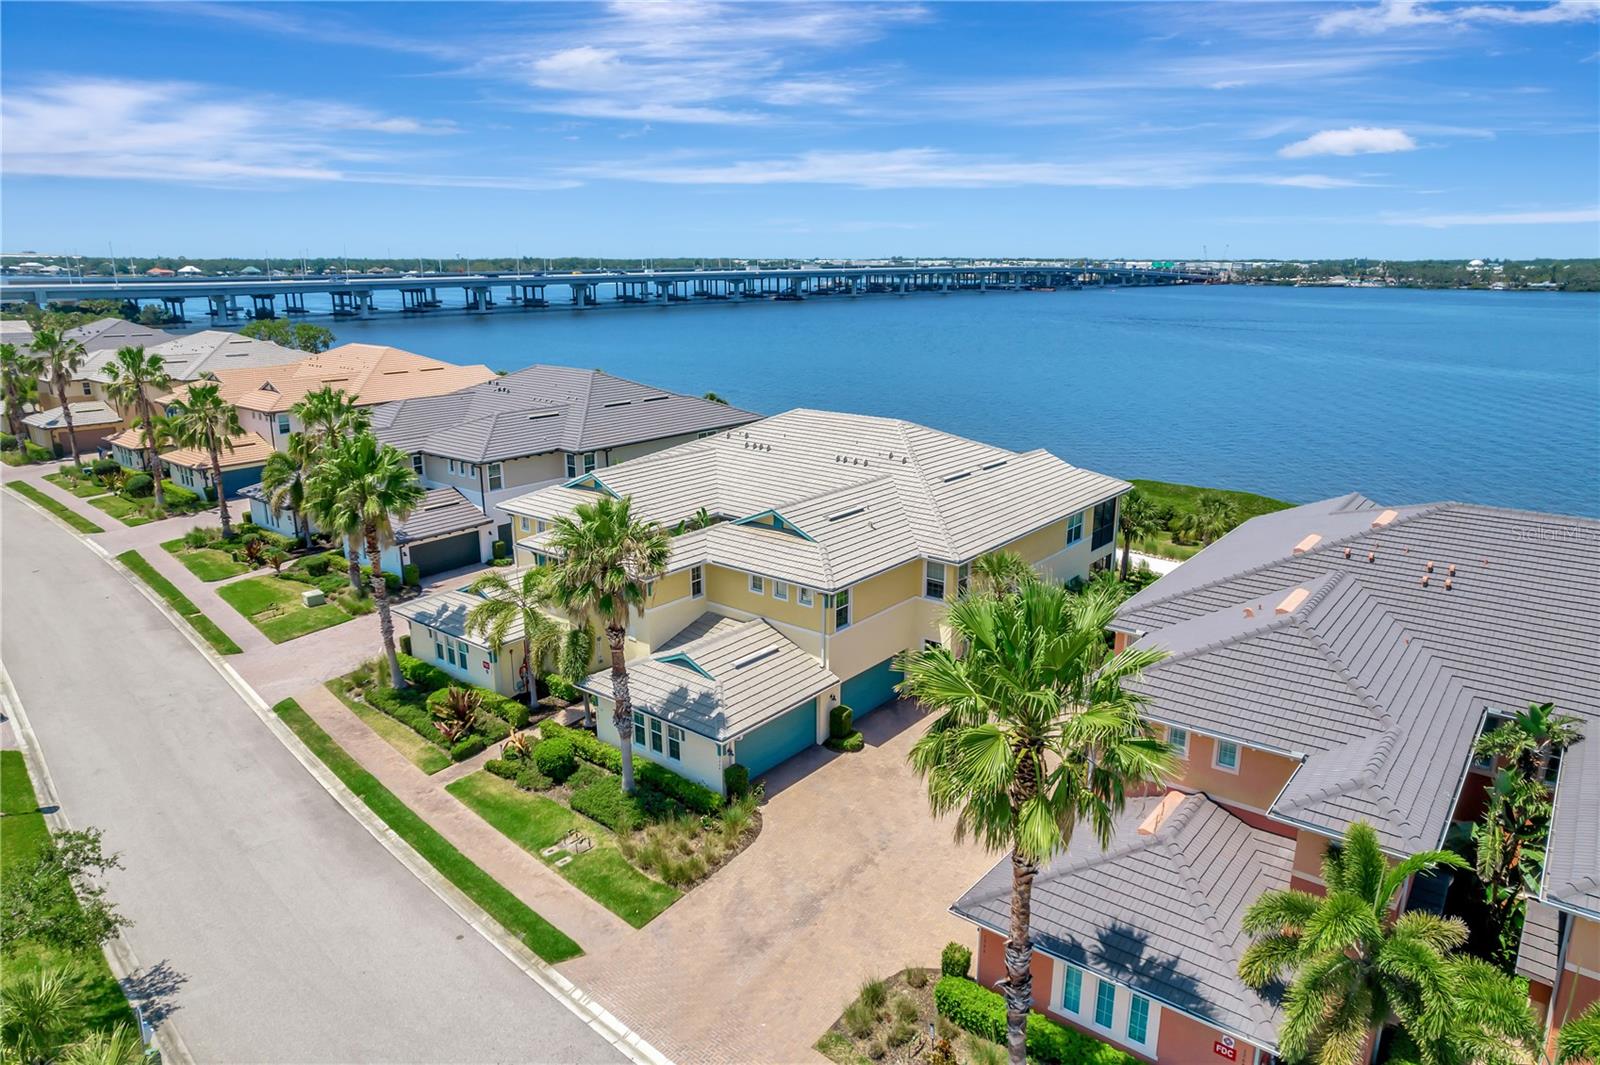
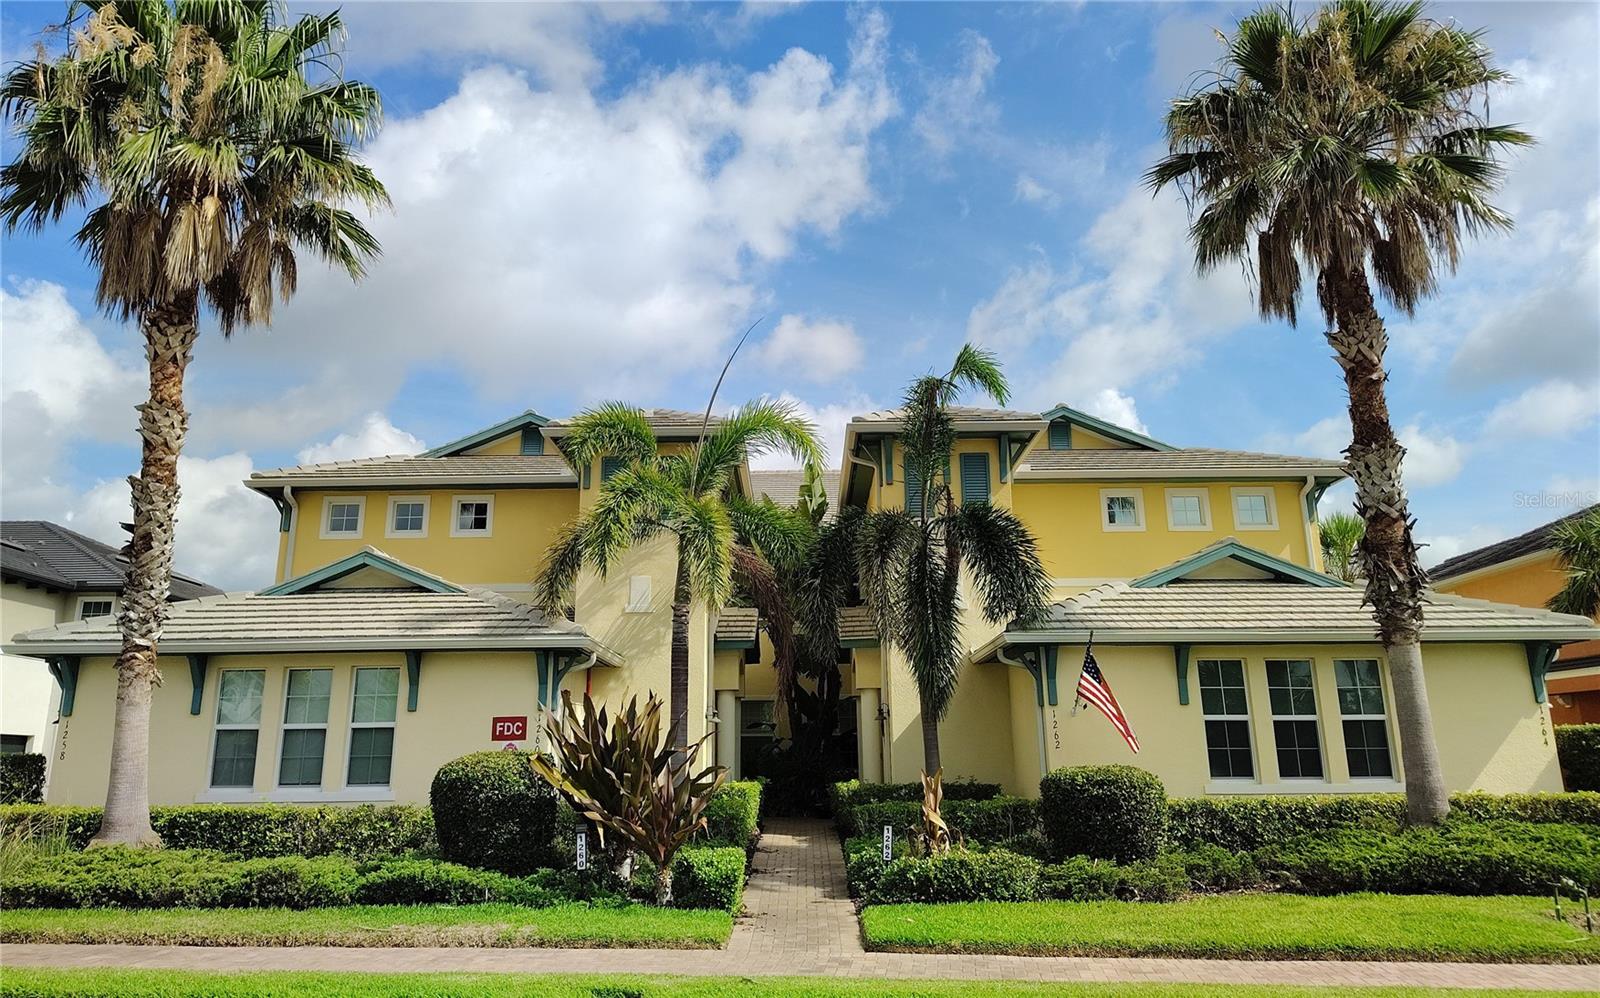
Property Description
Built to Withstand, Designed to Impress This condominium meets all current hurricane building standards and has weathered three major storms in the past nine years without a single instance of water intrusion or wind damage. Outfitted with storm-rated windows and doors—including a wind-braced garage door—you’ll enjoy peace of mind, safety, and security in this well-run, gated community. Now, imagine coming home every day to what feels like a luxury resort. That’s exactly what life in Tidewater Preserve offers. Whether you're raising a family, retiring, or somewhere in between, you’ll have access to a wide range of premium amenities: • Three pools, including a lap pool with beach entry • Har-Tru tennis courts • Two fitness centers • Kayak launch • Riverfront walking trail with an observation point • Playground, dog park, and more Boaters will love the easy access to the on-site marina with first-come, first-served boat slips currently available for rent. The Manatee River offers quick access to Tampa Bay, the Gulf of Mexico, and prime fishing near the Sunshine Skyway. Two clubhouse venues—The Lodge and Port & Court—can be reserved for private events. The community hosts an active calendar of group fitness classes, arts & crafts, book clubs, Mahjong, holiday parties, concerts, food trucks, and car shows. Boating events include flotillas to waterfront restaurants, a holiday boat parade, and a pirate-themed regatta. Inside the home, enjoy water views from every window. A wall of sliding glass doors opens to a screened lanai overlooking the Manatee River—perfect for catching sunrises, sunsets, and fireworks displays from multiple municipalities during the holidays. The front bedroom windows overlook the marina and lagoon. The kitchen is spacious and bright, featuring granite countertops, soft-close wood cabinets, Whirlpool appliances, under- and over-cabinet lighting, and a walk-in pantry. The open-concept layout connects the dining area and great room, with space for a breakfast nook or home office setup, all with lovely water views. The primary suite includes new carpeting, two closets (one walk-in), and an ensuite with dual sinks, stone countertops, a private water closet, and a glass-enclosed shower. Two additional bedrooms, located on the opposite side of the unit, have new luxury vinyl flooring, ceiling fans, and large closets. The hall bathroom includes a tub and stone countertop. The indoor laundry room adds storage and a utility sink. The two-car garage includes a motorized opener and keypad entry. Tidewater Preserve is governed by a proactive HOA with strong reserves and a volunteer network that keeps the community thriving. Few waterfront properties in the Manasota area offer this level of access, protection, and amenities at this price point. Schedule your showing today—your next chapter starts here. (Realtor is owner.)
Build Your Team
Quickly find investor-friendly professionals who can help you succeed in real estate investing at any stage of the investing journey.


Agents
Match with investor-friendly agents who can help you find, analyze, and close your next deal


Lenders
Get the best funding…find investor-friendly lenders who specialize in your deal strategy


Property Managers
Transition to passive investing. Find a trusted property management partnership that lasts.


Tax Pros & Accountants
Taxes and financial reporting made easy—find experts to create tax savings strategies, file taxes, and more
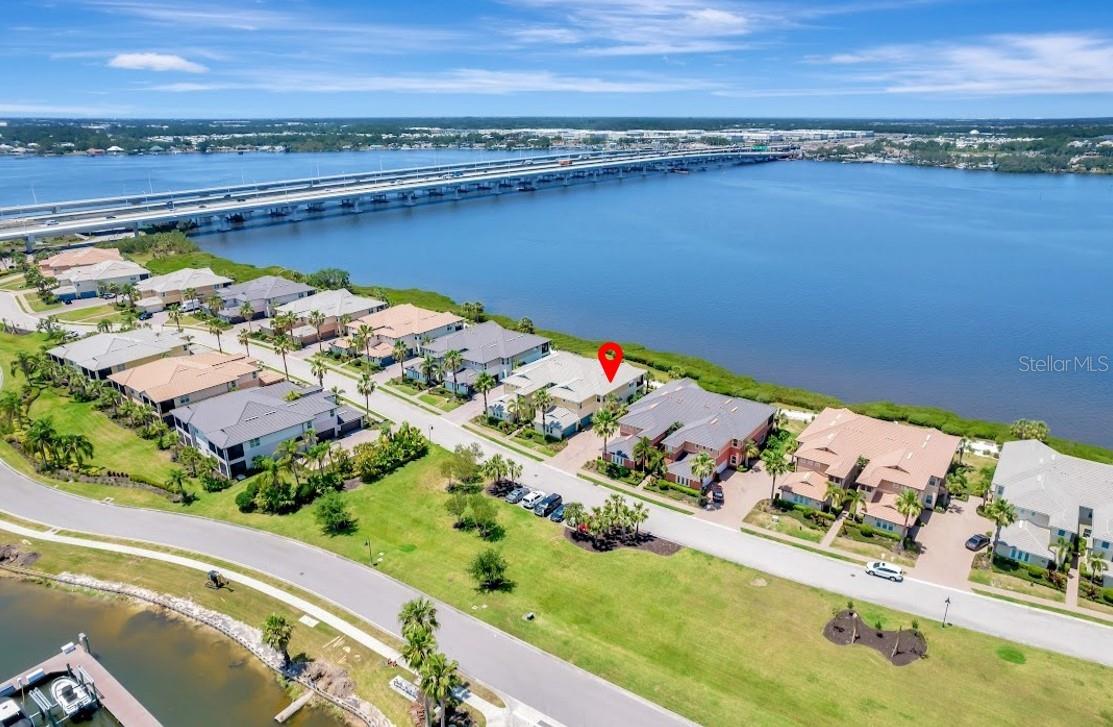
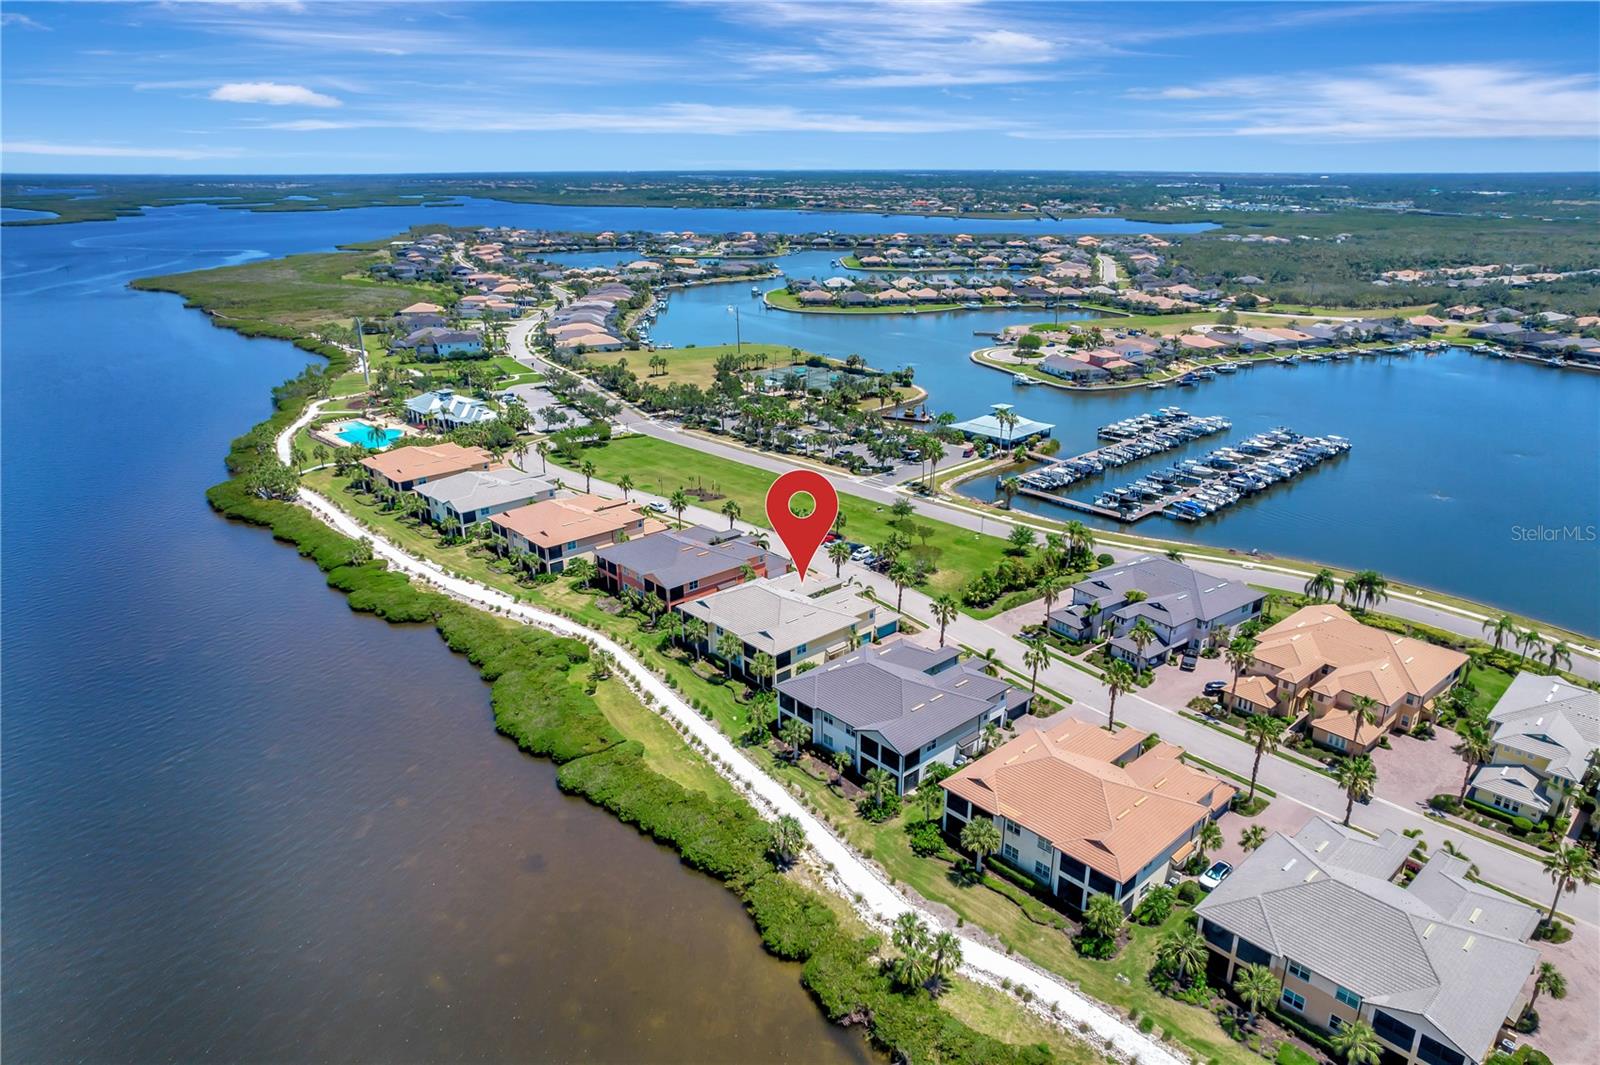
Location
Property Details
Parking
- Description: Garage
- Details: Garage Faces Side, Attached
- Garage Spaces: 2
- Spaces Total: 0
Bedroom Information
- # of Bedrooms: 3
Bathroom Information
- # of Baths (Full): 2
- # of Baths (Total): 2.0
Interior Features
- # of Rooms: 3
- # of Stories: 2
Exterior Features
- Exterior Walls Materials: Stucco
- Foundation: Slab
- Roof Type: Gable or Hip
- Roof Material: Concrete, Tile
HOA
- Has HOA: Yes
- Association: Castle Group/Christing Brookfield
- HOA Fee: $1,537/quarterly
- Additional Association: Tidewater Preserve
- Additional HOA Fee: $1,018/quarterly
Land Information
- Land Use: Residential
- Land Use Subtype: Condominium Unit
Lot Information
- Parcel ID: 11000.16609
- Lot Size: 0 sqft
Property Information
- Property Type: Condominium
- Style: Coastal
- Year Built: 2016
Tax Information
- Annual Tax: $3,146
Utilities
- Water & Sewer: Public
- Heating: Central, Electric, Exhaust Fan
- Cooling: Central Air
Location
- County: Manatee
Listing Details
Investment Summary
- Monthly Cash Flow
- -$2,024
- Cap Rate
- 1.8%
- Cash-on-Cash Return
- -19.0%
- Debt Coverage Ratio
- 0.29
- Internal Rate of Return (5 years)
- -14.4%
Cash Flow
Net Operating Income (NOI) minus mortgage payments.
Calculation:
NOI - Mortgage Payments
Cap Rate (Market Value)
Capitalization Rate is a rate of return that compares the yearly Net Operating Income (NOI) to the market value.
Calculation:
NOI / Market Value
Cash-on-Cash Return (CoC)
Annual Cash Flow / Cash Invested
Calculation:
Annual cash flow divided by initial cash invested.
Debt Coverage Ratio (DCR)
Net Operating Income (NOI) divided by total debt payments.
Calculation:
NOI / Total Debt Payments
Internal Rate of Return (IRR)
A metric for assessing profitability over time. IRR is the discount rate at which the net present value (NPV) of all future cash flows (positive and negative) from an investment equals zero — including both periodic cash flow (such as rent) and a projected sale at the end of the holding period. It represents the expected annualized return, accounting for income, expenses, and the recovery of capital through a future sale.
Purchase Details
Purchase PriceThe price paid for the property. Purchase price:
| $554,900 |
|---|---|
Amount FinancedThe amount of the purchase financed through a loan. Amount financed:
| -$443,920 |
Down paymentThe initial payment made towards the purchase. Down payment:
| $110,980 |
Closing CostsFees and expenses associated with purchasing a property, typically ranging from 2% to 5% of the home’s purchase price, paid at the end of a home purchase to cover services like lending, title transfer, and taxes. Closing costs:
| $16,647 |
Rehab CostsCosts incurred to repair or improve the property, including: roof, flooring, exterior siding, kitchen, exterior paint, bathrooms, etc. Rehab costs:
| $0 |
Initial Cash InvestedThe total initial cash invested in the property. Calculation:Down payment + Buying costs + Rehab costs Initial cash invested:
| $127,627 |
Square Feet (SQFT)The total square footage of the property. Square feet:
| 1,748 |
Cost Per Square FootCost per square foot of the property. Calculation:Purchase Price / Square Feet Cost per square foot:
| $317 |
Monthly Rent Per Square FootMonthly rent divided by the number of square feet. This ratio helps investors compare rental income efficiency across properties, markets, and unit sizes Calculation:Monthly Rent / Square Feet Monthly rent per square foot:
| $1.60 |
Financing Details
Loan AmountThe total sum of money borrowed from a lender to finance a property purchase. Calculation:Purchase Price - Down Payment
Loan amount:
| $443,920 |
|---|---|
Loan to Value Ratio (LTV)Loan amount divided by the market value of the property. Calculation:Loan Amount / Market Value
Loan to value ratio:
| 80.0% |
Loan TypeThe type of loan (e.g., fixed, adjustable).
Loan type:
| Amortizing |
TermThe loan repayment period in years.
Term:
| 30 years |
Interest RateThe percentage a lender charges on the borrowed amount of a loan, determining the cost of borrowing money.
Interest rate:
| 6.625% |
Principal & Interest (PI)The principal is the portion of the loan payment that reduces the loan balance. The interest is the lender's charge for borrowing money. Calculation:(P * r * (1 + r) ** n) / ((1 + r) ** n - 1) Where:
P = Loan amount (principal)
Principal & interest:
| $2,842 |
Property TaxesAnnual taxes levied by local governments on real estate properties. These taxes fund public services like schools, roads, and emergency services.
Property tax:
| $262 |
InsuranceThe costs for insurance coverage to protect against financial losses due to risks like fire, natural disasters, theft, liability, or tenant-related damages. Calculation:Assumes 7% of gross rental income, unless insurance rates are specified.
Insurance:
| $196 |
Private Mortgage Insurance (PMI)A fee that borrowers pay when they take out a conventional loan with a loan-to-value (LTV) ratio above 80%.
Private mortgage insurance (PMI):
| $0 |
Monthly PaymentThe fixed amount a borrower pays each month to repay a loan. It typically includes principal and interest (P&I) and may also cover property taxes, insurance, HOA fees, and PMI if escrowed. Monthly payment:
| $3,300 |
Operating Income
| % Rent | Monthly | Yearly | |
|---|---|---|---|
Gross RentThe total rental income received from tenants before deducting any expenses. Includes base rent, late fees, pet fees, parking fees, and other recurring charges.
Gross rent:
| $2,800 | $33,600 | |
Vacancy LossExpected loss of rent due to vacancies.
Vacancy loss:
(6%)
| 6% | -$168 | -$2,016 |
Operating IncomeGross rental income minus vacancy loss. Calculation:Gross rent - Vacancy loss
Operating income:
| $2,632 | $31,584 |
Operating Expenses
| % Rent | Monthly | Yearly | |
|---|---|---|---|
Property TaxesAnnual taxes levied by local governments on real estate properties. These taxes fund public services like schools, roads, and emergency services. | 9% | -$262 | -$3,146 |
InsuranceThe costs for insurance coverage to protect against financial losses due to risks like fire, natural disasters, theft, liability, or tenant-related damages. Calculation:Assumes 7% of gross rental income, unless insurance rates are specified. | 7% | -$196 | -$2,352 |
Property ManagementThe costs associated with hiring a property manager to handle the day-to-day operations of a rental property. Includes management fees, leasing fes, eviction fees, etc. Calculation:Assumes 8% of gross rental income. | 8% | -$224 | -$2,688 |
Repairs & MaintenanceOngoing costs for routine upkeep and minor fixes needed to keep a property in good working condition. Calculation:Assumes 5% of gross rental income. Varies by property age and condition. | 5% | -$140 | -$1,680 |
Capital ExpensesLarge, infrequent costs for major improvements or replacements, like a new roof, HVAC system, or appliances. Calculation:Assumes 5% of gross rental income. Varies by property age. | 5% | -$140 | -$1,680 |
HOA FeesRegular dues paid to a Homeowners Association for community maintenance, amenities, and management. Similar fees include: Condo Association Fees, Co-op Maintenance Fees, etc. | 30% | -$852 | -$10,224 |
Operating ExpensesRecurring costs required to maintain and manage a rental property, including property taxes, insurance, maintenance, repairs, utilities (if paid by the owner), property management fees, and other day-to-day expenses. Calculation:Insurance + Property Taxes + Property Management + Repairs & Maintenance + Capital Expenditures + HOA Fees | 65% | -$1,814 | -$21,770 |
Cash Flow
| Monthly | Yearly | |
|---|---|---|
Net Operating Income (NOI)The income generated from a property after deducting all operating expenses but before deducting mortgage payments, taxes, and capital expenditures. Calculation:Gross Operating Income - Operating Expenses
Net operating income:
| $818 | $9,816 |
Mortgage PaymentThe fixed amount a borrower pays each month to repay a loan. It typically includes principal and interest (P&I) and may also cover property taxes, insurance, HOA fees, and PMI if escrowed. | -$2,842 | -$34,104 |
Cash FlowNet Operating Income (NOI) minus mortgage payments. Calculation:NOI - Mortgage Payments | -$2,024 | -$24,288 |