
$599,900
Investment Summary
- Monthly Cash Flow
- -$1,189
- Cap Rate
- 3.8%
- Cash-on-Cash Return
- -10.3%
- Debt Coverage Ratio
- 0.61
- Internal Rate of Return (5 years)
- -6.0%
Cash Flow
Net Operating Income (NOI) minus mortgage payments.
Calculation:
NOI - Mortgage Payments
Cap Rate (Market Value)
Capitalization Rate is a rate of return that compares the yearly Net Operating Income (NOI) to the market value.
Calculation:
NOI / Market Value
Cash-on-Cash Return (CoC)
Annual Cash Flow / Cash Invested
Calculation:
Annual cash flow divided by initial cash invested.
Debt Coverage Ratio (DCR)
Net Operating Income (NOI) divided by total debt payments.
Calculation:
NOI / Total Debt Payments
Internal Rate of Return (IRR)
A metric for assessing profitability over time. IRR is the discount rate at which the net present value (NPV) of all future cash flows (positive and negative) from an investment equals zero — including both periodic cash flow (such as rent) and a projected sale at the end of the holding period. It represents the expected annualized return, accounting for income, expenses, and the recovery of capital through a future sale.
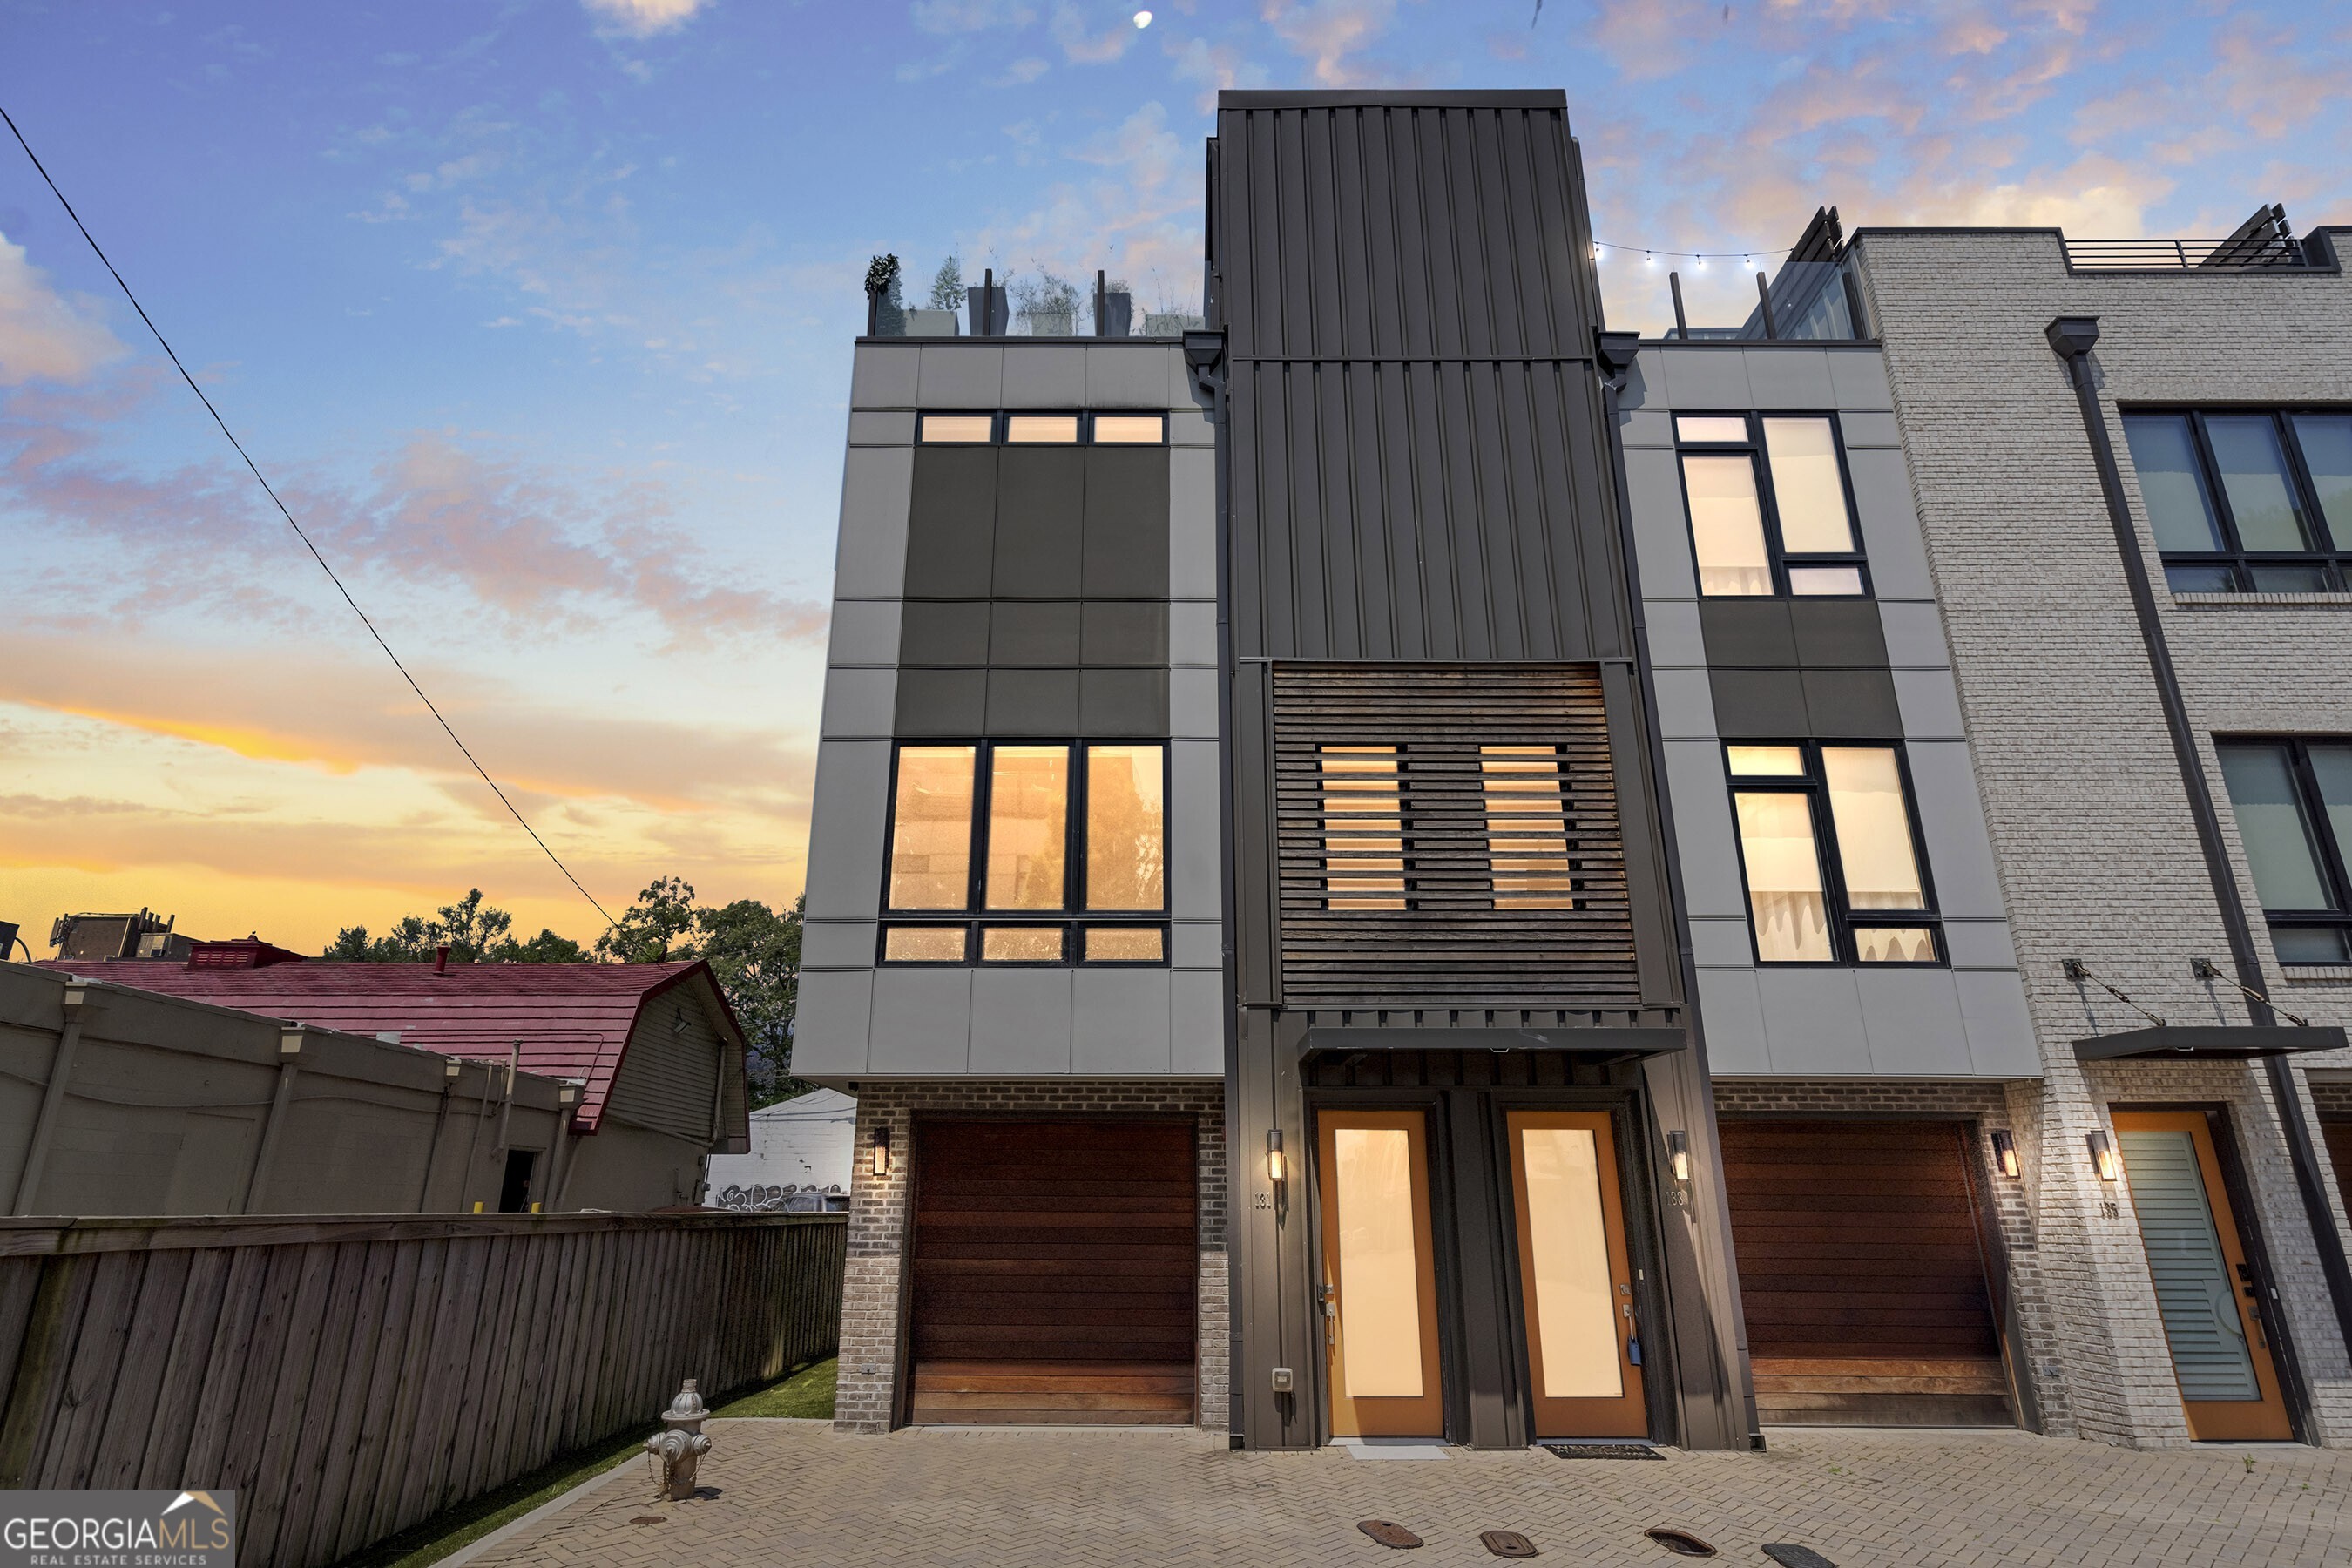
Property Description
This stunning end-unit townhome at Views at Old Fourth Ward offers an ideal blend of luxury, design, and convenience in one of Atlanta's most sought-after locations. As the largest floor plan in the community at 1,915 sq ft, this home stands out with thoughtful upgrades and high-end finishes throughout. Featuring three spacious bedrooms, premium appliances, and elegant design, this property is made for those who appreciate both style and functionality. The gourmet kitchen is equipped 36" Wolf range and high end stainless steel appliances, waterfall quartz countertops, and a custom tile backsplash perfect for culinary enthusiasts. The interior is elevated with resilient modern wood floors, custom closets throughout the home, and epoxy-coated custom garage flooring, adding layers of sophistication and convenience. The owner's suite serves as a private retreat, complete with a spacious bathroom, walk-in closet, and luxurious finishes. Upgrades include a tankless water heater for on-demand hot water and enhanced energy efficiency. The versatile top floor can be used as a bedroom or flexible living space and includes a full bathroom and access to a private rooftop deck. This rooftop oasis features a custom wet bar, hookups for a gas grill, wine cooler and ice maker, offering the ultimate setup for entertaining or unwinding while enjoying sweeping views of the city. Enjoy convenient access to one of the largest fenced backyards in the Views @ O4W, featuring a spacious patio for outdoor entertaining and relaxing in total privacy. A fully fenced backyard that is low-maintenance, located just off the tandem two-car garage, offers the ideal space for your resident pup to play safely and securely. The attached garage is already plumbed for water supply and drainage, making it a strong candidate for conversion into a functional fourth bedroom, potentially with an en-suite bathroom. Ad advantage of being an end unit is extra parking space for guests. The Views @ O4W is ideally located just 0.6 miles from Piedmont Park and only two blocks from Ponce City Market/Beltline, this home is also close to Whole Foods, Kroger, Forum Athletic Club, and beloved local coffee shops offering a perfect blend of luxury, walkability, and convenience. Low HOA fee of $250/month, which has remained unchanged since construction in 2019. The HOA covers exterior structure, roof, windows, landscaping, irrigation, lighting systems, and all improvements on common property. The community consists of 27 units. Currently, several units are available to be leased. This home is truly a city dweller's dream, offering the ultimate urban lifestyle in one of Atlanta's fastest-growing and most vibrant Intown neighborhoods. Furniture is negotiable.
Build Your Team
Quickly find investor-friendly professionals who can help you succeed in real estate investing at any stage of the investing journey.


Agents
Match with investor-friendly agents who can help you find, analyze, and close your next deal


Lenders
Get the best funding…find investor-friendly lenders who specialize in your deal strategy


Property Managers
Transition to passive investing. Find a trusted property management partnership that lasts.


Tax Pros & Accountants
Taxes and financial reporting made easy—find experts to create tax savings strategies, file taxes, and more
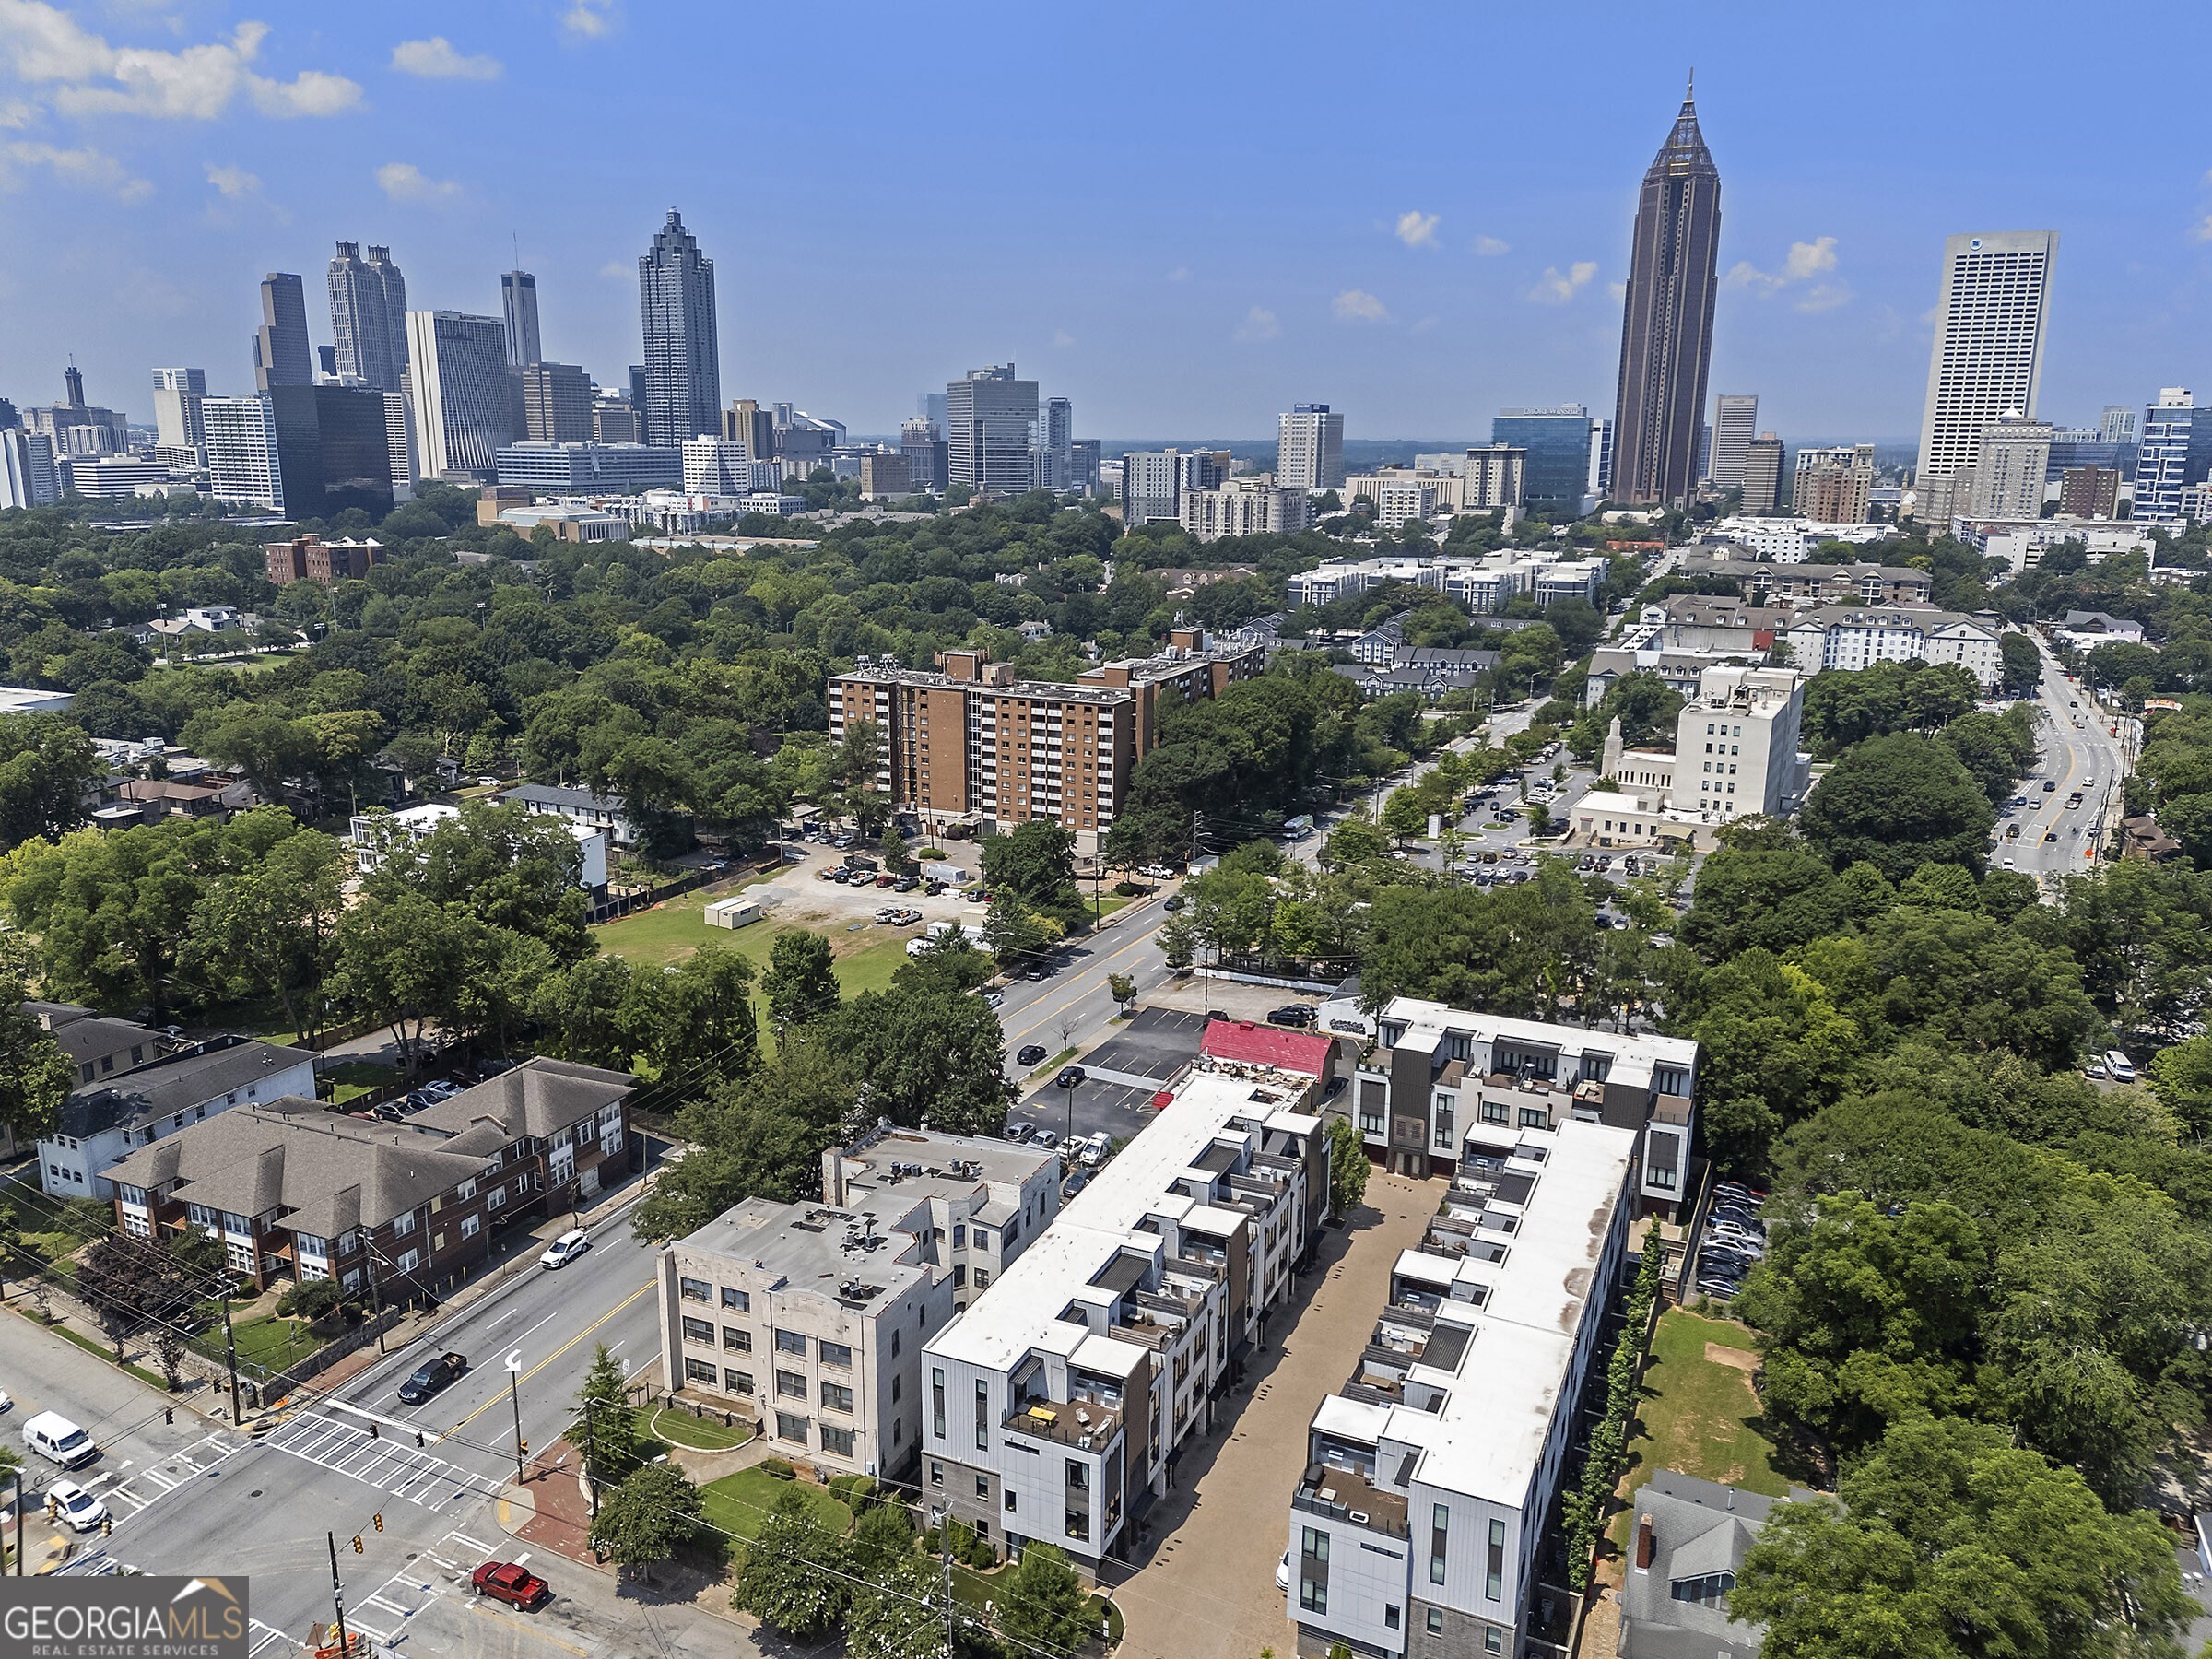
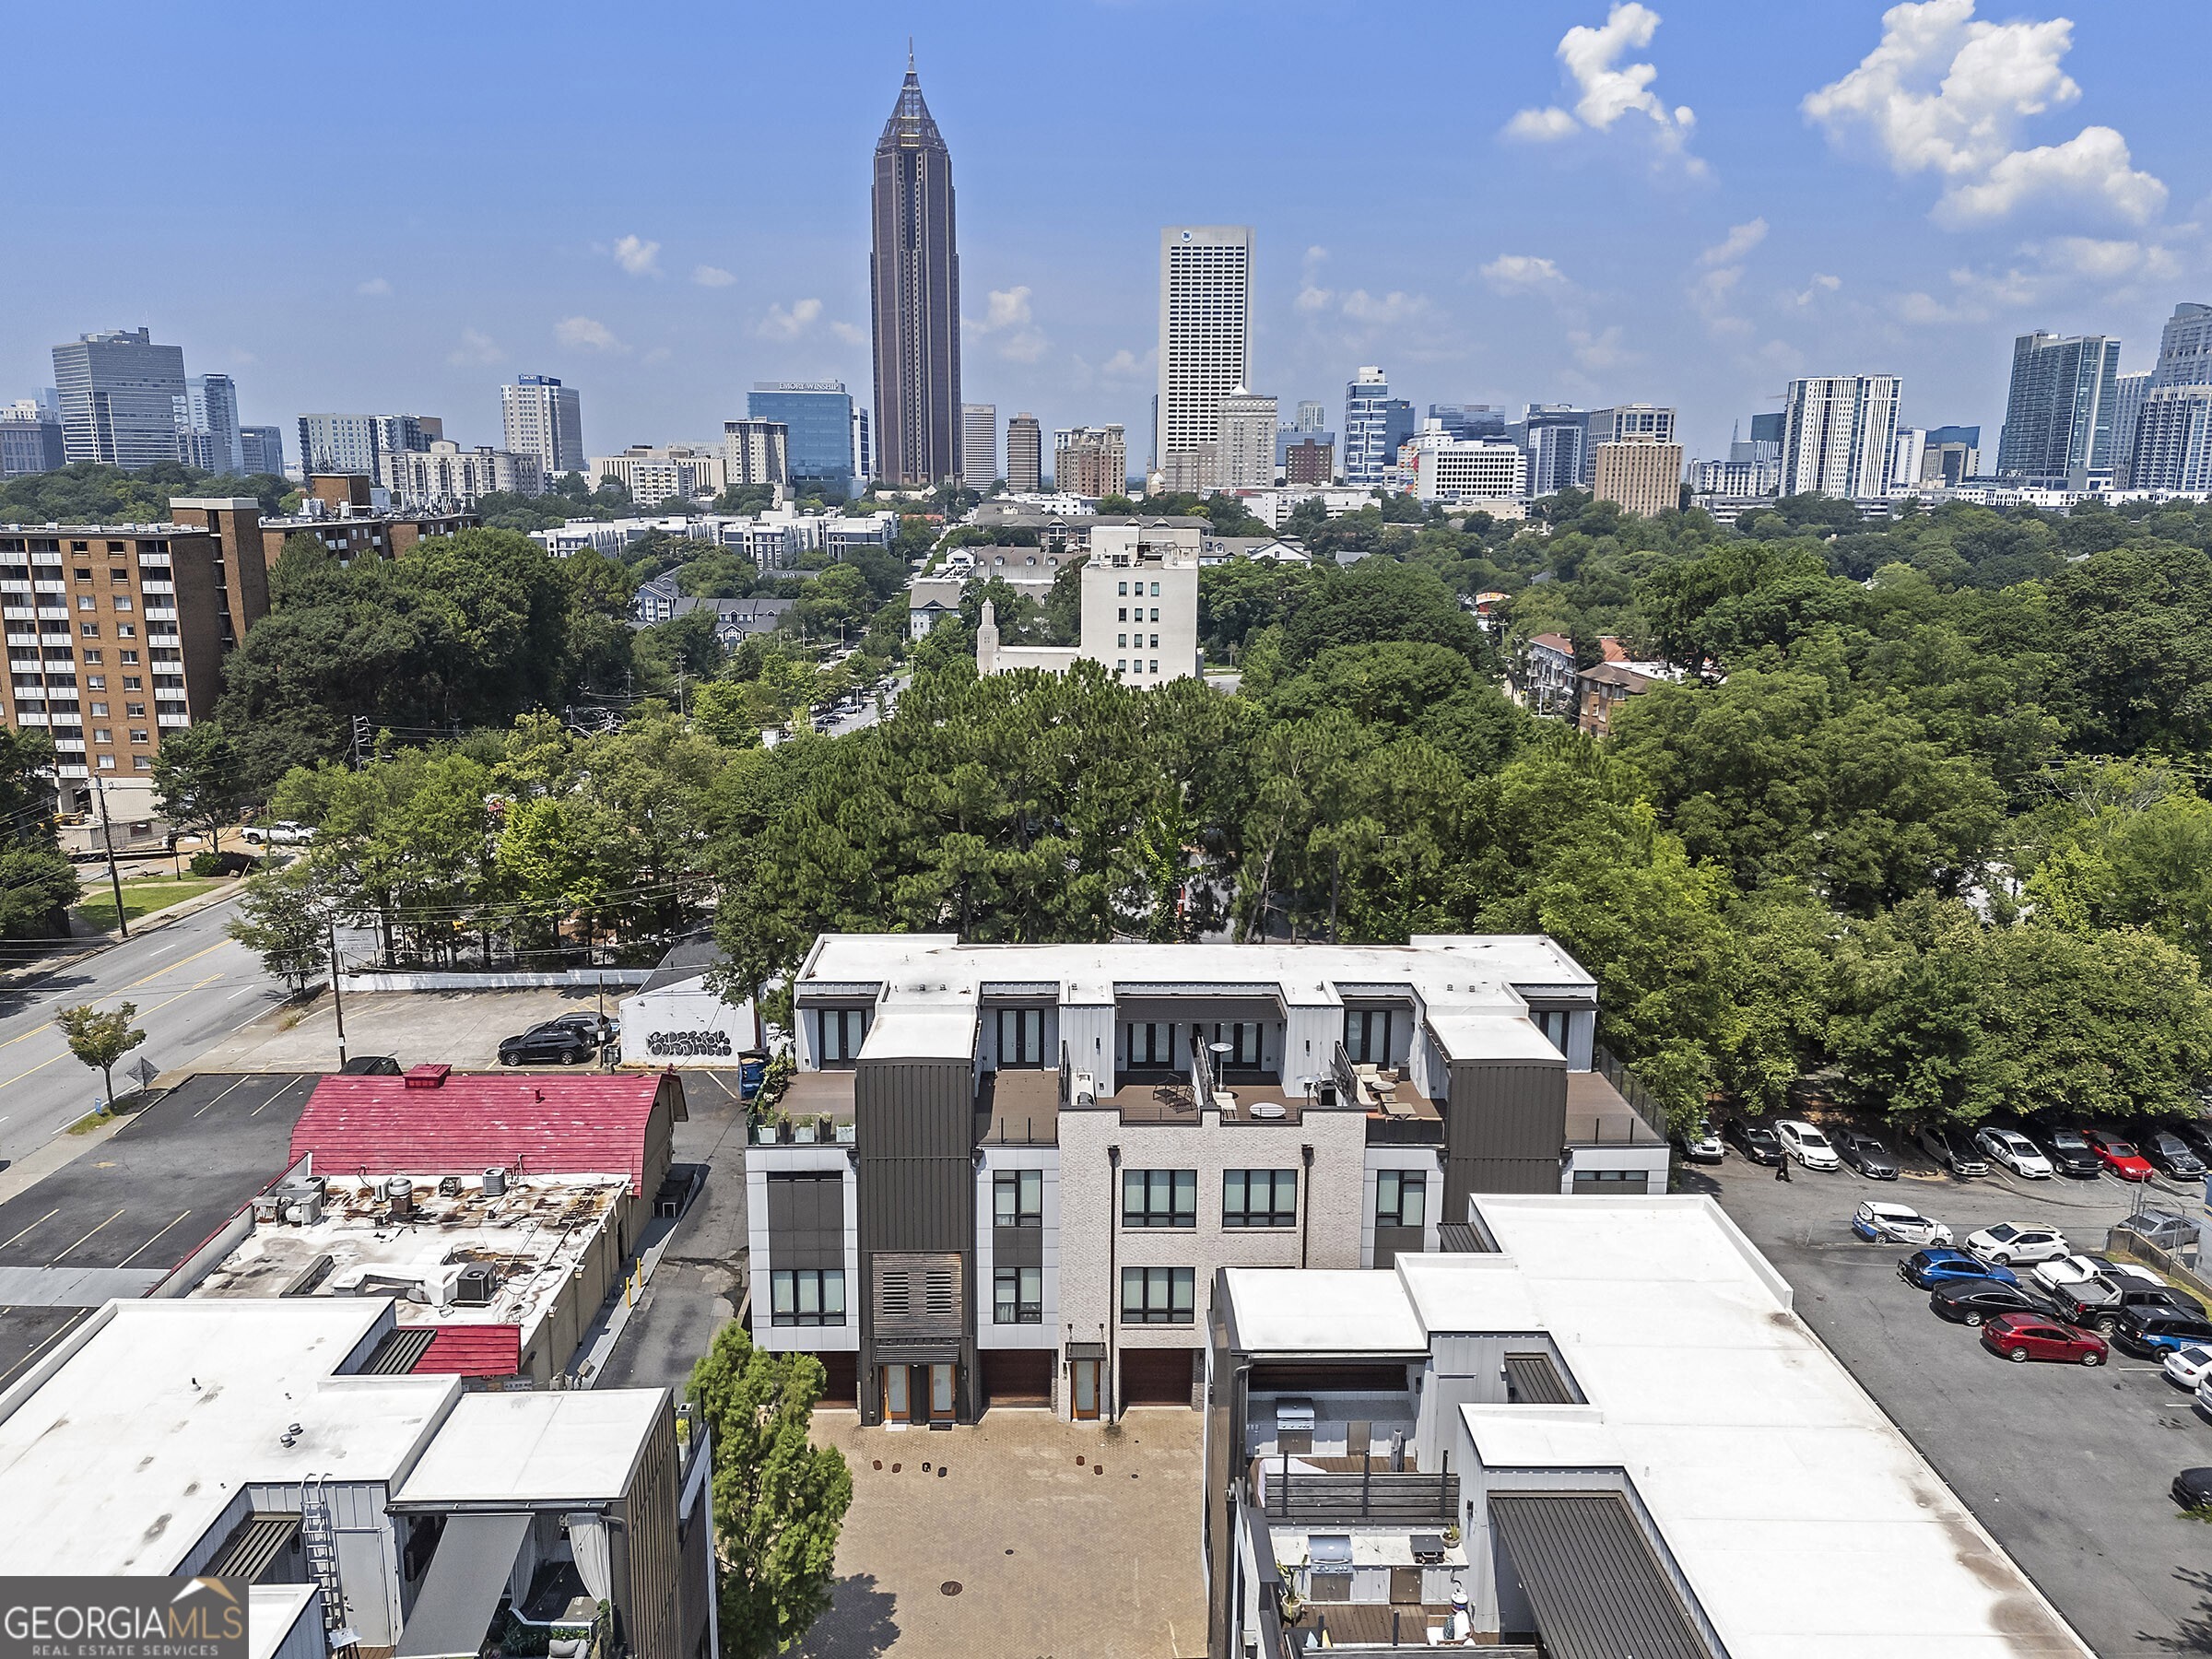
Location
Property Details
Parking
- Description: Attached, Garage, Garage Door Opener, Garage Faces Front
- Details: Attached, Basement, Garage, Garage Door Opener
- Garage Spaces: 0
- Spaces Total: 0
Bedroom Information
- # of Bedrooms: 3
Bathroom Information
- # of Baths (Full): 3
- # of Baths (Partial): 1
- # of Baths (Total): 3.5
Interior Features
- # of Rooms: 9
- # of Stories: 3
- Basement Description: None
- Fireplace: Yes
Exterior Features
- Exterior Walls Materials: Wood
- Foundation: Slab
- Roof Material: Composition
HOA
- Has HOA: Yes
- Association: PMI Terminus
- HOA Fee: $3,000/annually
Land Information
- Land Use: Residential
- Land Use Subtype: Townhouse
Lot Information
- Parcel ID: 14004800101084
- Lot Size: 0 sqft
Property Information
- Property Type: Townhouse
- Style: Contemporary, European
- Year Built: 2019
Tax Information
- Annual Tax: $7,517
Utilities
- Water & Sewer: Public
- Heating: Central, Zoned
- Cooling: Central Air, Zoned
Location
- County: Fulton
Listing Details
Investment Summary
- Monthly Cash Flow
- -$1,189
- Cap Rate
- 3.8%
- Cash-on-Cash Return
- -10.3%
- Debt Coverage Ratio
- 0.61
- Internal Rate of Return (5 years)
- -6.0%
Cash Flow
Net Operating Income (NOI) minus mortgage payments.
Calculation:
NOI - Mortgage Payments
Cap Rate (Market Value)
Capitalization Rate is a rate of return that compares the yearly Net Operating Income (NOI) to the market value.
Calculation:
NOI / Market Value
Cash-on-Cash Return (CoC)
Annual Cash Flow / Cash Invested
Calculation:
Annual cash flow divided by initial cash invested.
Debt Coverage Ratio (DCR)
Net Operating Income (NOI) divided by total debt payments.
Calculation:
NOI / Total Debt Payments
Internal Rate of Return (IRR)
A metric for assessing profitability over time. IRR is the discount rate at which the net present value (NPV) of all future cash flows (positive and negative) from an investment equals zero — including both periodic cash flow (such as rent) and a projected sale at the end of the holding period. It represents the expected annualized return, accounting for income, expenses, and the recovery of capital through a future sale.
Purchase Details
Purchase PriceThe price paid for the property. Purchase price:
| $599,900 |
|---|---|
Amount FinancedThe amount of the purchase financed through a loan. Amount financed:
| -$479,920 |
Down paymentThe initial payment made towards the purchase. Down payment:
| $119,980 |
Closing CostsFees and expenses associated with purchasing a property, typically ranging from 2% to 5% of the home’s purchase price, paid at the end of a home purchase to cover services like lending, title transfer, and taxes. Closing costs:
| $17,997 |
Rehab CostsCosts incurred to repair or improve the property, including: roof, flooring, exterior siding, kitchen, exterior paint, bathrooms, etc. Rehab costs:
| $0 |
Initial Cash InvestedThe total initial cash invested in the property. Calculation:Down payment + Buying costs + Rehab costs Initial cash invested:
| $137,977 |
Square Feet (SQFT)The total square footage of the property. Square feet:
| 1,915 |
Cost Per Square FootCost per square foot of the property. Calculation:Purchase Price / Square Feet Cost per square foot:
| $313 |
Monthly Rent Per Square FootMonthly rent divided by the number of square feet. This ratio helps investors compare rental income efficiency across properties, markets, and unit sizes Calculation:Monthly Rent / Square Feet Monthly rent per square foot:
| $2.09 |
Financing Details
Loan AmountThe total sum of money borrowed from a lender to finance a property purchase. Calculation:Purchase Price - Down Payment
Loan amount:
| $479,920 |
|---|---|
Loan to Value Ratio (LTV)Loan amount divided by the market value of the property. Calculation:Loan Amount / Market Value
Loan to value ratio:
| 80.0% |
Loan TypeThe type of loan (e.g., fixed, adjustable).
Loan type:
| Amortizing |
TermThe loan repayment period in years.
Term:
| 30 years |
Interest RateThe percentage a lender charges on the borrowed amount of a loan, determining the cost of borrowing money.
Interest rate:
| 6.625% |
Principal & Interest (PI)The principal is the portion of the loan payment that reduces the loan balance. The interest is the lender's charge for borrowing money. Calculation:(P * r * (1 + r) ** n) / ((1 + r) ** n - 1) Where:
P = Loan amount (principal)
Principal & interest:
| $3,073 |
Property TaxesAnnual taxes levied by local governments on real estate properties. These taxes fund public services like schools, roads, and emergency services.
Property tax:
| $626 |
InsuranceThe costs for insurance coverage to protect against financial losses due to risks like fire, natural disasters, theft, liability, or tenant-related damages. Calculation:Assumes 7% of gross rental income, unless insurance rates are specified.
Insurance:
| $280 |
Private Mortgage Insurance (PMI)A fee that borrowers pay when they take out a conventional loan with a loan-to-value (LTV) ratio above 80%.
Private mortgage insurance (PMI):
| $0 |
Monthly PaymentThe fixed amount a borrower pays each month to repay a loan. It typically includes principal and interest (P&I) and may also cover property taxes, insurance, HOA fees, and PMI if escrowed. Monthly payment:
| $3,979 |
Operating Income
| % Rent | Monthly | Yearly | |
|---|---|---|---|
Gross RentThe total rental income received from tenants before deducting any expenses. Includes base rent, late fees, pet fees, parking fees, and other recurring charges.
Gross rent:
| $4,000 | $48,000 | |
Vacancy LossExpected loss of rent due to vacancies.
Vacancy loss:
(6%)
| 6% | -$240 | -$2,880 |
Operating IncomeGross rental income minus vacancy loss. Calculation:Gross rent - Vacancy loss
Operating income:
| $3,760 | $45,120 |
Operating Expenses
| % Rent | Monthly | Yearly | |
|---|---|---|---|
Property TaxesAnnual taxes levied by local governments on real estate properties. These taxes fund public services like schools, roads, and emergency services. | 16% | -$626 | -$7,517 |
InsuranceThe costs for insurance coverage to protect against financial losses due to risks like fire, natural disasters, theft, liability, or tenant-related damages. Calculation:Assumes 7% of gross rental income, unless insurance rates are specified. | 7% | -$280 | -$3,360 |
Property ManagementThe costs associated with hiring a property manager to handle the day-to-day operations of a rental property. Includes management fees, leasing fes, eviction fees, etc. Calculation:Assumes 8% of gross rental income. | 8% | -$320 | -$3,840 |
Repairs & MaintenanceOngoing costs for routine upkeep and minor fixes needed to keep a property in good working condition. Calculation:Assumes 5% of gross rental income. Varies by property age and condition. | 5% | -$200 | -$2,400 |
Capital ExpensesLarge, infrequent costs for major improvements or replacements, like a new roof, HVAC system, or appliances. Calculation:Assumes 5% of gross rental income. Varies by property age. | 5% | -$200 | -$2,400 |
HOA FeesRegular dues paid to a Homeowners Association for community maintenance, amenities, and management. Similar fees include: Condo Association Fees, Co-op Maintenance Fees, etc. | 6% | -$250 | -$3,000 |
Operating ExpensesRecurring costs required to maintain and manage a rental property, including property taxes, insurance, maintenance, repairs, utilities (if paid by the owner), property management fees, and other day-to-day expenses. Calculation:Insurance + Property Taxes + Property Management + Repairs & Maintenance + Capital Expenditures + HOA Fees | 47% | -$1,876 | -$22,517 |
Cash Flow
| Monthly | Yearly | |
|---|---|---|
Net Operating Income (NOI)The income generated from a property after deducting all operating expenses but before deducting mortgage payments, taxes, and capital expenditures. Calculation:Gross Operating Income - Operating Expenses
Net operating income:
| $1,884 | $22,608 |
Mortgage PaymentThe fixed amount a borrower pays each month to repay a loan. It typically includes principal and interest (P&I) and may also cover property taxes, insurance, HOA fees, and PMI if escrowed. | -$3,073 | -$36,876 |
Cash FlowNet Operating Income (NOI) minus mortgage payments. Calculation:NOI - Mortgage Payments | -$1,189 | -$14,268 |