Fulton County Investment Properties for Sale
Browse homes for sale and investment properties in Fulton County. Refine your search by price, property type, or more.
Best cash flowing properties in Fulton County
Active
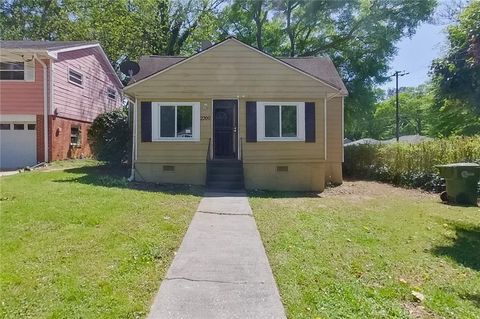
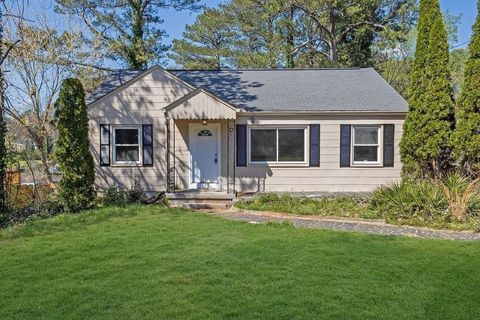
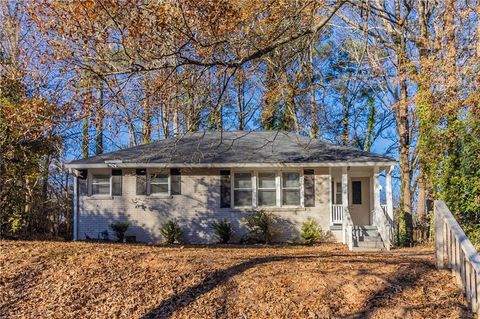
$158,000
2
bds
|
2
ba
|
984
sqft
|
built
1930
2200 Larchwood Rd SW, Atlanta, GA 30310
$115
Cash flow
3.8%
Cash-on-Cash Return
7.0%
Cap rate
1.0%
Rent to Value Ratio
Active
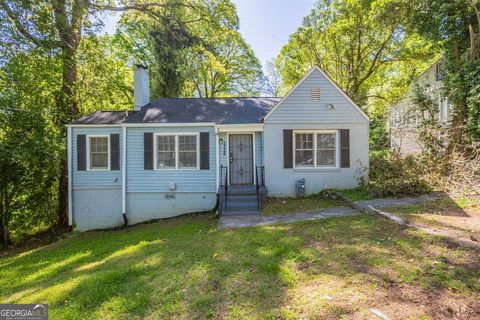
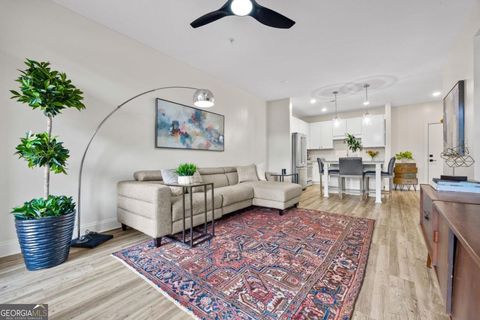
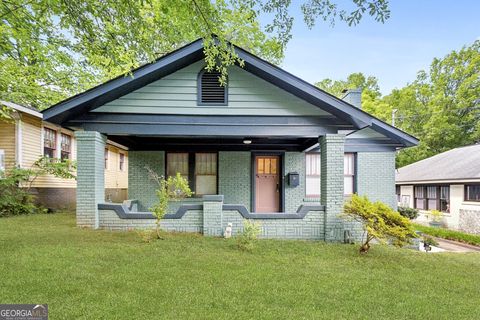
$159,000
2
bds
|
1
ba
|
977
sqft
|
built
1949
1328 Lockhaven Cir SW, Atlanta, GA 30311
$85
Cash flow
2.8%
Cash-on-Cash Return
6.8%
Cap rate
1.0%
Rent to Value Ratio
2,652 out of 3,264 properties for sale in Fulton County
Limited Results Shown
Create a free account, or log in to reveal all property listings and enjoy the complete experience.

Active
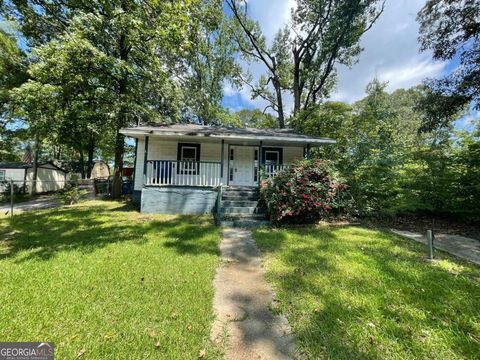
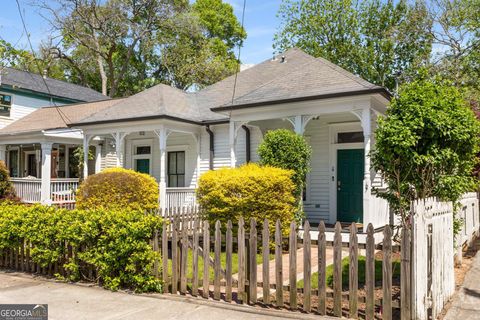
$255,000
3
bds
|
2
ba
|
0
sqft
|
built
1954
2952 Diana Dr SW, Atlanta, GA 30315
$-399
Cash flow
-8.2%
Cash-on-Cash Return
4.3%
Cap rate
0.6%
Rent to Value Ratio

Active
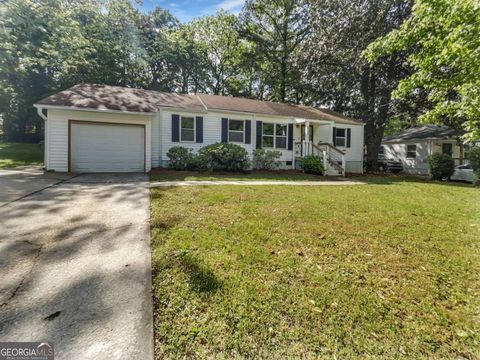
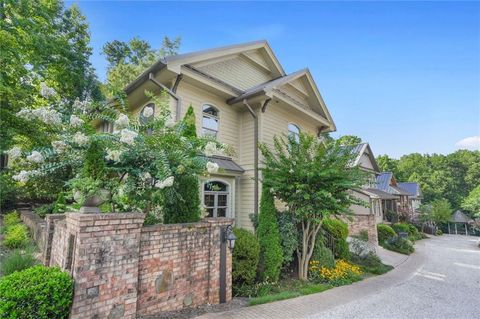
$425,000
6
bds
|
3
ba
|
1,884
sqft
|
built
1945
1591 Woodland Ave SE, Atlanta, GA 30316
$-1,332
Cash flow
-16.4%
Cash-on-Cash Return
2.4%
Cap rate
0.5%
Rent to Value Ratio

Active
$1,440,000
6
bds
|
5
ba
|
6,781
sqft
|
built
1996
14535 Eighteenth Fairway, Milton, GA 30004
$-4,427
Cash flow
-16.0%
Cash-on-Cash Return
2.5%
Cap rate
0.4%
Rent to Value Ratio
Active
$314,000
3
bds
|
1
ba
|
0
sqft
|
built
1930
1199 Warfield St NW, Atlanta, GA 30318
$-845
Cash flow
-14.0%
Cash-on-Cash Return
2.9%
Cap rate
0.6%
Rent to Value Ratio

Active
$246,900
2
bds
|
0
ba
|
0
sqft
|
built
1966
6450 Raymond Dr, Union City, GA 30291
$-778
Cash flow
-16.4%
Cash-on-Cash Return
2.4%
Cap rate
0.4%
Rent to Value Ratio
Active
$268,000
3
bds
|
2
ba
|
2,115
sqft
|
built
1951
2122 Belhaven Ln SE, Atlanta, GA 30315
$-52
Cash flow
-1.0%
Cash-on-Cash Return
5.9%
Cap rate
0.9%
Rent to Value Ratio
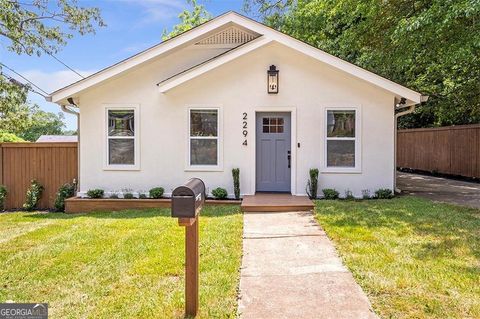
Active
$312,500
3
bds
|
2
ba
|
1,040
sqft
|
built
1920
2294 Hill St NW, Atlanta, GA 30318
$-247
Cash flow
-4.1%
Cash-on-Cash Return
5.2%
Cap rate
0.8%
Rent to Value Ratio

Active
$499,000
2
bds
|
2
ba
|
0
sqft
|
built
2004
825 Highland Ln NE, Atlanta, GA 30306
$-1,207
Cash flow
-12.6%
Cash-on-Cash Return
3.2%
Cap rate
0.6%
Rent to Value Ratio

Active
$279,000
3
bds
|
2
ba
|
1,241
sqft
|
built
1985
1519 Planters Ridge Ln, Alpharetta, GA 30004
$-503
Cash flow
-9.4%
Cash-on-Cash Return
4.0%
Cap rate
0.7%
Rent to Value Ratio

Active
$675,000
2
bds
|
3
ba
|
2,414
sqft
|
built
2003
3330 Overland Dr, Roswell, GA 30075
$-1,996
Cash flow
-15.4%
Cash-on-Cash Return
2.6%
Cap rate
0.6%
Rent to Value Ratio

Active
$650,000
3
bds
|
2.5
ba
|
2,435
sqft
|
built
2007
972 Dunning St SE, Atlanta, GA 30315
$-1,583
Cash flow
-12.7%
Cash-on-Cash Return
3.2%
Cap rate
0.6%
Rent to Value Ratio

Active
$364,000
5
bds
|
3
ba
|
3,890
sqft
|
built
2006
7190 Cavender Dr SW, Atlanta, GA 30331
$-609
Cash flow
-8.7%
Cash-on-Cash Return
4.1%
Cap rate
0.7%
Rent to Value Ratio

Active
$369,000
5
bds
|
4
ba
|
3,212
sqft
|
built
1949
3480 Hogan Rd SW, Atlanta, GA 30331
$-13,110
Cash flow
-185.4%
Cash-on-Cash Return
-36.5%
Cap rate
0.4%
Rent to Value Ratio

Active
$185,000
1
bds
|
1
ba
|
0
sqft
|
built
2004
400 17th St NW, Atlanta, GA 30363
$-245
Cash flow
-6.9%
Cash-on-Cash Return
4.6%
Cap rate
1.1%
Rent to Value Ratio

Active
$169,000
3
bds
|
1.5
ba
|
1,160
sqft
|
built
1945
2817 Burton Rd NW, Atlanta, GA 30311
$55
Cash flow
1.7%
Cash-on-Cash Return
6.5%
Cap rate
1.1%
Rent to Value Ratio

Active
$349,000
1
bds
|
1
ba
|
0
sqft
|
built
2008
855 Peachtree St NE, Atlanta, GA 30308
$-1,210
Cash flow
-18.1%
Cash-on-Cash Return
2.0%
Cap rate
0.7%
Rent to Value Ratio

Active
$580,000
3
bds
|
2.5
ba
|
2,190
sqft
|
built
1993
10000 Barston Ct, Alpharetta, GA 30022
$-1,348
Cash flow
-12.1%
Cash-on-Cash Return
3.4%
Cap rate
0.6%
Rent to Value Ratio

Active
$300,000
3
bds
|
0
ba
|
0
sqft
|
built
1958
1672 Thornton Pl SW, Atlanta, GA 30315
$-533
Cash flow
-9.3%
Cash-on-Cash Return
3.8%
Cap rate
0.6%
Rent to Value Ratio
Active
$307,900
1
bds
|
1
ba
|
956
sqft
|
built
1951
878 Peachtree St NE, Atlanta, GA 30309
$-795
Cash flow
-13.5%
Cash-on-Cash Return
3.0%
Cap rate
0.7%
Rent to Value Ratio

Active
$429,000
4
bds
|
2.5
ba
|
2,902
sqft
|
built
2007
5688 Baffin Rd, Atlanta, GA 30349
$-792
Cash flow
-9.6%
Cash-on-Cash Return
3.9%
Cap rate
0.7%
Rent to Value Ratio
Active
$268,900
3
bds
|
2
ba
|
1,162
sqft
|
built
1964
3833 Bakers Ferry Rd SW, Atlanta, GA 30331
$72
Cash flow
1.4%
Cash-on-Cash Return
6.5%
Cap rate
0.9%
Rent to Value Ratio
Active
$329,000
bds
|
0
ba
|
0
sqft
|
built
1932
2794 7th St SW, Atlanta, GA 30315
$-400
Cash flow
-6.3%
Cash-on-Cash Return
4.7%
Cap rate
0.6%
Rent to Value Ratio

Active
$245,000
3
bds
|
1
ba
|
1,000
sqft
|
built
1964
1703 Barrett Dr NW, Atlanta, GA 30318
$-7
Cash flow
-0.1%
Cash-on-Cash Return
6.1%
Cap rate
0.9%
Rent to Value Ratio

Active
$257,400
3
bds
|
3
ba
|
0
sqft
|
built
2017
667 Carlton Pointe Dr, Palmetto, GA 30268
$-249
Cash flow
-5.0%
Cash-on-Cash Return
4.7%
Cap rate
0.7%
Rent to Value Ratio
Active
$1,299,900
5
bds
|
4.5
ba
|
4,134
sqft
|
built
1998
14492 Club Cir, Alpharetta, GA 30004
$-4,423
Cash flow
-17.8%
Cash-on-Cash Return
1.8%
Cap rate
0.3%
Rent to Value Ratio
Active
$188,000
1
bds
|
1
ba
|
823
sqft
|
built
1995
200 Renaissance Pkwy NE, Atlanta, GA 30308
$-467
Cash flow
-13.0%
Cash-on-Cash Return
3.2%
Cap rate
0.9%
Rent to Value Ratio

Active
$379,900
1
bds
|
1.5
ba
|
960
sqft
|
built
2004
560 Dutch Valley Rd NE, Atlanta, GA 30324
$-666
Cash flow
-9.1%
Cash-on-Cash Return
4.0%
Cap rate
0.8%
Rent to Value Ratio
Active
$275,000
3
bds
|
2
ba
|
1,472
sqft
|
built
2006
6127 Landers Loop, Fairburn, GA 30213
$-572
Cash flow
-10.9%
Cash-on-Cash Return
3.7%
Cap rate
0.7%
Rent to Value Ratio

Active
$1,095,000
3
bds
|
2.5
ba
|
0
sqft
|
built
1938
2908 N Hills Dr NE, Atlanta, GA 30305
$-4,124
Cash flow
-19.6%
Cash-on-Cash Return
1.6%
Cap rate
0.3%
Rent to Value Ratio
Active
$532,000
4
bds
|
3
ba
|
0
sqft
|
built
1972
9480 Coleman Rd, Roswell, GA 30075
$-1,176
Cash flow
-11.5%
Cash-on-Cash Return
3.5%
Cap rate
0.5%
Rent to Value Ratio
Active
$299,900
1
bds
|
1
ba
|
761
sqft
|
built
2005
860 Peachtree St NE, Atlanta, GA 30308
$-825
Cash flow
-14.4%
Cash-on-Cash Return
2.8%
Cap rate
0.7%
Rent to Value Ratio
Active
$214,000
3
bds
|
2
ba
|
1,302
sqft
|
built
1950
1761 Venetian Dr SW, Atlanta, GA 30311
$-375
Cash flow
-9.1%
Cash-on-Cash Return
4.0%
Cap rate
0.8%
Rent to Value Ratio
Active
$245,000
1
bds
|
1
ba
|
0
sqft
|
built
2005
840 United Ave SE, Atlanta, GA 30312
$-573
Cash flow
-12.2%
Cash-on-Cash Return
3.3%
Cap rate
0.7%
Rent to Value Ratio

Active
$329,009
4
bds
|
3
ba
|
2,815
sqft
|
built
1950
2025 Venetian Dr SW, Atlanta, GA 30311
$-871
Cash flow
-13.8%
Cash-on-Cash Return
3.0%
Cap rate
0.5%
Rent to Value Ratio
Active
$649,900
2
bds
|
0
ba
|
0
sqft
|
built
1920
69 Hogue St NE, Atlanta, GA 30312
$-1,984
Cash flow
-15.9%
Cash-on-Cash Return
2.5%
Cap rate
0.5%
Rent to Value Ratio
Active
$1,299,000
5
bds
|
5
ba
|
4,089
sqft
|
built
2011
105 Weatherford Pl, Roswell, GA 30075
$-2,398
Cash flow
-9.6%
Cash-on-Cash Return
3.9%
Cap rate
0.5%
Rent to Value Ratio
Active
$173,000
3
bds
|
1
ba
|
839
sqft
|
built
1949
1807 Oakmont Dr NW, Atlanta, GA 30314
$-83
Cash flow
-2.5%
Cash-on-Cash Return
5.6%
Cap rate
0.8%
Rent to Value Ratio
Active
$675,000
3
bds
|
2
ba
|
1,418
sqft
|
built
1929
531 Atlanta Ave SE, Atlanta, GA 30315
$-1,865
Cash flow
-14.4%
Cash-on-Cash Return
2.8%
Cap rate
0.5%
Rent to Value Ratio