$2,695,000
Investment Summary
- Monthly Cash Flow
- -$9,079
- Cap Rate
- 2.1%
- Cash-on-Cash Return
- -17.6%
- Debt Coverage Ratio
- 0.34
- Internal Rate of Return (5 years)
- -13.0%
Cash Flow
Net Operating Income (NOI) minus mortgage payments.
Calculation:
NOI - Mortgage Payments
Cap Rate (Market Value)
Capitalization Rate is a rate of return that compares the yearly Net Operating Income (NOI) to the market value.
Calculation:
NOI / Market Value
Cash-on-Cash Return (CoC)
Annual Cash Flow / Cash Invested
Calculation:
Annual cash flow divided by initial cash invested.
Debt Coverage Ratio (DCR)
Net Operating Income (NOI) divided by total debt payments.
Calculation:
NOI / Total Debt Payments
Internal Rate of Return (IRR)
A metric for assessing profitability over time. IRR is the discount rate at which the net present value (NPV) of all future cash flows (positive and negative) from an investment equals zero — including both periodic cash flow (such as rent) and a projected sale at the end of the holding period. It represents the expected annualized return, accounting for income, expenses, and the recovery of capital through a future sale.
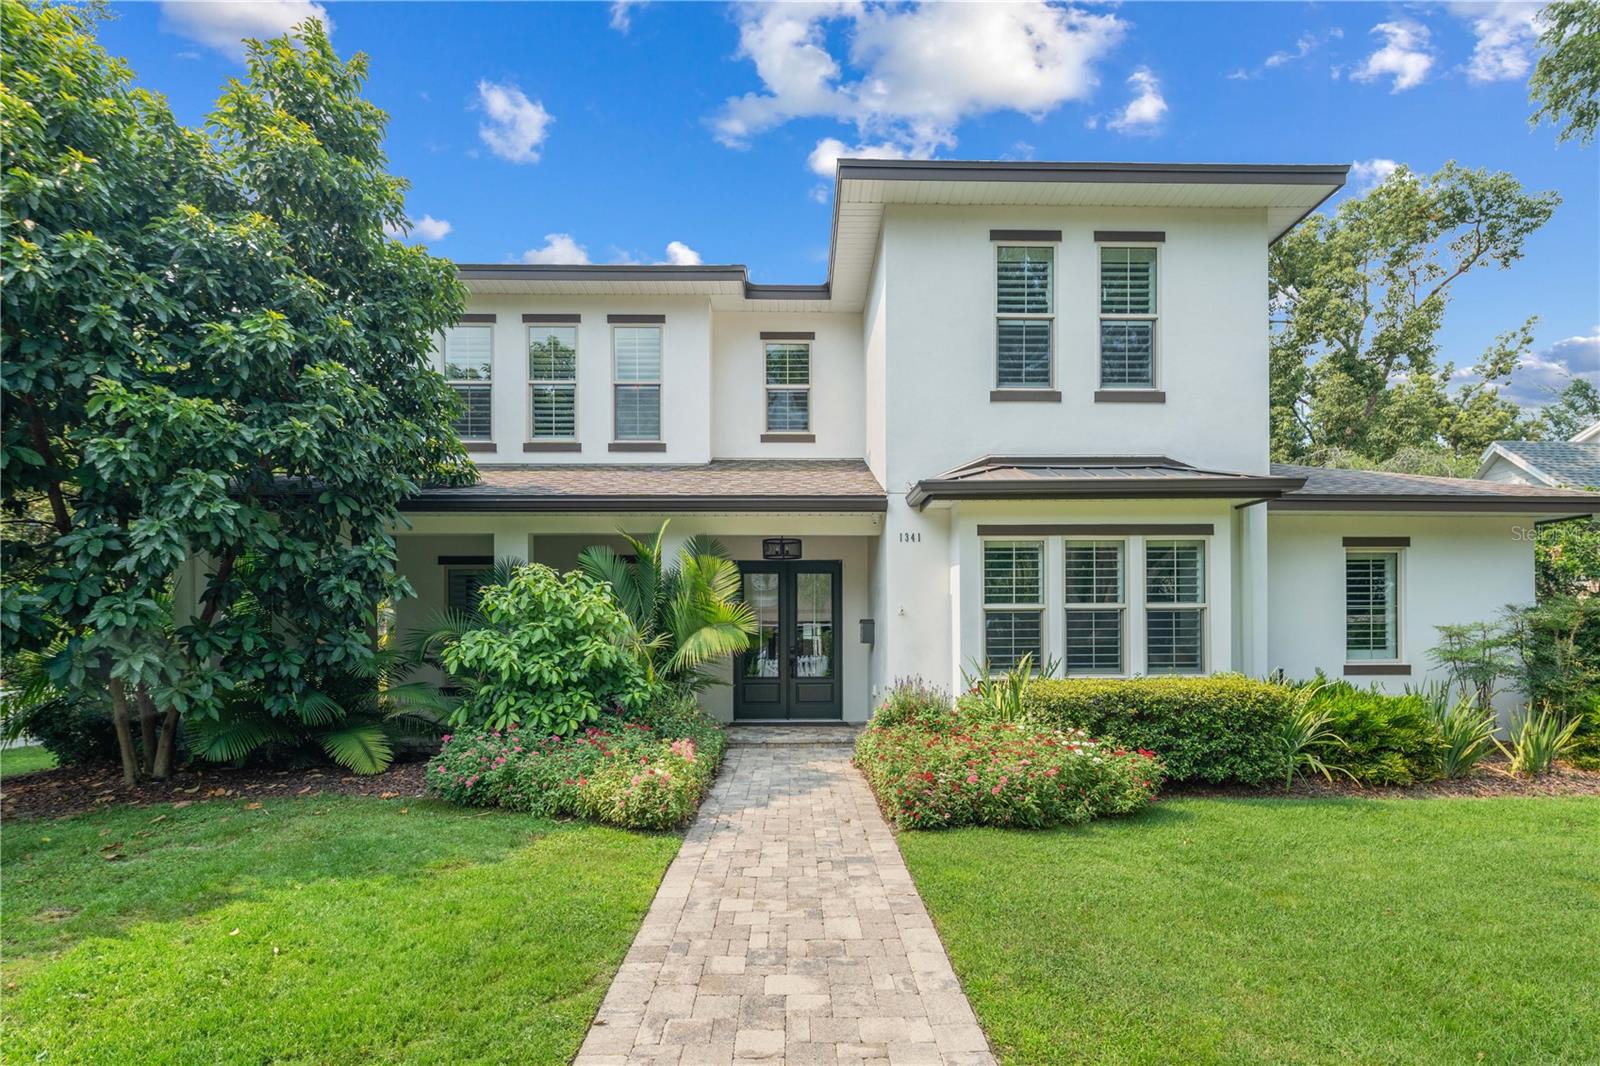
Property Description
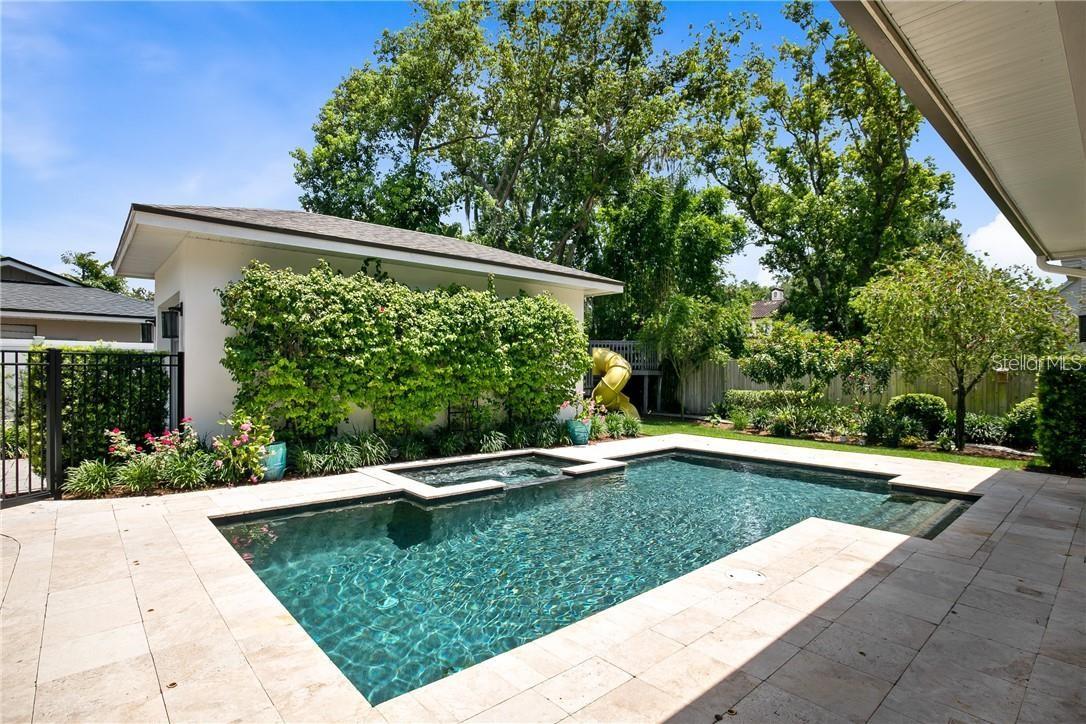
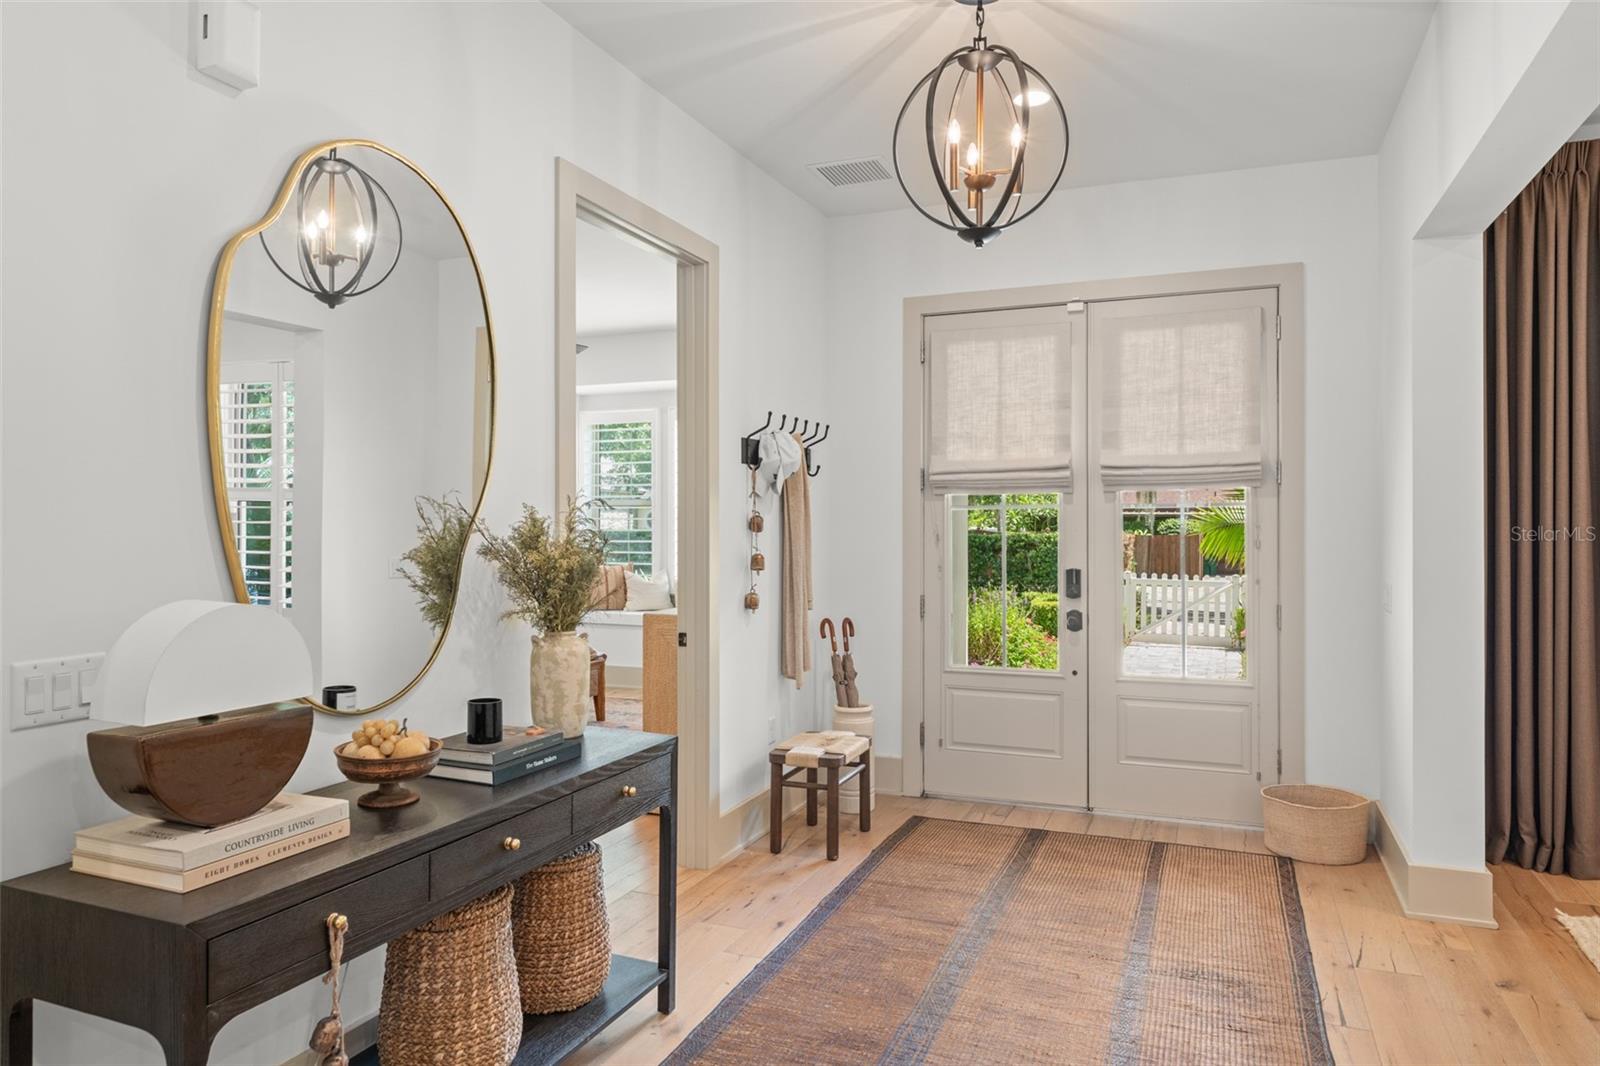
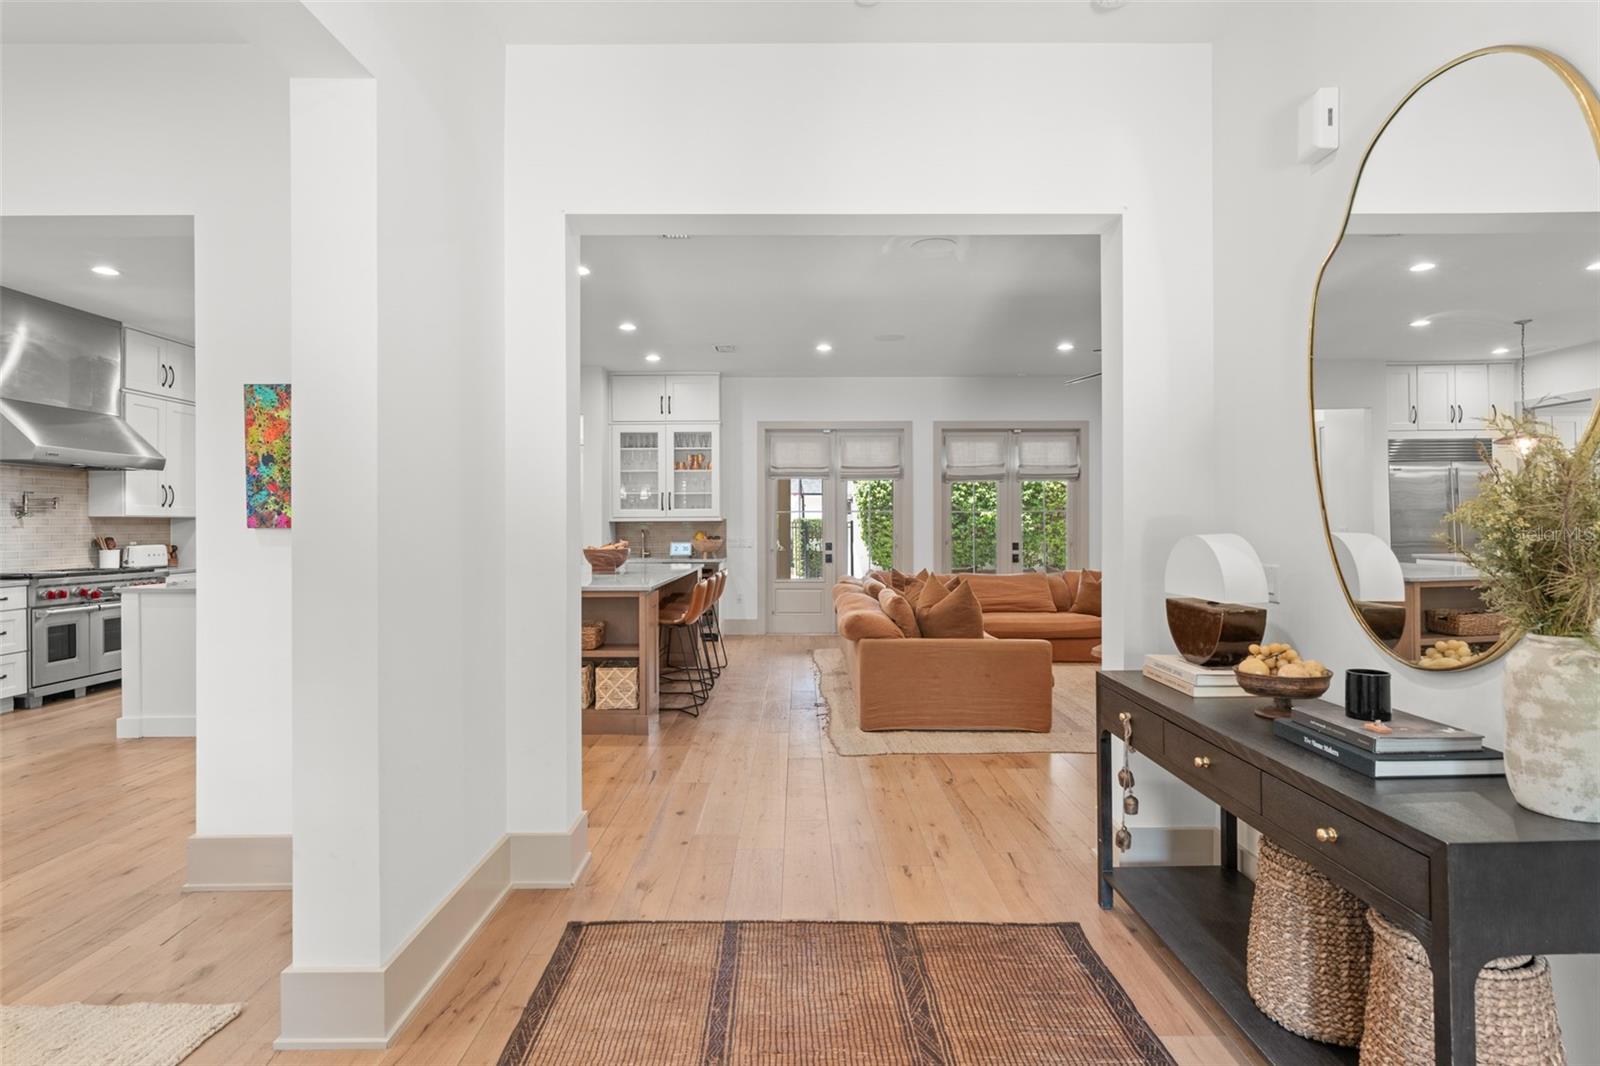
Discover luxury living in this custom Austin Homes 5 bedroom, 5 and one half bath transitional style home that offers a blend of modern and traditional elements coupled with a highly desirable Winter Park location. This residence boasts a sought-after open floor plan with 12-foot ceilings, wide plank wood flooring and truly exceptional detailed finishes throughout. You will feel instantly at home as you pass through the fully enclosed front yard and enter through the double door entrance from the covered wrap-around front porch. The open-concept design seamlessly connect the dining room and family rooms as you make your way to the kitchen area complete with Wolf & Sub-Zero stainless-steel appliances, double islands, Wellborn custom cabinetry, and private Butler's Pantry with new washer/dryer. The gourmet kitchen opens to the spacious family room where you will find a built-in fireplace with custom millwork, recessed lighting, and beautiful French doors that open fully to the outside entertainment/living area. The split floor plan is perfect for the family and as you find your way throughout the remainder of the home, you will be impressed by the designer window treatments, plantation shutters, built-in speaker system, high-quality upgraded light fixtures, and private pool bath. The main floor includes a spacious primary retreat with a large walk-in closet and private French doors leading to the pool area. The spa-like bathroom includes a stand-along soaking tub, dual sink with stone counters and generous walk-in shower. The formal dining room and en-suite guest bedroom complete the first level. Upstairs are 3 spacious bedroom suites with full baths, a generous bonus/media room with built-in desk, and a second upstairs laundry room with hook ups. You will enjoy Florida living while relaxing on your covered lanai complete with retractable screens and summer kitchen overlooking the saltwater sparkling pool/spa with new pool heater and fully enclosed kid friendly yard. Upgrades include: Control 4, new electronic driveway entry gate, whole house interior and exterior painting, Jeld Wen solid core interior doors, hardwood floors throughout the first floor & bonus room, custom closet systems in all closets, rare 3-car garage, vinyl insulated windows, core fill & block walls, high density spray foam insulation in ceilings, R13 in frame walls, Carrier 15-Seer AC dual systems with UV filtration, and two Rinnai gas tankless water heaters, whole house water filtration. This pristine residence is situated on an oversized corner lot and it truly timeless, move-in ready, and only ½ mile to the Winter Park Raquet Club and 2 miles to famed Park Avenue to enjoy incredible dining and boutique shopping. Call now for your private tour!
Build Your Team
Quickly find investor-friendly professionals who can help you succeed in real estate investing at any stage of the investing journey.


Agents
Match with investor-friendly agents who can help you find, analyze, and close your next deal


Lenders
Get the best funding…find investor-friendly lenders who specialize in your deal strategy


Property Managers
Transition to passive investing. Find a trusted property management partnership that lasts.


Tax Pros & Accountants
Taxes and financial reporting made easy—find experts to create tax savings strategies, file taxes, and more
Location
Property Details
Parking
- Description: Garage Faces Rear, Garage Faces Side, On Street
- Details: Garage Faces Rear, Garage Faces Side, On Street, Attached
- Garage Spaces: 3
- Spaces Total: 0
Bedroom Information
- # of Bedrooms: 5
Bathroom Information
- # of Baths (Full): 5
- # of Baths (Total): 6.0
Interior Features
- # of Rooms: 9
- # of Stories: 2
- Fireplace: Yes
Exterior Features
- Exterior Walls Materials: Stucco
- Foundation: Slab
- Roof Type: Gable or Hip
- Roof Material: Shingle
- Pool: Yes
Land Information
- Land Use: Residential
- Land Use Subtype: Single Family Residential
Lot Information
- Parcel ID: 322130282001010
- Lot Size: 13978 sqft
Property Information
- Property Type: Single Family Residence
- Year Built: 2016
Tax Information
- Annual Tax: $27,746
Utilities
- Water & Sewer: Public
- Heating: Central, Zoned
- Cooling: Central Air, Zoned
Location
- County: Orange
Listing Details
Investment Summary
- Monthly Cash Flow
- -$9,079
- Cap Rate
- 2.1%
- Cash-on-Cash Return
- -17.6%
- Debt Coverage Ratio
- 0.34
- Internal Rate of Return (5 years)
- -13.0%
Cash Flow
Net Operating Income (NOI) minus mortgage payments.
Calculation:
NOI - Mortgage Payments
Cap Rate (Market Value)
Capitalization Rate is a rate of return that compares the yearly Net Operating Income (NOI) to the market value.
Calculation:
NOI / Market Value
Cash-on-Cash Return (CoC)
Annual Cash Flow / Cash Invested
Calculation:
Annual cash flow divided by initial cash invested.
Debt Coverage Ratio (DCR)
Net Operating Income (NOI) divided by total debt payments.
Calculation:
NOI / Total Debt Payments
Internal Rate of Return (IRR)
A metric for assessing profitability over time. IRR is the discount rate at which the net present value (NPV) of all future cash flows (positive and negative) from an investment equals zero — including both periodic cash flow (such as rent) and a projected sale at the end of the holding period. It represents the expected annualized return, accounting for income, expenses, and the recovery of capital through a future sale.
Purchase Details
Purchase PriceThe price paid for the property. Purchase price:
| $2,695,000 |
|---|---|
Amount FinancedThe amount of the purchase financed through a loan. Amount financed:
| -$2,156,000 |
Down paymentThe initial payment made towards the purchase. Down payment:
| $539,000 |
Closing CostsFees and expenses associated with purchasing a property, typically ranging from 2% to 5% of the home’s purchase price, paid at the end of a home purchase to cover services like lending, title transfer, and taxes. Closing costs:
| $80,850 |
Rehab CostsCosts incurred to repair or improve the property, including: roof, flooring, exterior siding, kitchen, exterior paint, bathrooms, etc. Rehab costs:
| $0 |
Initial Cash InvestedThe total initial cash invested in the property. Calculation:Down payment + Buying costs + Rehab costs Initial cash invested:
| $619,850 |
Square Feet (SQFT)The total square footage of the property. Square feet:
| 4,469 |
Cost Per Square FootCost per square foot of the property. Calculation:Purchase Price / Square Feet Cost per square foot:
| $603 |
Monthly Rent Per Square FootMonthly rent divided by the number of square feet. This ratio helps investors compare rental income efficiency across properties, markets, and unit sizes Calculation:Monthly Rent / Square Feet Monthly rent per square foot:
| $2.28 |
Financing Details
Loan AmountThe total sum of money borrowed from a lender to finance a property purchase. Calculation:Purchase Price - Down Payment
Loan amount:
| $2,156,000 |
|---|---|
Loan to Value Ratio (LTV)Loan amount divided by the market value of the property. Calculation:Loan Amount / Market Value
Loan to value ratio:
| 80.0% |
Loan TypeThe type of loan (e.g., fixed, adjustable).
Loan type:
| Amortizing |
TermThe loan repayment period in years.
Term:
| 30 years |
Interest RateThe percentage a lender charges on the borrowed amount of a loan, determining the cost of borrowing money.
Interest rate:
| 6.625% |
Principal & Interest (PI)The principal is the portion of the loan payment that reduces the loan balance. The interest is the lender's charge for borrowing money. Calculation:(P * r * (1 + r) ** n) / ((1 + r) ** n - 1) Where:
P = Loan amount (principal)
Principal & interest:
| $13,805 |
Property TaxesAnnual taxes levied by local governments on real estate properties. These taxes fund public services like schools, roads, and emergency services.
Property tax:
| $2,312 |
InsuranceThe costs for insurance coverage to protect against financial losses due to risks like fire, natural disasters, theft, liability, or tenant-related damages. Calculation:Assumes 7% of gross rental income, unless insurance rates are specified.
Insurance:
| $714 |
Private Mortgage Insurance (PMI)A fee that borrowers pay when they take out a conventional loan with a loan-to-value (LTV) ratio above 80%.
Private mortgage insurance (PMI):
| $0 |
Monthly PaymentThe fixed amount a borrower pays each month to repay a loan. It typically includes principal and interest (P&I) and may also cover property taxes, insurance, HOA fees, and PMI if escrowed. Monthly payment:
| $16,831 |
Operating Income
| % Rent | Monthly | Yearly | |
|---|---|---|---|
Gross RentThe total rental income received from tenants before deducting any expenses. Includes base rent, late fees, pet fees, parking fees, and other recurring charges.
Gross rent:
| $10,200 | $122,400 | |
Vacancy LossExpected loss of rent due to vacancies.
Vacancy loss:
(6%)
| 6% | -$612 | -$7,344 |
Operating IncomeGross rental income minus vacancy loss. Calculation:Gross rent - Vacancy loss
Operating income:
| $9,588 | $115,056 |
Operating Expenses
| % Rent | Monthly | Yearly | |
|---|---|---|---|
Property TaxesAnnual taxes levied by local governments on real estate properties. These taxes fund public services like schools, roads, and emergency services. | 23% | -$2,312 | -$27,746 |
InsuranceThe costs for insurance coverage to protect against financial losses due to risks like fire, natural disasters, theft, liability, or tenant-related damages. Calculation:Assumes 7% of gross rental income, unless insurance rates are specified. | 7% | -$714 | -$8,568 |
Property ManagementThe costs associated with hiring a property manager to handle the day-to-day operations of a rental property. Includes management fees, leasing fes, eviction fees, etc. Calculation:Assumes 8% of gross rental income. | 8% | -$816 | -$9,792 |
Repairs & MaintenanceOngoing costs for routine upkeep and minor fixes needed to keep a property in good working condition. Calculation:Assumes 5% of gross rental income. Varies by property age and condition. | 5% | -$510 | -$6,120 |
Capital ExpensesLarge, infrequent costs for major improvements or replacements, like a new roof, HVAC system, or appliances. Calculation:Assumes 5% of gross rental income. Varies by property age. | 5% | -$510 | -$6,120 |
HOA FeesRegular dues paid to a Homeowners Association for community maintenance, amenities, and management. Similar fees include: Condo Association Fees, Co-op Maintenance Fees, etc. | n/a | n/a | n/a |
Operating ExpensesRecurring costs required to maintain and manage a rental property, including property taxes, insurance, maintenance, repairs, utilities (if paid by the owner), property management fees, and other day-to-day expenses. Calculation:Insurance + Property Taxes + Property Management + Repairs & Maintenance + Capital Expenditures + HOA Fees | 48% | -$4,862 | -$58,346 |
Cash Flow
| Monthly | Yearly | |
|---|---|---|
Net Operating Income (NOI)The income generated from a property after deducting all operating expenses but before deducting mortgage payments, taxes, and capital expenditures. Calculation:Gross Operating Income - Operating Expenses
Net operating income:
| $4,726 | $56,712 |
Mortgage PaymentThe fixed amount a borrower pays each month to repay a loan. It typically includes principal and interest (P&I) and may also cover property taxes, insurance, HOA fees, and PMI if escrowed. | -$13,805 | -$165,660 |
Cash FlowNet Operating Income (NOI) minus mortgage payments. Calculation:NOI - Mortgage Payments | $9,079 | $108,948 |