
$2,995,000
Investment Summary
- Monthly Cash Flow
- -$10,783
- Cap Rate
- 1.8%
- Cash-on-Cash Return
- -18.8%
- Debt Coverage Ratio
- 0.30
- Internal Rate of Return (5 years)
- -14.2%
Cash Flow
Net Operating Income (NOI) minus mortgage payments.
Calculation:
NOI - Mortgage Payments
Cap Rate (Market Value)
Capitalization Rate is a rate of return that compares the yearly Net Operating Income (NOI) to the market value.
Calculation:
NOI / Market Value
Cash-on-Cash Return (CoC)
Annual Cash Flow / Cash Invested
Calculation:
Annual cash flow divided by initial cash invested.
Debt Coverage Ratio (DCR)
Net Operating Income (NOI) divided by total debt payments.
Calculation:
NOI / Total Debt Payments
Internal Rate of Return (IRR)
A metric for assessing profitability over time. IRR is the discount rate at which the net present value (NPV) of all future cash flows (positive and negative) from an investment equals zero — including both periodic cash flow (such as rent) and a projected sale at the end of the holding period. It represents the expected annualized return, accounting for income, expenses, and the recovery of capital through a future sale.
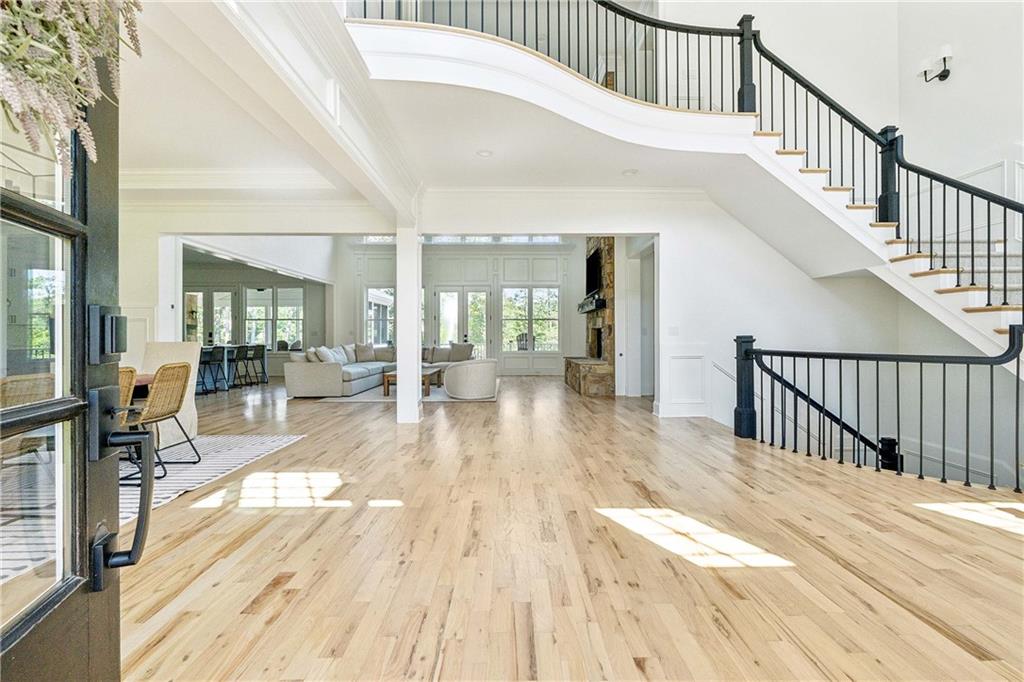
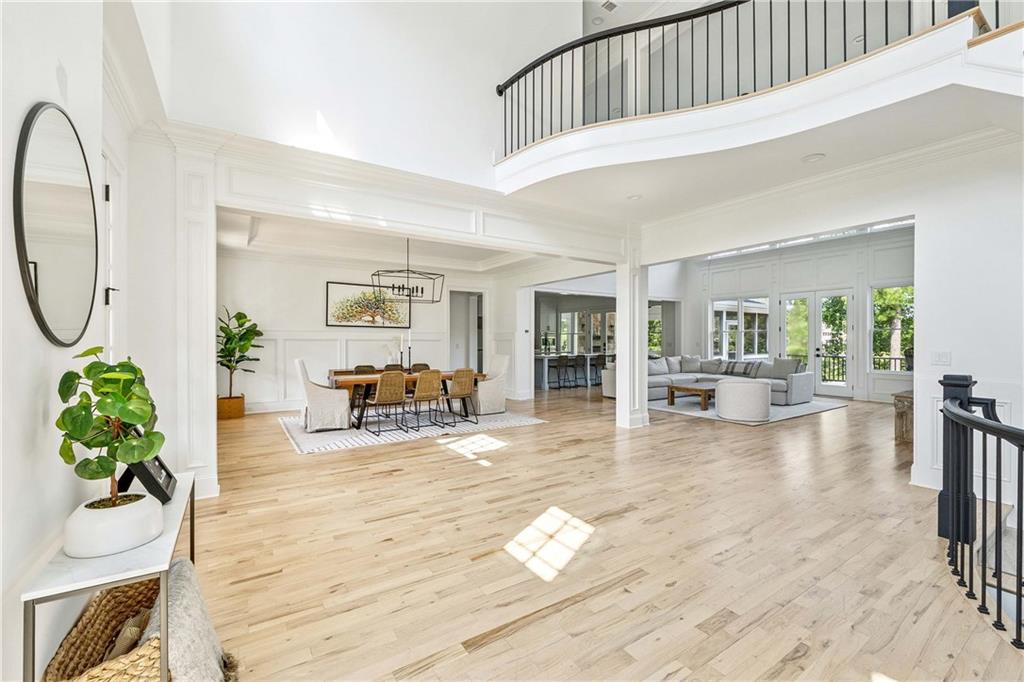
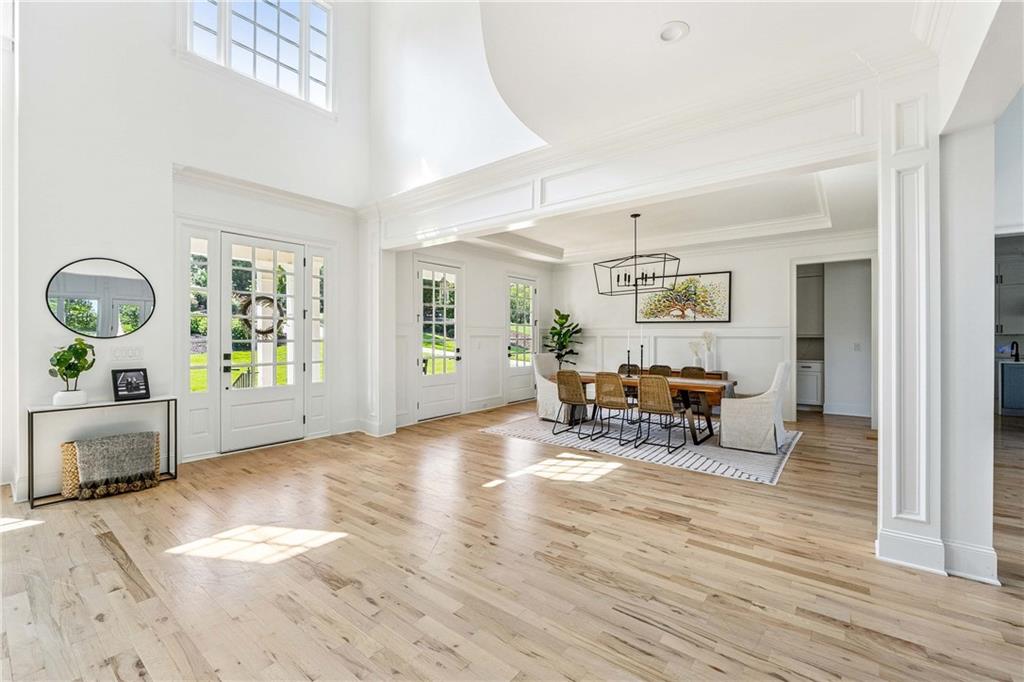
Property Description
Live the Art of Timeless Luxury in this Modernized Custom Estate on the Lake Perfectly situated at the center point of the lake in the prestigious Lake Haven community, this one-of-a-kind custom-built farmhouse-style estate offers panoramic water views and direct lake access for kayaking, fishing, and serene relaxation—all just minutes from downtown Alpharetta and Milton. This is not a builder-grade model, but a thoughtfully designed and fully modernized estate blending timeless architectural details with today’s high-end upgrades. Completely renovated in 2024–2025, this home features an open floor plan with soaring 10’+ ceilings, walls of windows, and elegant designer finishes throughout. Freshly refinished hardwood floors, all-new Sherwin-Williams Pure White paint, updated LED lighting, new stair balusters, premium Karastan carpet, and LVP flooring on the terrace level create a bright and cohesive interior. The chef’s kitchen is a true centerpiece, boasting dual quartz islands, matching quartz backsplash, custom cabinetry, Wolf appliances, and striking fixtures and hardware. A double-sided stacked stone fireplace connects the living and family rooms, while French doors open to a versatile office or playroom. The owner’s suite offers lake views, dual walk-in closets, and a spa-inspired bath. Upstairs, you’ll find four spacious en-suite bedrooms. The terrace level includes a full in-law suite, second laundry, and a secret bunk bedroom that adds a whimsical and private retreat, ideal for guests or children. Home offers abundant space for multi-generational living. Two water heaters, a whole-home 4-ton Trane variable-speed HVAC system with humidifier and UV lights, a 26kW generator, and a 2025 Owens Corning roof with transferable warranty and Solar Heat Shield underlayment provide comfort and peace of mind. Outdoor living is truly unmatched. At the rear of the home, enjoy over 1,100 square feet of Trex decking with TimberTech lighted railing, a covered 340 square foot screened porch, and a fully under-decked patio area flanked by beautiful cedar posts—perfect for entertaining or relaxing year-round. The professionally landscaped yard features over 60 plantings, new gutters, Trimlight permanent holiday lighting, and lush Zoysia grass. The luxurious saltwater pool includes a safety fence, new variable-speed pump, heater, and salt cell, with a nearby outdoor kitchen ideal for hosting. End your days by the firepit watching the sunset reflect off the lake. Lake Haven offers a fully stocked lake, community dock, scenic walking trail to a waterfall, and a lifestyle of privacy, luxury, and connection to nature. Don’t miss this rare opportunity to own one of Milton’s finest lakefront custom estates.
Build Your Team
Quickly find investor-friendly professionals who can help you succeed in real estate investing at any stage of the investing journey.


Agents
Match with investor-friendly agents who can help you find, analyze, and close your next deal


Lenders
Get the best funding…find investor-friendly lenders who specialize in your deal strategy


Property Managers
Transition to passive investing. Find a trusted property management partnership that lasts.


Tax Pros & Accountants
Taxes and financial reporting made easy—find experts to create tax savings strategies, file taxes, and more
Location
Property Details
Parking
- Description: Attached, Garage, Kitchen Level, Side/Rear Entrance
- Details: Attached, Garage, Garage Faces Side, Kitchen Level
- Garage Spaces: 3
- Spaces Total: 0
Bedroom Information
- # of Bedrooms: 6
Bathroom Information
- # of Baths (Full): 5
- # of Baths (Partial): 1
- # of Baths (Total): 6.0
Interior Features
- # of Rooms: 9
- # of Stories: 3
- Basement: Yes
- Basement Description: Daylight, Exterior Entry, Finished, Full, Interior Entry
- Fireplace: Yes
Exterior Features
- Exterior Walls Materials: Concrete
- Foundation: Concrete Perimeter
- Roof Material: Composition
- Pool: Yes
HOA
- Has HOA: Yes
- HOA Fee: $1,250/annually
Land Information
- Land Use: Residential
- Land Use Subtype: Single Family Residential
Lot Information
- Parcel ID: 22430009570253
- Lot Size: 0 sqft
Property Information
- Property Type: Single Family Residence
- Style: Craftsman
- Year Built: 2013
Tax Information
- Annual Tax: $16,909
Utilities
- Water & Sewer: Public
- Heating: Central, Forced Air, Natural Gas, Zoned
- Cooling: Ceiling Fan(s), Central Air, Zoned
Location
- County: Fulton
Listing Details
Investment Summary
- Monthly Cash Flow
- -$10,783
- Cap Rate
- 1.8%
- Cash-on-Cash Return
- -18.8%
- Debt Coverage Ratio
- 0.30
- Internal Rate of Return (5 years)
- -14.2%
Cash Flow
Net Operating Income (NOI) minus mortgage payments.
Calculation:
NOI - Mortgage Payments
Cap Rate (Market Value)
Capitalization Rate is a rate of return that compares the yearly Net Operating Income (NOI) to the market value.
Calculation:
NOI / Market Value
Cash-on-Cash Return (CoC)
Annual Cash Flow / Cash Invested
Calculation:
Annual cash flow divided by initial cash invested.
Debt Coverage Ratio (DCR)
Net Operating Income (NOI) divided by total debt payments.
Calculation:
NOI / Total Debt Payments
Internal Rate of Return (IRR)
A metric for assessing profitability over time. IRR is the discount rate at which the net present value (NPV) of all future cash flows (positive and negative) from an investment equals zero — including both periodic cash flow (such as rent) and a projected sale at the end of the holding period. It represents the expected annualized return, accounting for income, expenses, and the recovery of capital through a future sale.
Purchase Details
Purchase PriceThe price paid for the property. Purchase price:
| $2,995,000 |
|---|---|
Amount FinancedThe amount of the purchase financed through a loan. Amount financed:
| -$2,396,000 |
Down paymentThe initial payment made towards the purchase. Down payment:
| $599,000 |
Closing CostsFees and expenses associated with purchasing a property, typically ranging from 2% to 5% of the home’s purchase price, paid at the end of a home purchase to cover services like lending, title transfer, and taxes. Closing costs:
| $89,850 |
Rehab CostsCosts incurred to repair or improve the property, including: roof, flooring, exterior siding, kitchen, exterior paint, bathrooms, etc. Rehab costs:
| $0 |
Initial Cash InvestedThe total initial cash invested in the property. Calculation:Down payment + Buying costs + Rehab costs Initial cash invested:
| $688,850 |
Square Feet (SQFT)The total square footage of the property. Square feet:
| 8,730 |
Cost Per Square FootCost per square foot of the property. Calculation:Purchase Price / Square Feet Cost per square foot:
| $343 |
Monthly Rent Per Square FootMonthly rent divided by the number of square feet. This ratio helps investors compare rental income efficiency across properties, markets, and unit sizes Calculation:Monthly Rent / Square Feet Monthly rent per square foot:
| $1.01 |
Financing Details
Loan AmountThe total sum of money borrowed from a lender to finance a property purchase. Calculation:Purchase Price - Down Payment
Loan amount:
| $2,396,000 |
|---|---|
Loan to Value Ratio (LTV)Loan amount divided by the market value of the property. Calculation:Loan Amount / Market Value
Loan to value ratio:
| 80.0% |
Loan TypeThe type of loan (e.g., fixed, adjustable).
Loan type:
| Amortizing |
TermThe loan repayment period in years.
Term:
| 30 years |
Interest RateThe percentage a lender charges on the borrowed amount of a loan, determining the cost of borrowing money.
Interest rate:
| 6.625% |
Principal & Interest (PI)The principal is the portion of the loan payment that reduces the loan balance. The interest is the lender's charge for borrowing money. Calculation:(P * r * (1 + r) ** n) / ((1 + r) ** n - 1) Where:
P = Loan amount (principal)
Principal & interest:
| $15,342 |
Property TaxesAnnual taxes levied by local governments on real estate properties. These taxes fund public services like schools, roads, and emergency services.
Property tax:
| $1,409 |
InsuranceThe costs for insurance coverage to protect against financial losses due to risks like fire, natural disasters, theft, liability, or tenant-related damages. Calculation:Assumes 7% of gross rental income, unless insurance rates are specified.
Insurance:
| $616 |
Private Mortgage Insurance (PMI)A fee that borrowers pay when they take out a conventional loan with a loan-to-value (LTV) ratio above 80%.
Private mortgage insurance (PMI):
| $0 |
Monthly PaymentThe fixed amount a borrower pays each month to repay a loan. It typically includes principal and interest (P&I) and may also cover property taxes, insurance, HOA fees, and PMI if escrowed. Monthly payment:
| $17,367 |
Operating Income
| % Rent | Monthly | Yearly | |
|---|---|---|---|
Gross RentThe total rental income received from tenants before deducting any expenses. Includes base rent, late fees, pet fees, parking fees, and other recurring charges.
Gross rent:
| $8,800 | $105,600 | |
Vacancy LossExpected loss of rent due to vacancies.
Vacancy loss:
(6%)
| 6% | -$528 | -$6,336 |
Operating IncomeGross rental income minus vacancy loss. Calculation:Gross rent - Vacancy loss
Operating income:
| $8,272 | $99,264 |
Operating Expenses
| % Rent | Monthly | Yearly | |
|---|---|---|---|
Property TaxesAnnual taxes levied by local governments on real estate properties. These taxes fund public services like schools, roads, and emergency services. | 16% | -$1,409 | -$16,909 |
InsuranceThe costs for insurance coverage to protect against financial losses due to risks like fire, natural disasters, theft, liability, or tenant-related damages. Calculation:Assumes 7% of gross rental income, unless insurance rates are specified. | 7% | -$616 | -$7,392 |
Property ManagementThe costs associated with hiring a property manager to handle the day-to-day operations of a rental property. Includes management fees, leasing fes, eviction fees, etc. Calculation:Assumes 8% of gross rental income. | 8% | -$704 | -$8,448 |
Repairs & MaintenanceOngoing costs for routine upkeep and minor fixes needed to keep a property in good working condition. Calculation:Assumes 5% of gross rental income. Varies by property age and condition. | 5% | -$440 | -$5,280 |
Capital ExpensesLarge, infrequent costs for major improvements or replacements, like a new roof, HVAC system, or appliances. Calculation:Assumes 5% of gross rental income. Varies by property age. | 5% | -$440 | -$5,280 |
HOA FeesRegular dues paid to a Homeowners Association for community maintenance, amenities, and management. Similar fees include: Condo Association Fees, Co-op Maintenance Fees, etc. | 1% | -$104 | -$1,248 |
Operating ExpensesRecurring costs required to maintain and manage a rental property, including property taxes, insurance, maintenance, repairs, utilities (if paid by the owner), property management fees, and other day-to-day expenses. Calculation:Insurance + Property Taxes + Property Management + Repairs & Maintenance + Capital Expenditures + HOA Fees | 42% | -$3,713 | -$44,557 |
Cash Flow
| Monthly | Yearly | |
|---|---|---|
Net Operating Income (NOI)The income generated from a property after deducting all operating expenses but before deducting mortgage payments, taxes, and capital expenditures. Calculation:Gross Operating Income - Operating Expenses
Net operating income:
| $4,559 | $54,708 |
Mortgage PaymentThe fixed amount a borrower pays each month to repay a loan. It typically includes principal and interest (P&I) and may also cover property taxes, insurance, HOA fees, and PMI if escrowed. | -$15,342 | -$184,104 |
Cash FlowNet Operating Income (NOI) minus mortgage payments. Calculation:NOI - Mortgage Payments | $10,783 | $129,396 |