$699,000
Investment Summary
- Monthly Cash Flow
- -$1,802
- Cap Rate
- 3.1%
- Cash-on-Cash Return
- -13.5%
- Debt Coverage Ratio
- 0.50
- Internal Rate of Return (5 years)
- -9.0%
Cash Flow
Net Operating Income (NOI) minus mortgage payments.
Calculation:
NOI - Mortgage Payments
Cap Rate (Market Value)
Capitalization Rate is a rate of return that compares the yearly Net Operating Income (NOI) to the market value.
Calculation:
NOI / Market Value
Cash-on-Cash Return (CoC)
Annual Cash Flow / Cash Invested
Calculation:
Annual cash flow divided by initial cash invested.
Debt Coverage Ratio (DCR)
Net Operating Income (NOI) divided by total debt payments.
Calculation:
NOI / Total Debt Payments
Internal Rate of Return (IRR)
A metric for assessing profitability over time. IRR is the discount rate at which the net present value (NPV) of all future cash flows (positive and negative) from an investment equals zero — including both periodic cash flow (such as rent) and a projected sale at the end of the holding period. It represents the expected annualized return, accounting for income, expenses, and the recovery of capital through a future sale.
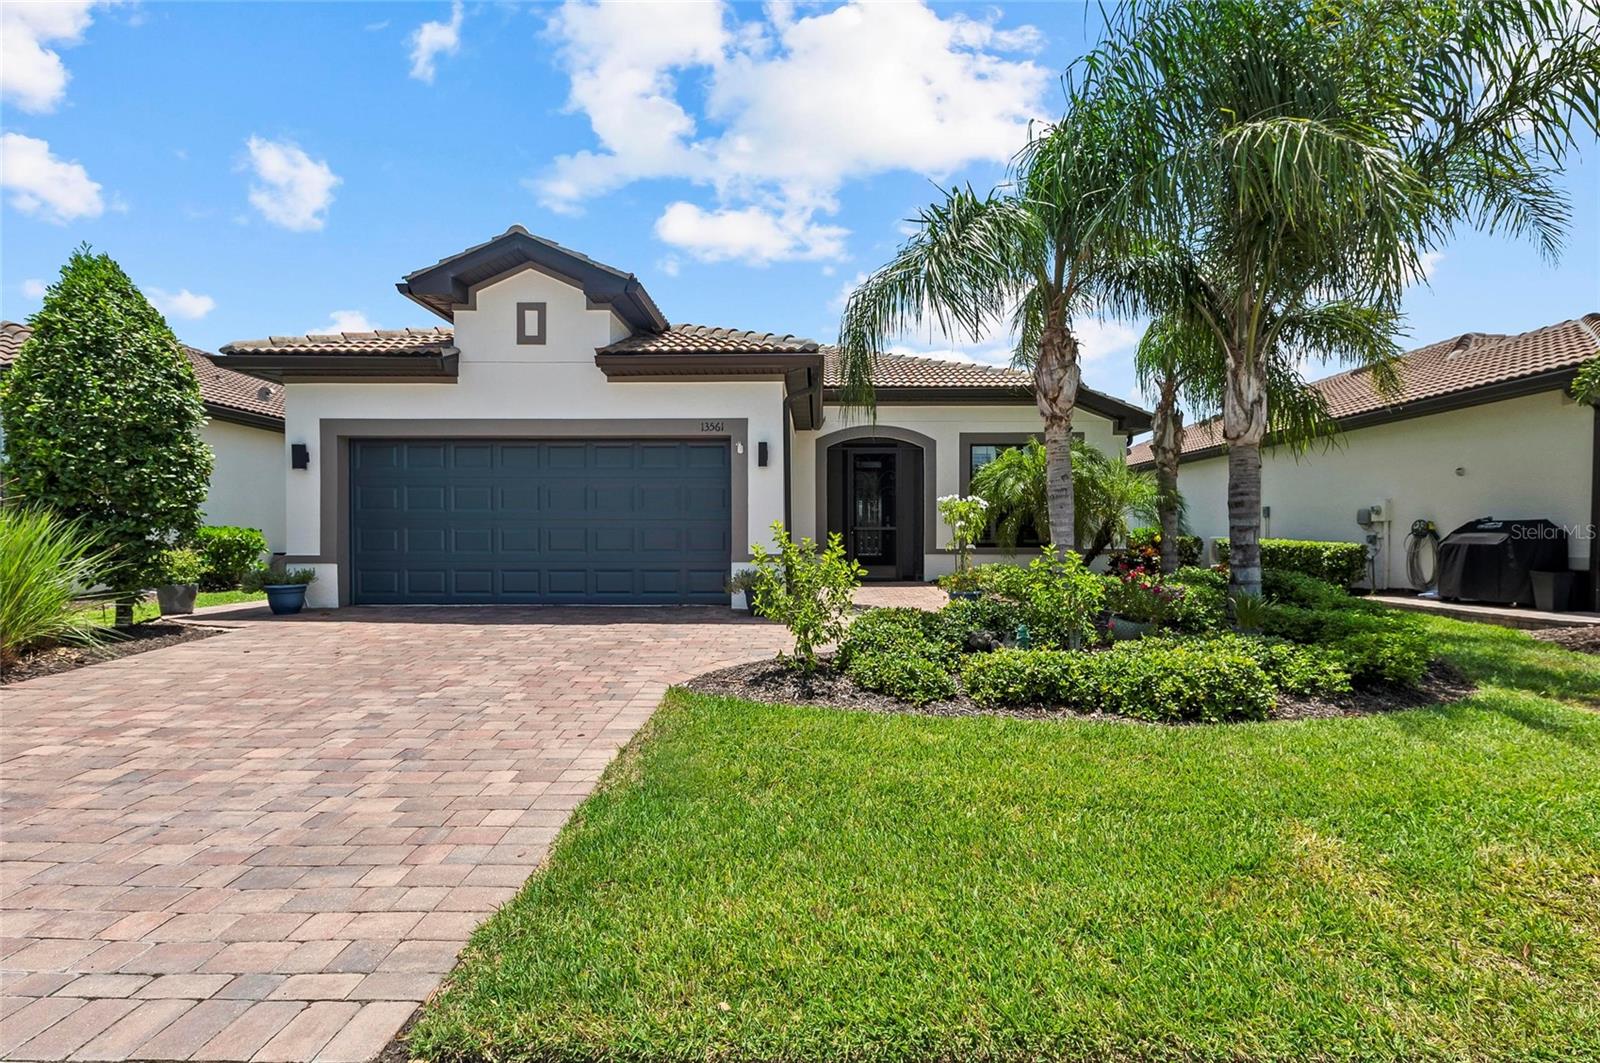
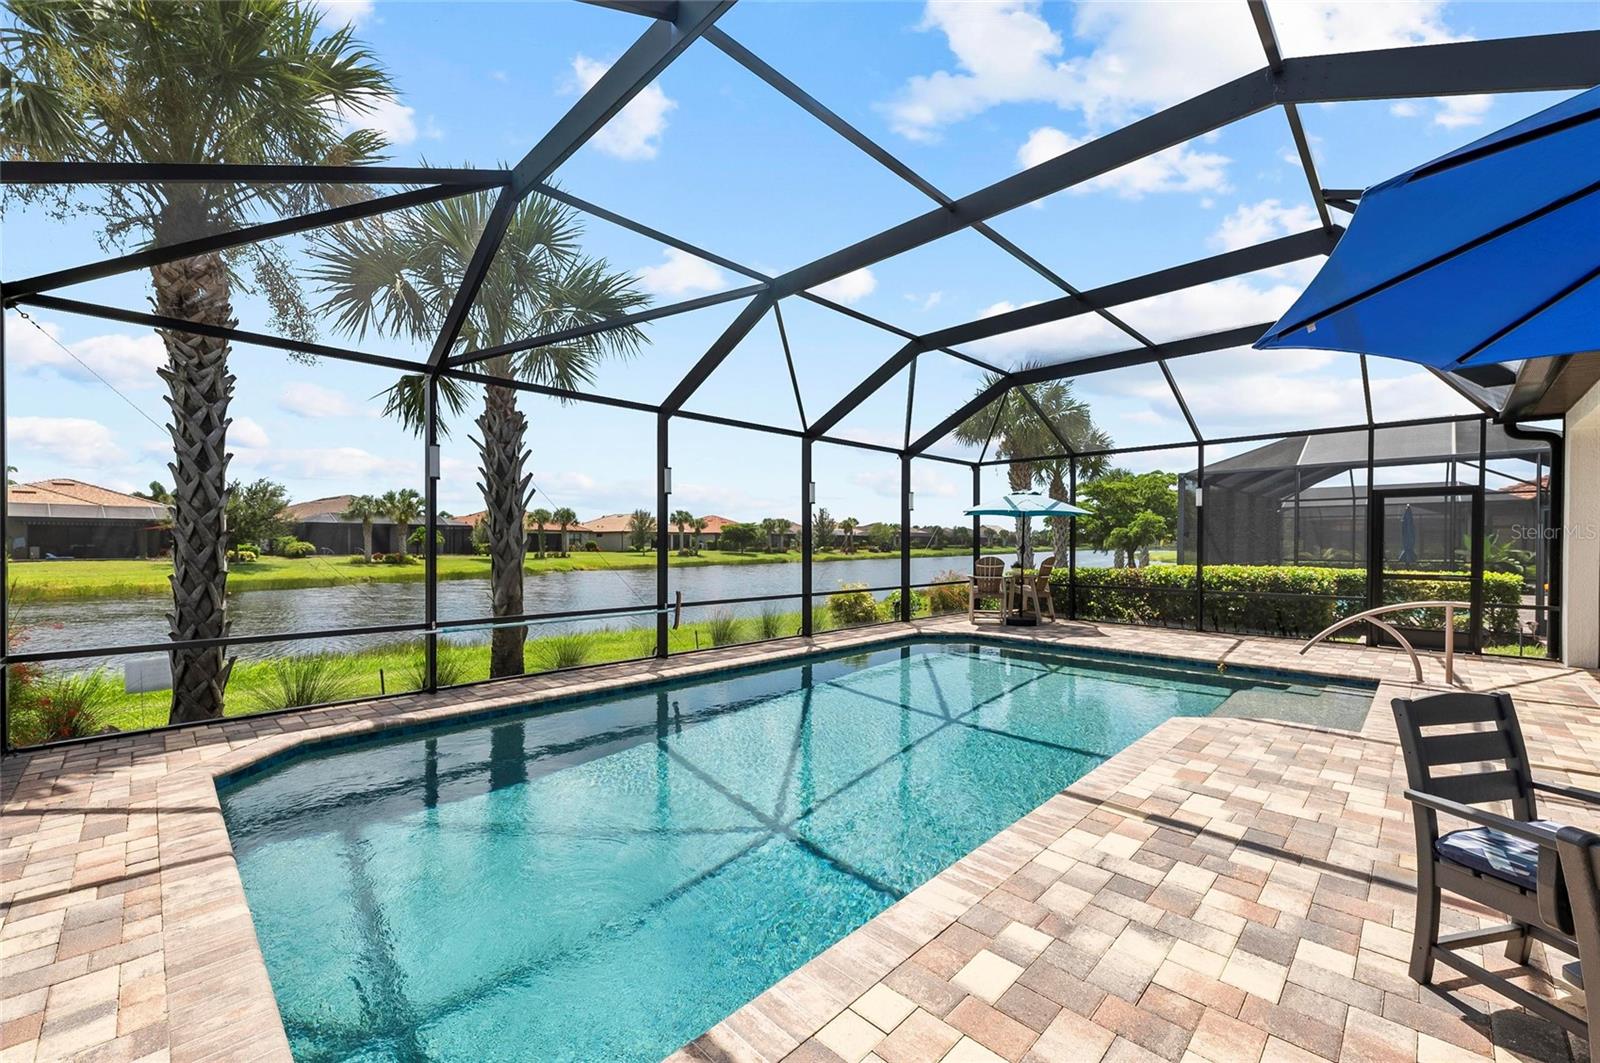
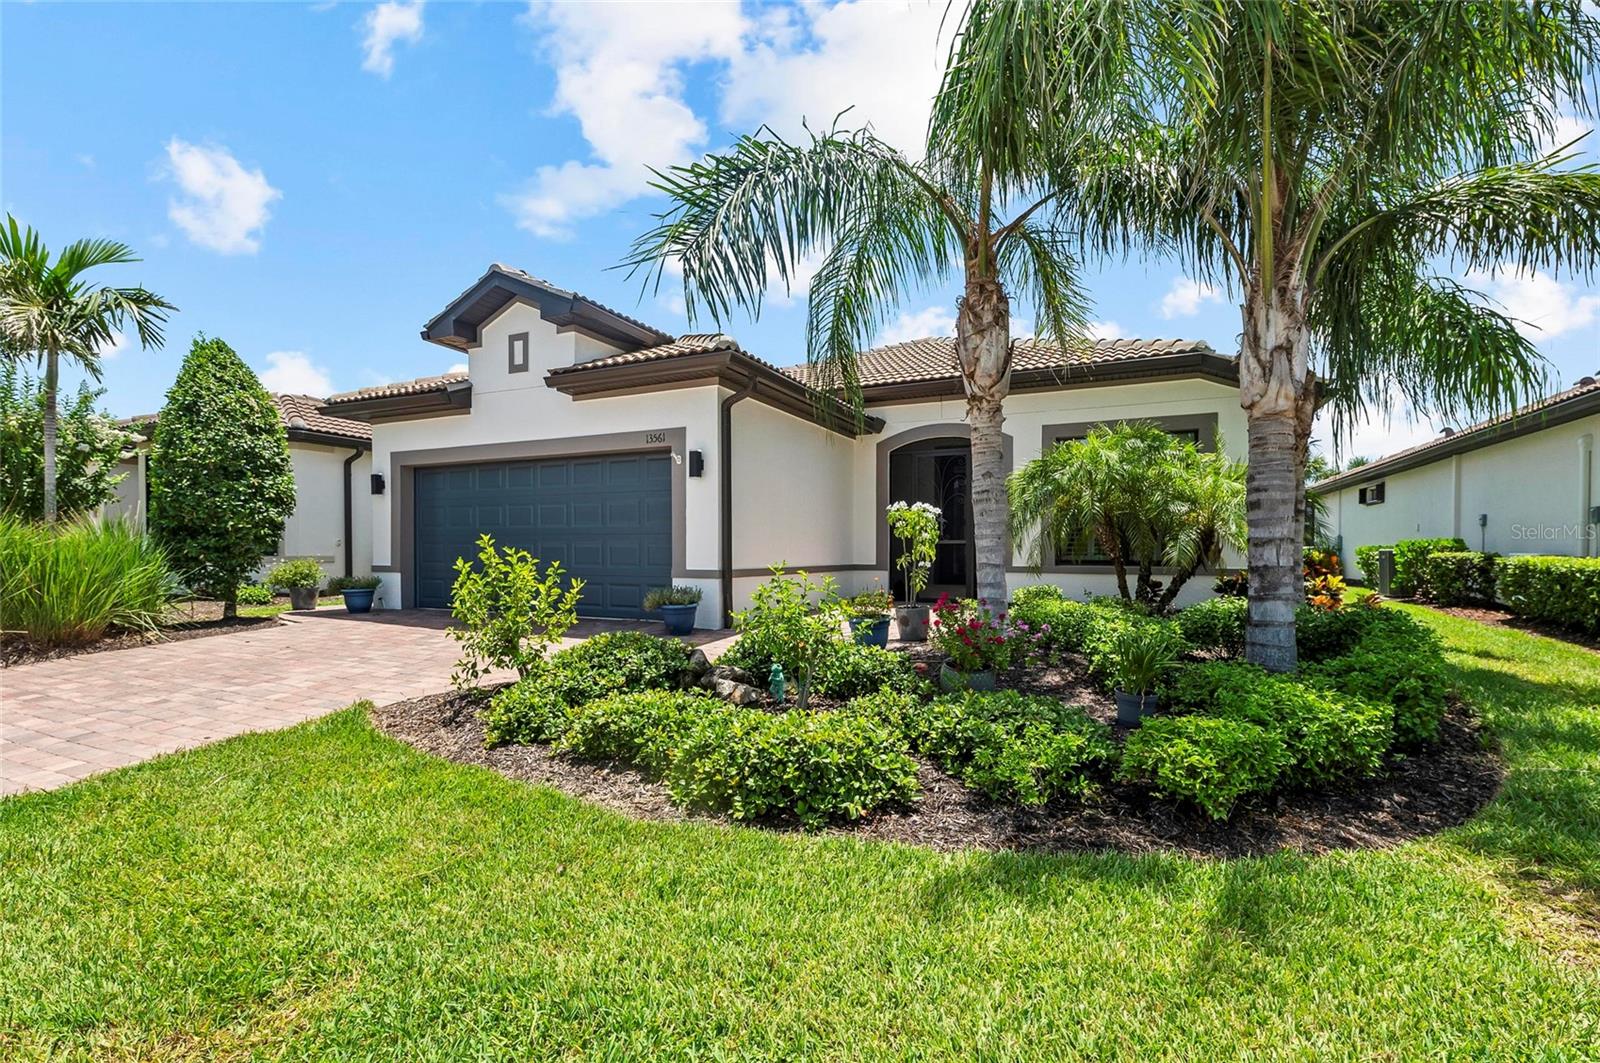
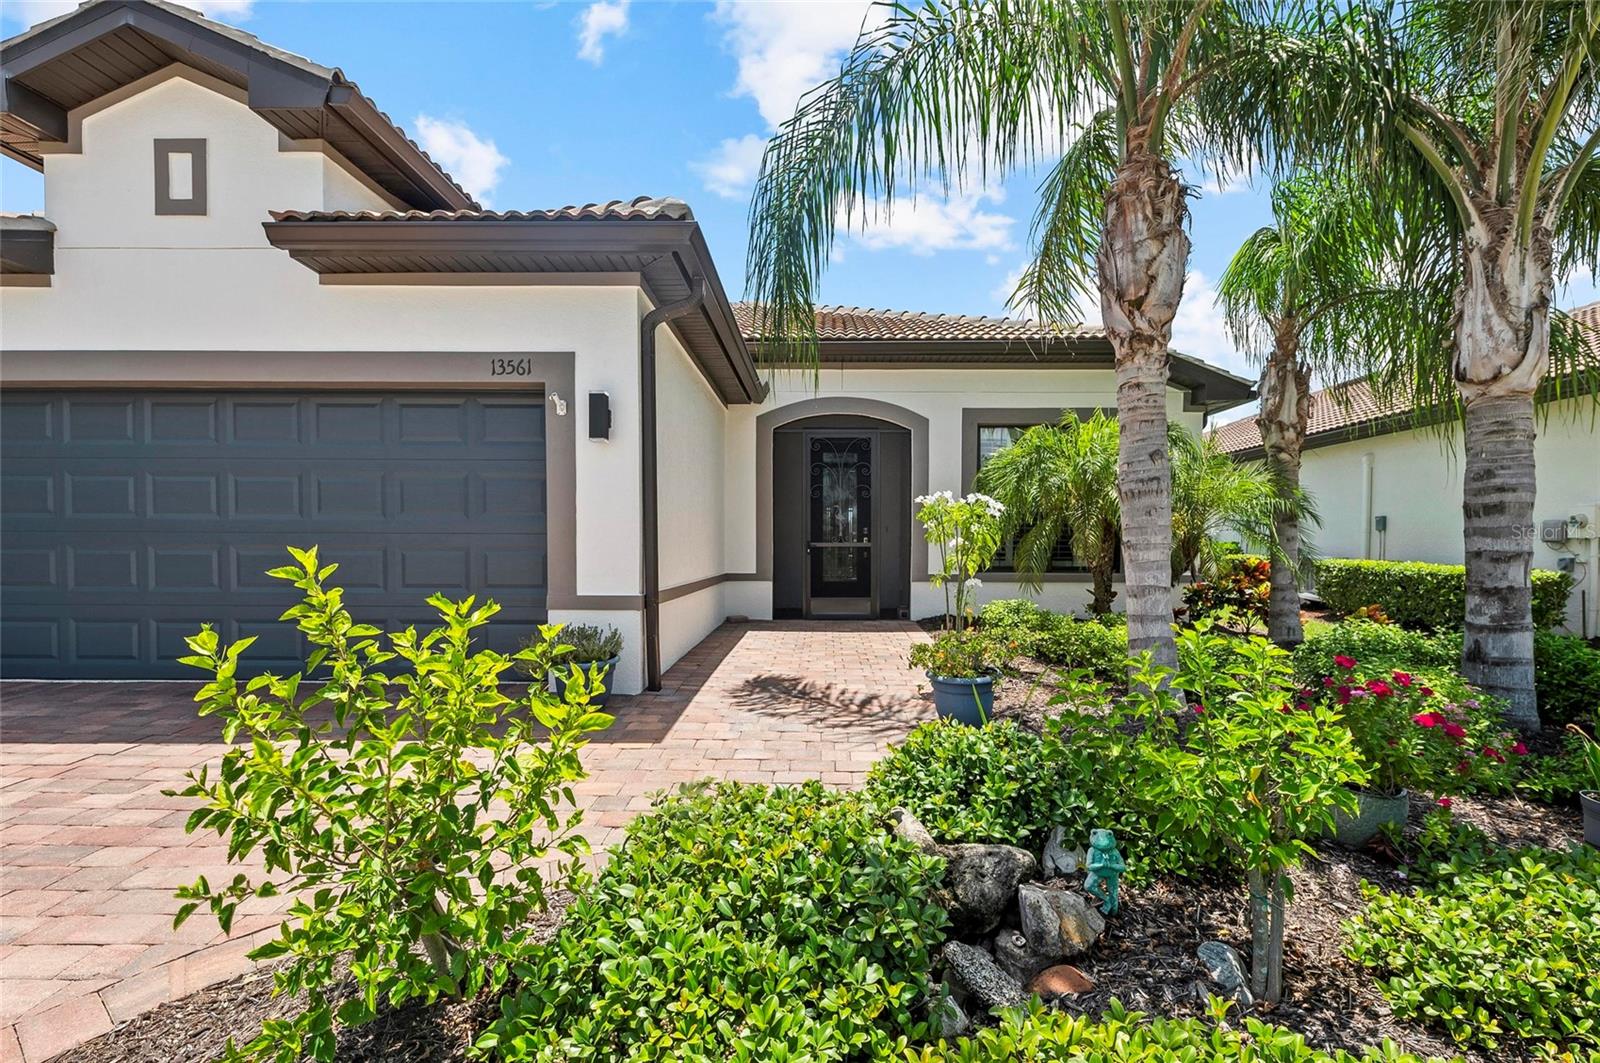
Property Description
Under contract-accepting backup offers. Stunning Martin Ray Model with Upgrades Galore & WATERFRONT Views! Welcome to this impeccably maintained and highly sought-after MARTIN RAY model, offering luxury, functionality, and style at every turn. This beautifully updated THREE BEDROOM PLUS DEN, 2-bath home is move-in ready with fresh paint (EXTERIOR JUST PAINTED), an extended paver driveway and walkway, and a screened-in front entrance that sets the tone for the elegance within. Inside, you'll find tile flooring throughout the main living areas, NEW LUXURY VINYL PLANK FLOORING in bedrooms, 8-foot doors, crown molding, higher baseboards, and upgraded woodwork in the hallway—all contributing to a polished, upscale aesthetic. The front den/office features glass French doors, perfect for working from home or relaxing in peace. The chef's kitchen is a true showstopper, complete with quartz countertops, custom backsplash, 42" upper cabinets, a butler’s pantry and stainless-steel appliances. The spacious great room opens through sliding glass pocket doors to a southern-facing lanai with SPF shades, a fully equipped OUTDOOR KITCHEN, and a HEATED SALTWATER POOL—perfect for year-round enjoyment. As you enter home from the garage- enjoy the convenience of a custom built in drop zone to hang your items! Newer IMPACT WINDOWS throughout the home provide peace of mind and energy efficiency, while plantation shutters add a timeless touch. The oversized garage boasts a 4-FOOT EXTENSION, epoxy floors, and ample storage space. The laundry room features a newer washer and dryer along with built-in cabinetry for added convenience. Retreat to the spacious primary suite showcasing serene water views, a luxurious bathroom with dual sinks, a frameless glass shower with tile inlay, and an oversized walk-in closet complete with custom built ins. This home combines elegant design, smart upgrades, and outdoor luxury—an exceptional opportunity to own one of the most desirable floor plans in the area. Don’t miss your chance to tour this gorgeous home today! IslandWalk is one of VENICE'S most social communities with a FULL TIME ACTIVITIES DIRECTOR, countless events and clubs and activities, TWO community clubhouses, an EVENT center, TWO resort style pools, a LAP pool, 12 PICKLE BALL Courts, 8 Har Tru Tennis Courts, DOG PARK, Playground, Basketball Court, Community Garden- the list goes on! The entire community is surrounded by miles and miles of golf cart trails, walking and biking trails, VENETIAN bridges and water! The Atlanta Braves Stadium is a short bike ride away- enjoy year- round events and activities. The new marketplace is now complete with PUBLIX, restaurants, shopping, gas station, etc! Downtown Wellen Park features an 80-acre lake, retail shops, restaurant waterfront dining and rooftop decks, pedestrian-friendly streets, a splash pad, a playground and a public town hall gathering place that hosts live theater and music events. Coming soon to downtown Wellen Park- a hammock grove and a permanent food truck area. IslandWalk HOA includes grounds maintenance, CABLE, WIFI, amenities, and 24-hour guard.
Build Your Team
Quickly find investor-friendly professionals who can help you succeed in real estate investing at any stage of the investing journey.


Agents
Match with investor-friendly agents who can help you find, analyze, and close your next deal


Lenders
Get the best funding…find investor-friendly lenders who specialize in your deal strategy


Property Managers
Transition to passive investing. Find a trusted property management partnership that lasts.


Tax Pros & Accountants
Taxes and financial reporting made easy—find experts to create tax savings strategies, file taxes, and more
Location
Property Details
Parking
- Description: Garage Door Opener
- Details: Oversized, Attached
- Garage Spaces: 2
- Spaces Total: 0
Bedroom Information
- # of Bedrooms: 3
Bathroom Information
- # of Baths (Full): 2
- # of Baths (Total): 2.0
Interior Features
- # of Rooms: 7
- # of Stories: 1
Exterior Features
- Exterior Walls Materials: Stucco
- Foundation: Slab
- Roof Type: Hip
- Roof Material: Tile
- Pool: Yes
- Pool Community: Yes
HOA
- Has HOA: Yes
- Association: Castle Management-Anita McGinnis
- HOA Fee: $1,133/quarterly
Land Information
- Land Use: Residential
- Land Use Subtype: Single Family Residential
Lot Information
- Parcel ID: 0803020035
- Lot Size: 7125 sqft
Property Information
- Property Type: Single Family Residence
- Year Built: 2019
Tax Information
- Annual Tax: $6,406
Utilities
- Water & Sewer: Public
- Heating: Central, Electric
- Cooling: Central Air
Location
- County: Sarasota
Listing Details
Investment Summary
- Monthly Cash Flow
- -$1,802
- Cap Rate
- 3.1%
- Cash-on-Cash Return
- -13.5%
- Debt Coverage Ratio
- 0.50
- Internal Rate of Return (5 years)
- -9.0%
Cash Flow
Net Operating Income (NOI) minus mortgage payments.
Calculation:
NOI - Mortgage Payments
Cap Rate (Market Value)
Capitalization Rate is a rate of return that compares the yearly Net Operating Income (NOI) to the market value.
Calculation:
NOI / Market Value
Cash-on-Cash Return (CoC)
Annual Cash Flow / Cash Invested
Calculation:
Annual cash flow divided by initial cash invested.
Debt Coverage Ratio (DCR)
Net Operating Income (NOI) divided by total debt payments.
Calculation:
NOI / Total Debt Payments
Internal Rate of Return (IRR)
A metric for assessing profitability over time. IRR is the discount rate at which the net present value (NPV) of all future cash flows (positive and negative) from an investment equals zero — including both periodic cash flow (such as rent) and a projected sale at the end of the holding period. It represents the expected annualized return, accounting for income, expenses, and the recovery of capital through a future sale.
Purchase Details
Purchase PriceThe price paid for the property. Purchase price:
| $699,000 |
|---|---|
Amount FinancedThe amount of the purchase financed through a loan. Amount financed:
| -$559,200 |
Down paymentThe initial payment made towards the purchase. Down payment:
| $139,800 |
Closing CostsFees and expenses associated with purchasing a property, typically ranging from 2% to 5% of the home’s purchase price, paid at the end of a home purchase to cover services like lending, title transfer, and taxes. Closing costs:
| $20,970 |
Rehab CostsCosts incurred to repair or improve the property, including: roof, flooring, exterior siding, kitchen, exterior paint, bathrooms, etc. Rehab costs:
| $0 |
Initial Cash InvestedThe total initial cash invested in the property. Calculation:Down payment + Buying costs + Rehab costs Initial cash invested:
| $160,770 |
Square Feet (SQFT)The total square footage of the property. Square feet:
| 2,108 |
Cost Per Square FootCost per square foot of the property. Calculation:Purchase Price / Square Feet Cost per square foot:
| $332 |
Monthly Rent Per Square FootMonthly rent divided by the number of square feet. This ratio helps investors compare rental income efficiency across properties, markets, and unit sizes Calculation:Monthly Rent / Square Feet Monthly rent per square foot:
| $1.85 |
Financing Details
Loan AmountThe total sum of money borrowed from a lender to finance a property purchase. Calculation:Purchase Price - Down Payment
Loan amount:
| $559,200 |
|---|---|
Loan to Value Ratio (LTV)Loan amount divided by the market value of the property. Calculation:Loan Amount / Market Value
Loan to value ratio:
| 80.0% |
Loan TypeThe type of loan (e.g., fixed, adjustable).
Loan type:
| Amortizing |
TermThe loan repayment period in years.
Term:
| 30 years |
Interest RateThe percentage a lender charges on the borrowed amount of a loan, determining the cost of borrowing money.
Interest rate:
| 6.625% |
Principal & Interest (PI)The principal is the portion of the loan payment that reduces the loan balance. The interest is the lender's charge for borrowing money. Calculation:(P * r * (1 + r) ** n) / ((1 + r) ** n - 1) Where:
P = Loan amount (principal)
Principal & interest:
| $3,581 |
Property TaxesAnnual taxes levied by local governments on real estate properties. These taxes fund public services like schools, roads, and emergency services.
Property tax:
| $534 |
InsuranceThe costs for insurance coverage to protect against financial losses due to risks like fire, natural disasters, theft, liability, or tenant-related damages. Calculation:Assumes 7% of gross rental income, unless insurance rates are specified.
Insurance:
| $273 |
Private Mortgage Insurance (PMI)A fee that borrowers pay when they take out a conventional loan with a loan-to-value (LTV) ratio above 80%.
Private mortgage insurance (PMI):
| $0 |
Monthly PaymentThe fixed amount a borrower pays each month to repay a loan. It typically includes principal and interest (P&I) and may also cover property taxes, insurance, HOA fees, and PMI if escrowed. Monthly payment:
| $4,388 |
Operating Income
| % Rent | Monthly | Yearly | |
|---|---|---|---|
Gross RentThe total rental income received from tenants before deducting any expenses. Includes base rent, late fees, pet fees, parking fees, and other recurring charges.
Gross rent:
| $3,900 | $46,800 | |
Vacancy LossExpected loss of rent due to vacancies.
Vacancy loss:
(6%)
| 6% | -$234 | -$2,808 |
Operating IncomeGross rental income minus vacancy loss. Calculation:Gross rent - Vacancy loss
Operating income:
| $3,666 | $43,992 |
Operating Expenses
| % Rent | Monthly | Yearly | |
|---|---|---|---|
Property TaxesAnnual taxes levied by local governments on real estate properties. These taxes fund public services like schools, roads, and emergency services. | 14% | -$534 | -$6,407 |
InsuranceThe costs for insurance coverage to protect against financial losses due to risks like fire, natural disasters, theft, liability, or tenant-related damages. Calculation:Assumes 7% of gross rental income, unless insurance rates are specified. | 7% | -$273 | -$3,276 |
Property ManagementThe costs associated with hiring a property manager to handle the day-to-day operations of a rental property. Includes management fees, leasing fes, eviction fees, etc. Calculation:Assumes 8% of gross rental income. | 8% | -$312 | -$3,744 |
Repairs & MaintenanceOngoing costs for routine upkeep and minor fixes needed to keep a property in good working condition. Calculation:Assumes 5% of gross rental income. Varies by property age and condition. | 5% | -$195 | -$2,340 |
Capital ExpensesLarge, infrequent costs for major improvements or replacements, like a new roof, HVAC system, or appliances. Calculation:Assumes 5% of gross rental income. Varies by property age. | 5% | -$195 | -$2,340 |
HOA FeesRegular dues paid to a Homeowners Association for community maintenance, amenities, and management. Similar fees include: Condo Association Fees, Co-op Maintenance Fees, etc. | 10% | -$378 | -$4,536 |
Operating ExpensesRecurring costs required to maintain and manage a rental property, including property taxes, insurance, maintenance, repairs, utilities (if paid by the owner), property management fees, and other day-to-day expenses. Calculation:Insurance + Property Taxes + Property Management + Repairs & Maintenance + Capital Expenditures + HOA Fees | 48% | -$1,887 | -$22,643 |
Cash Flow
| Monthly | Yearly | |
|---|---|---|
Net Operating Income (NOI)The income generated from a property after deducting all operating expenses but before deducting mortgage payments, taxes, and capital expenditures. Calculation:Gross Operating Income - Operating Expenses
Net operating income:
| $1,779 | $21,348 |
Mortgage PaymentThe fixed amount a borrower pays each month to repay a loan. It typically includes principal and interest (P&I) and may also cover property taxes, insurance, HOA fees, and PMI if escrowed. | -$3,581 | -$42,972 |
Cash FlowNet Operating Income (NOI) minus mortgage payments. Calculation:NOI - Mortgage Payments | -$1,802 | -$21,624 |