$1,799,900
Investment Summary
- Monthly Cash Flow
- -$6,729
- Cap Rate
- 1.2%
- Cash-on-Cash Return
- -19.5%
- Debt Coverage Ratio
- 0.21
- Internal Rate of Return (5 years)
- -14.8%
Cash Flow
Net Operating Income (NOI) minus mortgage payments.
Calculation:
NOI - Mortgage Payments
Cap Rate (Market Value)
Capitalization Rate is a rate of return that compares the yearly Net Operating Income (NOI) to the market value.
Calculation:
NOI / Market Value
Cash-on-Cash Return (CoC)
Annual Cash Flow / Cash Invested
Calculation:
Annual cash flow divided by initial cash invested.
Debt Coverage Ratio (DCR)
Net Operating Income (NOI) divided by total debt payments.
Calculation:
NOI / Total Debt Payments
Internal Rate of Return (IRR)
A metric for assessing profitability over time. IRR is the discount rate at which the net present value (NPV) of all future cash flows (positive and negative) from an investment equals zero — including both periodic cash flow (such as rent) and a projected sale at the end of the holding period. It represents the expected annualized return, accounting for income, expenses, and the recovery of capital through a future sale.
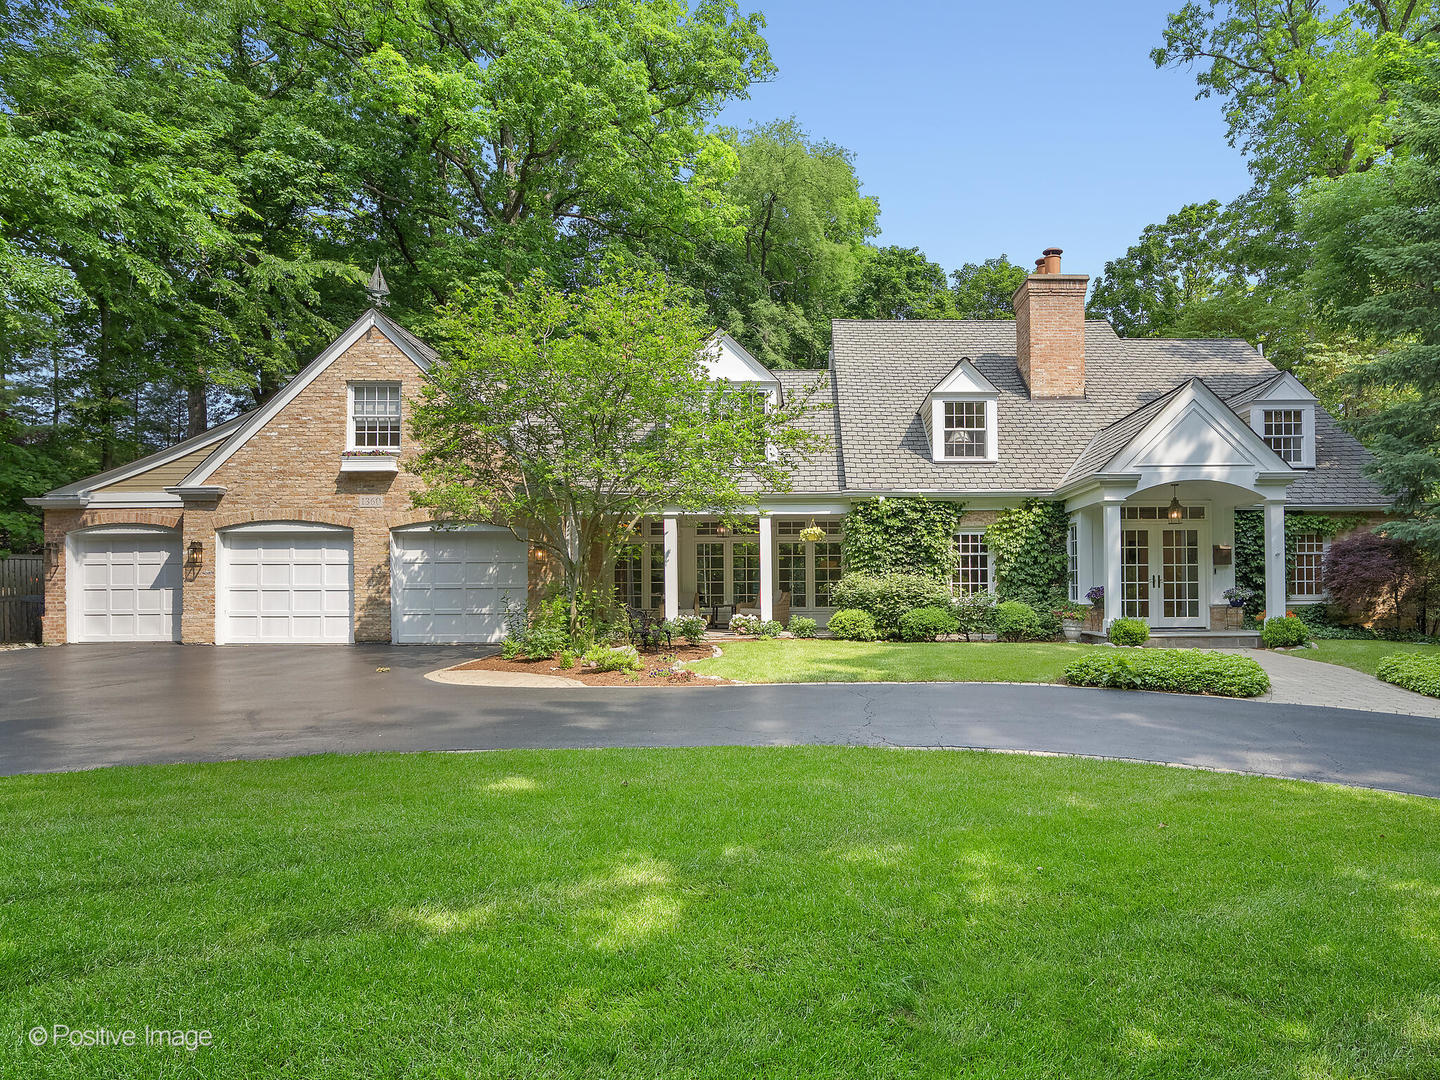
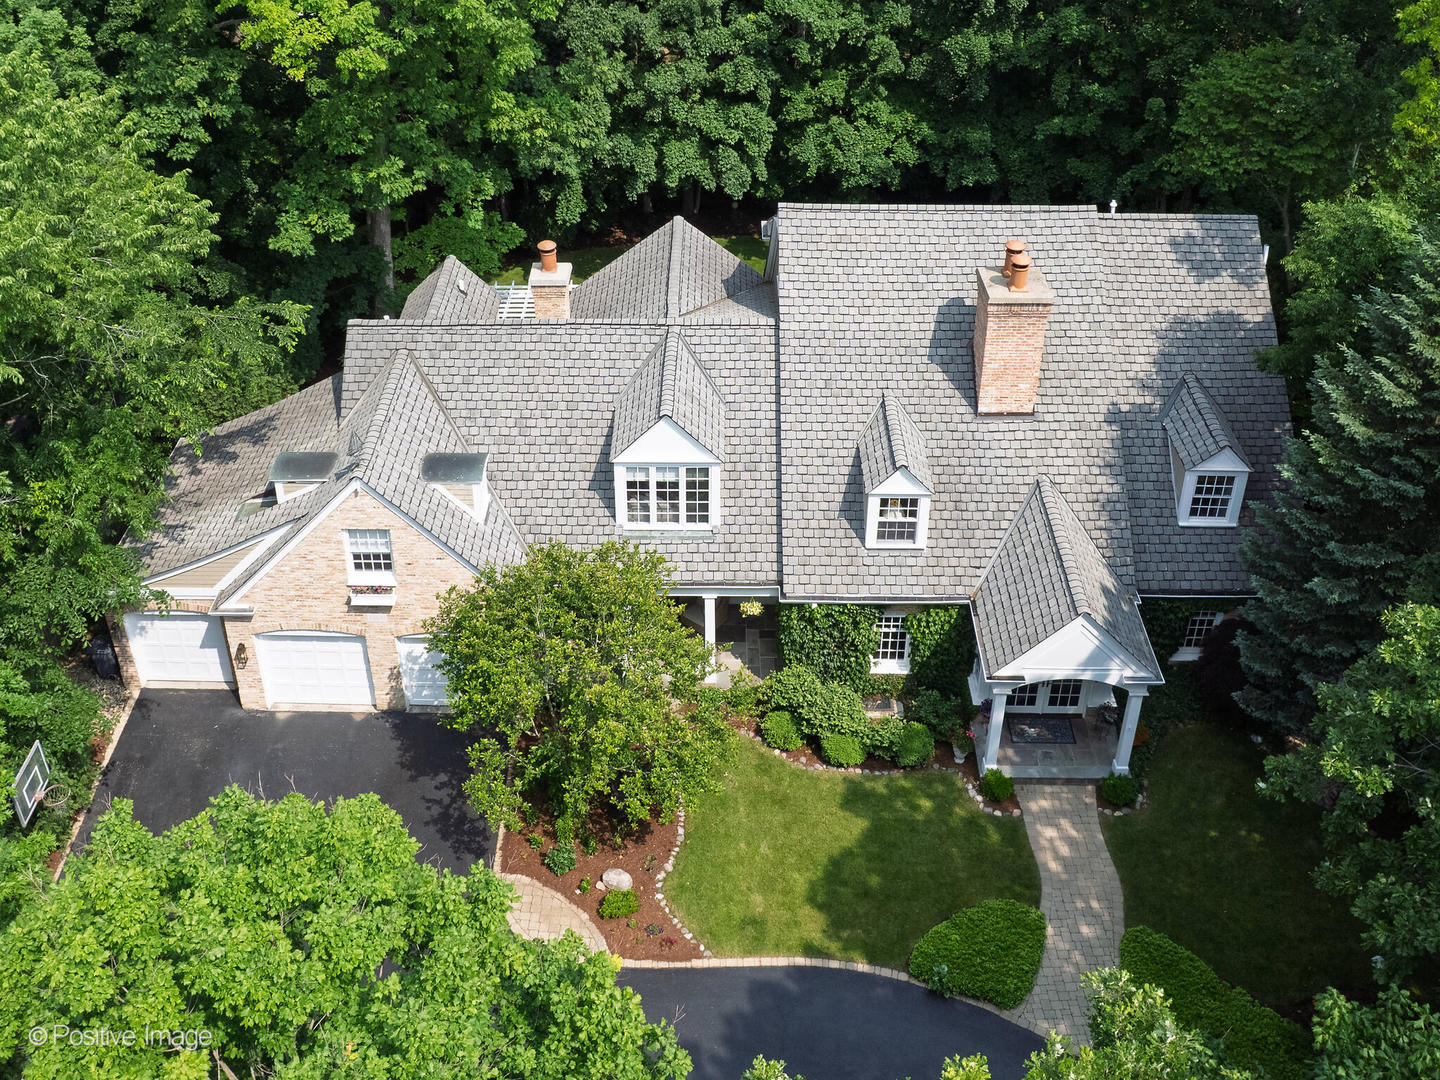
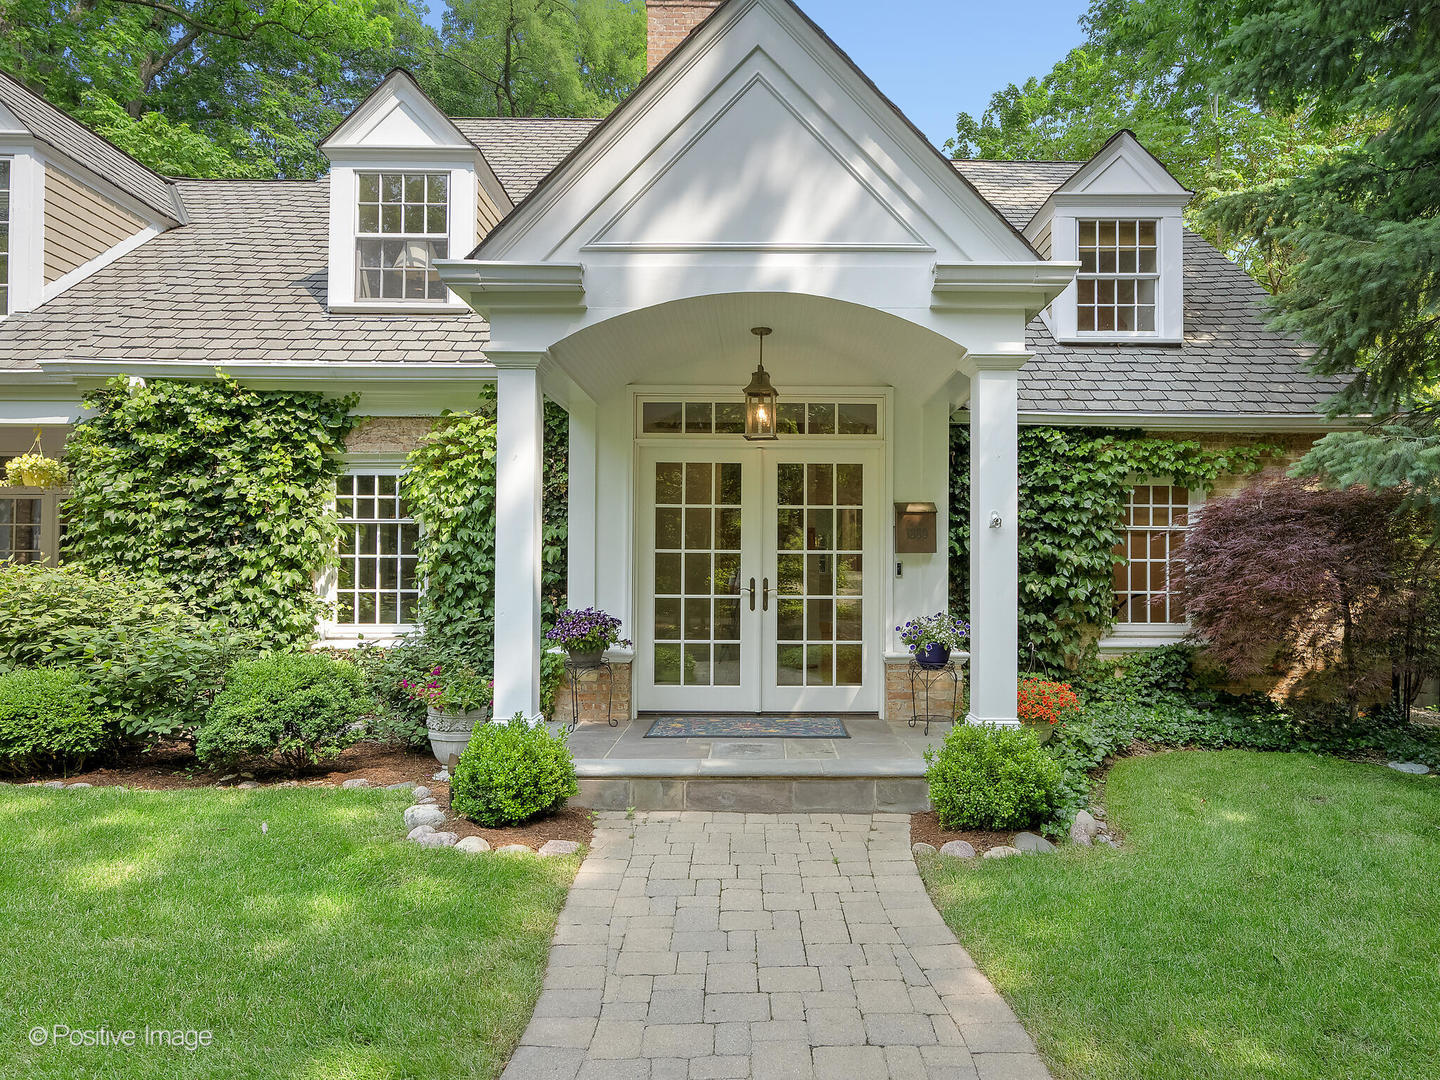
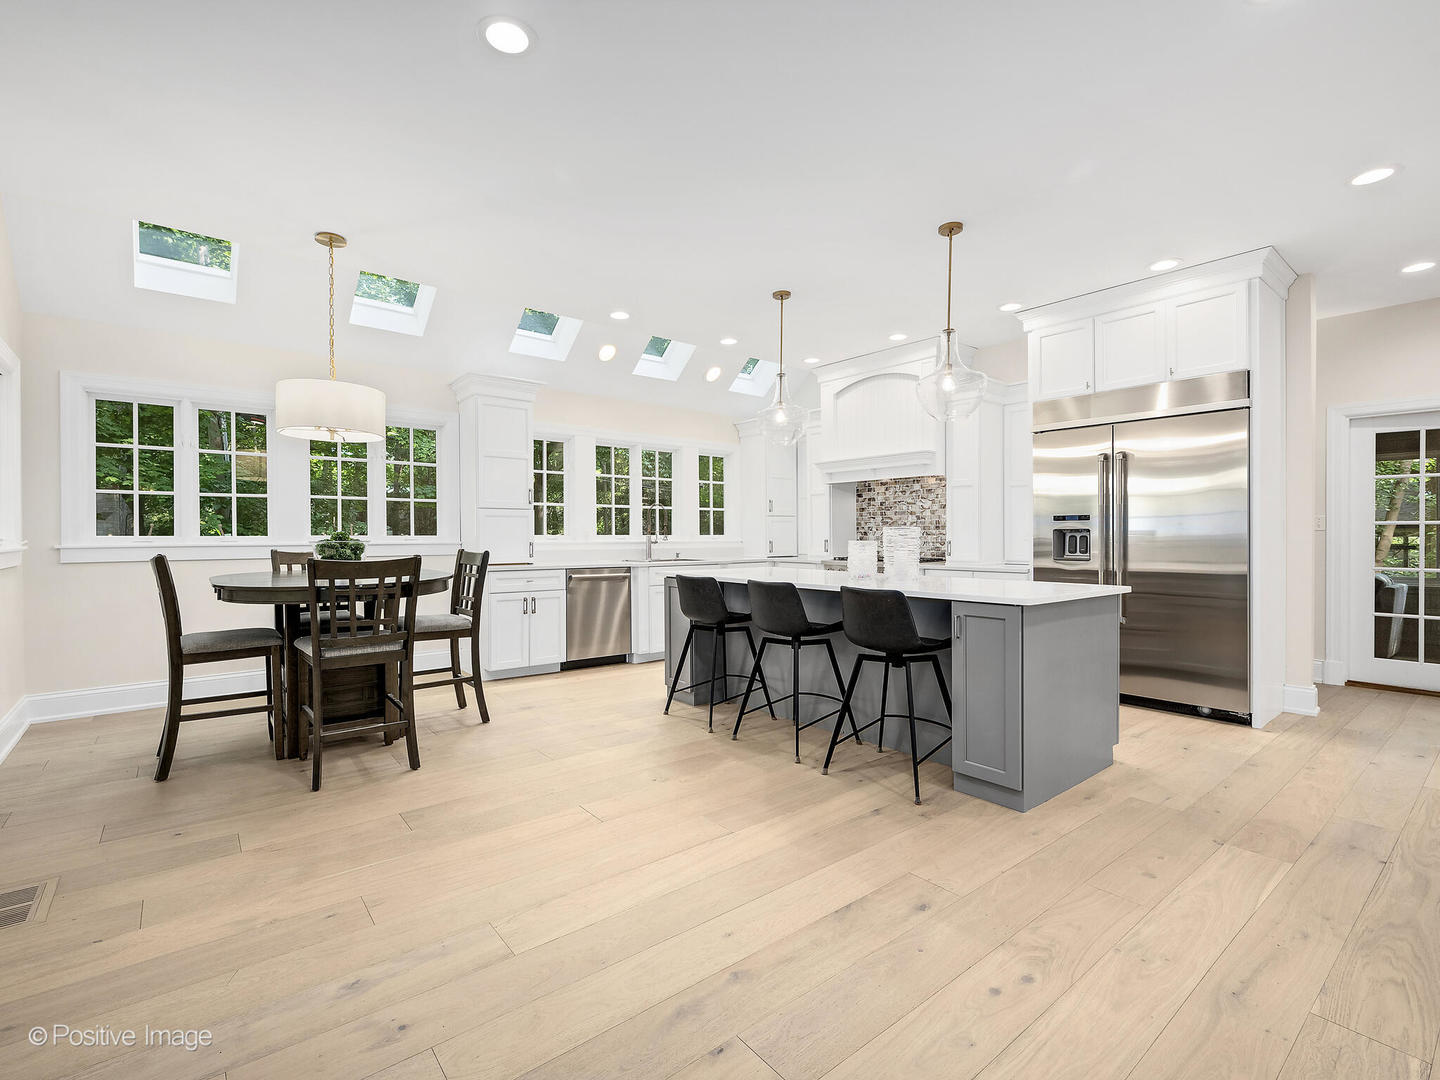
Property Description
Renovated & Reimagined by a premier Luxury Downers Grove Builder- This is what Dream Homes are made of and within steps to Downtown Downers Grove situated on an ideal .35 Acre (100 FT wide) lot in the coveted Denburn Woods Neighborhood. Remarkable in every way this property is truly a one-of-a-kind opportunity. 4 LEVELS of living with OVER 5,000 SF of total living space. List of features is extensive and includes: New 8inch wide plank flooring throughout the entire first floor, newly refreshed bright kitchen cabinetry, new light fixtures, extensive professional landscaping including entire yard newly sodded & new lawn irrigation sprinkler system, professionally painted, new house generator, new furnace, new carpeting, refinished hardwood floors on the second floor, new fireplace insert, new fireplace mantels & surrounds, new fenced back yard, and so much more!!! High quality home with incredible open layout with wall to wall windows/doors, high quality Grand Manor roof, vaulted ceilings with skylights, and SEVERAL walkout patio areas with tree lined VIEWS in every direction...this is resort style living within the Heart of Downtown Downers Grove. First floor includes bright entryway open to the living room with newly remodeled fireplace, dining room with drybar and beverage refrigerator, first floor office with walkout to the three season's sun room with new wide plank flooring throughout, open kitchen with newly refinished cabinetry with breakfast bar island seating, quartz countertops, high end kitchen appliances, kitchen eating area open to the spacious & captivating family room with 3 Sets of glass patio doors showcasing the backyard and wall-to-wall windows, family room newly remodeled fireplace, first floor laundry/mud room off the three car garage with newer washer/dryer, custom built-ins and sink, powder bathroom, and walkout access to both the front blue stone patio and the back yard paver patio with pergola. Second floor features the Primary Suite with sitting area, sleeping area, 3 walk-in closets including flex/office room, private ensuite bathroom with large tub, shower, and double faucet vanity. Second floor includes seating/reading area, 3 additional spacious bedrooms with newer carpet, hallway updated full bathroom with double sink vanity with private shower area, and 4th bedroom includes a private ensuite full bathroom with bathtub. Third floor loft can be used as a 5th bedroom or flex room. Finished basement includes a fitness room with mirrored wall, recreation room with new LVP flooring, half bathroom, and ample storage. Stunning private yard with oversized patio, pergola, and resort style living views. Denburn Woods is an incredible community. Not only are there serene walking paths with streams and adjacent to Gilbert Park, but it is also within 3 BLOCKS to Downtown Downers Grove and the Metra BNSF Main Street Express Train Station to Chicago. Denburn Woods neighborhood has planned events and gatherings for neighbors throughout the year- truly a wonderful community neighborhood. Award Winning Schools-Hillcrest Elementary School, Herrick Middle School, and Downers Grove North High School. Welcome Home to Downtown Downers Grove Living.
Build Your Team
Quickly find investor-friendly professionals who can help you succeed in real estate investing at any stage of the investing journey.


Agents
Match with investor-friendly agents who can help you find, analyze, and close your next deal


Lenders
Get the best funding…find investor-friendly lenders who specialize in your deal strategy


Property Managers
Transition to passive investing. Find a trusted property management partnership that lasts.


Tax Pros & Accountants
Taxes and financial reporting made easy—find experts to create tax savings strategies, file taxes, and more
Location
Property Details
Parking
- Description: Garage
- Details: Asphalt, Garage Door Opener, On Site, Attached, Garage
- Garage Spaces: 3
- Spaces Total: 3
Bedroom Information
- # of Bedrooms: 5
Bathroom Information
- # of Baths (Full): 3
- # of Baths (Partial): 2
- # of Baths (Total): 5.0
Interior Features
- # of Rooms: 13
- Basement: Yes
- Basement Description: Sump Pump, Finished, Storage Space, Partial
- Fireplace: Yes
Exterior Features
- Roof Material: Asphalt
Land Information
- Land Use: Residential
- Land Use Subtype: Single Family Residential
Lot Information
- Parcel ID: 0907403012
- Lot Size: 0 sqft
Property Information
- Property Type: Single Family Residence
Tax Information
- Annual Tax: $24,073
Utilities
- Water & Sewer: Public
- Heating: Natural Gas, Forced Air, Zoned
- Cooling: Central Air, Zoned
Location
- County: Du Page
Listing Details
Investment Summary
- Monthly Cash Flow
- -$6,729
- Cap Rate
- 1.2%
- Cash-on-Cash Return
- -19.5%
- Debt Coverage Ratio
- 0.21
- Internal Rate of Return (5 years)
- -14.8%
Cash Flow
Net Operating Income (NOI) minus mortgage payments.
Calculation:
NOI - Mortgage Payments
Cap Rate (Market Value)
Capitalization Rate is a rate of return that compares the yearly Net Operating Income (NOI) to the market value.
Calculation:
NOI / Market Value
Cash-on-Cash Return (CoC)
Annual Cash Flow / Cash Invested
Calculation:
Annual cash flow divided by initial cash invested.
Debt Coverage Ratio (DCR)
Net Operating Income (NOI) divided by total debt payments.
Calculation:
NOI / Total Debt Payments
Internal Rate of Return (IRR)
A metric for assessing profitability over time. IRR is the discount rate at which the net present value (NPV) of all future cash flows (positive and negative) from an investment equals zero — including both periodic cash flow (such as rent) and a projected sale at the end of the holding period. It represents the expected annualized return, accounting for income, expenses, and the recovery of capital through a future sale.
Purchase Details
Purchase PriceThe price paid for the property. Purchase price:
| $1,799,900 |
|---|---|
Amount FinancedThe amount of the purchase financed through a loan. Amount financed:
| -$1,439,920 |
Down paymentThe initial payment made towards the purchase. Down payment:
| $359,980 |
Closing CostsFees and expenses associated with purchasing a property, typically ranging from 2% to 5% of the home’s purchase price, paid at the end of a home purchase to cover services like lending, title transfer, and taxes. Closing costs:
| $53,997 |
Rehab CostsCosts incurred to repair or improve the property, including: roof, flooring, exterior siding, kitchen, exterior paint, bathrooms, etc. Rehab costs:
| $0 |
Initial Cash InvestedThe total initial cash invested in the property. Calculation:Down payment + Buying costs + Rehab costs Initial cash invested:
| $413,977 |
Square Feet (SQFT)The total square footage of the property. Square feet:
| 5,002 |
Cost Per Square FootCost per square foot of the property. Calculation:Purchase Price / Square Feet Cost per square foot:
| $360 |
Monthly Rent Per Square FootMonthly rent divided by the number of square feet. This ratio helps investors compare rental income efficiency across properties, markets, and unit sizes Calculation:Monthly Rent / Square Feet Monthly rent per square foot:
| $1.10 |
Financing Details
Loan AmountThe total sum of money borrowed from a lender to finance a property purchase. Calculation:Purchase Price - Down Payment
Loan amount:
| $1,439,920 |
|---|---|
Loan to Value Ratio (LTV)Loan amount divided by the market value of the property. Calculation:Loan Amount / Market Value
Loan to value ratio:
| 80.0% |
Loan TypeThe type of loan (e.g., fixed, adjustable).
Loan type:
| Amortizing |
TermThe loan repayment period in years.
Term:
| 30 years |
Interest RateThe percentage a lender charges on the borrowed amount of a loan, determining the cost of borrowing money.
Interest rate:
| 5.875% |
Principal & Interest (PI)The principal is the portion of the loan payment that reduces the loan balance. The interest is the lender's charge for borrowing money. Calculation:(P * r * (1 + r) ** n) / ((1 + r) ** n - 1) Where:
P = Loan amount (principal)
Principal & interest:
| $8,518 |
Property TaxesAnnual taxes levied by local governments on real estate properties. These taxes fund public services like schools, roads, and emergency services.
Property tax:
| $2,006 |
InsuranceThe costs for insurance coverage to protect against financial losses due to risks like fire, natural disasters, theft, liability, or tenant-related damages. Calculation:Assumes 7% of gross rental income, unless insurance rates are specified.
Insurance:
| $385 |
Private Mortgage Insurance (PMI)A fee that borrowers pay when they take out a conventional loan with a loan-to-value (LTV) ratio above 80%.
Private mortgage insurance (PMI):
| $0 |
Monthly PaymentThe fixed amount a borrower pays each month to repay a loan. It typically includes principal and interest (P&I) and may also cover property taxes, insurance, HOA fees, and PMI if escrowed. Monthly payment:
| $10,909 |
Operating Income
| % Rent | Monthly | Yearly | |
|---|---|---|---|
Gross RentThe total rental income received from tenants before deducting any expenses. Includes base rent, late fees, pet fees, parking fees, and other recurring charges.
Gross rent:
| $5,500 | $66,000 | |
Vacancy LossExpected loss of rent due to vacancies.
Vacancy loss:
(6%)
| 6% | -$330 | -$3,960 |
Operating IncomeGross rental income minus vacancy loss. Calculation:Gross rent - Vacancy loss
Operating income:
| $5,170 | $62,040 |
Operating Expenses
| % Rent | Monthly | Yearly | |
|---|---|---|---|
Property TaxesAnnual taxes levied by local governments on real estate properties. These taxes fund public services like schools, roads, and emergency services. | 36% | -$2,006 | -$24,073 |
InsuranceThe costs for insurance coverage to protect against financial losses due to risks like fire, natural disasters, theft, liability, or tenant-related damages. Calculation:Assumes 7% of gross rental income, unless insurance rates are specified. | 7% | -$385 | -$4,620 |
Property ManagementThe costs associated with hiring a property manager to handle the day-to-day operations of a rental property. Includes management fees, leasing fes, eviction fees, etc. Calculation:Assumes 8% of gross rental income. | 8% | -$440 | -$5,280 |
Repairs & MaintenanceOngoing costs for routine upkeep and minor fixes needed to keep a property in good working condition. Calculation:Assumes 5% of gross rental income. Varies by property age and condition. | 5% | -$275 | -$3,300 |
Capital ExpensesLarge, infrequent costs for major improvements or replacements, like a new roof, HVAC system, or appliances. Calculation:Assumes 5% of gross rental income. Varies by property age. | 5% | -$275 | -$3,300 |
HOA FeesRegular dues paid to a Homeowners Association for community maintenance, amenities, and management. Similar fees include: Condo Association Fees, Co-op Maintenance Fees, etc. | n/a | n/a | n/a |
Operating ExpensesRecurring costs required to maintain and manage a rental property, including property taxes, insurance, maintenance, repairs, utilities (if paid by the owner), property management fees, and other day-to-day expenses. Calculation:Insurance + Property Taxes + Property Management + Repairs & Maintenance + Capital Expenditures + HOA Fees | 61% | -$3,381 | -$40,573 |
Cash Flow
| Monthly | Yearly | |
|---|---|---|
Net Operating Income (NOI)The income generated from a property after deducting all operating expenses but before deducting mortgage payments, taxes, and capital expenditures. Calculation:Gross Operating Income - Operating Expenses
Net operating income:
| $1,789 | $21,468 |
Mortgage PaymentThe fixed amount a borrower pays each month to repay a loan. It typically includes principal and interest (P&I) and may also cover property taxes, insurance, HOA fees, and PMI if escrowed. | -$8,518 | -$102,216 |
Cash FlowNet Operating Income (NOI) minus mortgage payments. Calculation:NOI - Mortgage Payments | $6,729 | $80,748 |