
$3,500,000
Investment Summary
We noticed that property taxes are missing—this is a standard expense and should be considered in your estimate.
- Monthly Cash Flow
- -$10,798
- Cap Rate
- 2.4%
- Cash-on-Cash Return
- -16.1%
- Debt Coverage Ratio
- 0.39
- Internal Rate of Return (5 years)
- -11.6%
Cash Flow
Net Operating Income (NOI) minus mortgage payments.
Calculation:
NOI - Mortgage Payments
Cap Rate (Market Value)
Capitalization Rate is a rate of return that compares the yearly Net Operating Income (NOI) to the market value.
Calculation:
NOI / Market Value
Cash-on-Cash Return (CoC)
Annual Cash Flow / Cash Invested
Calculation:
Annual cash flow divided by initial cash invested.
Debt Coverage Ratio (DCR)
Net Operating Income (NOI) divided by total debt payments.
Calculation:
NOI / Total Debt Payments
Internal Rate of Return (IRR)
A metric for assessing profitability over time. IRR is the discount rate at which the net present value (NPV) of all future cash flows (positive and negative) from an investment equals zero — including both periodic cash flow (such as rent) and a projected sale at the end of the holding period. It represents the expected annualized return, accounting for income, expenses, and the recovery of capital through a future sale.
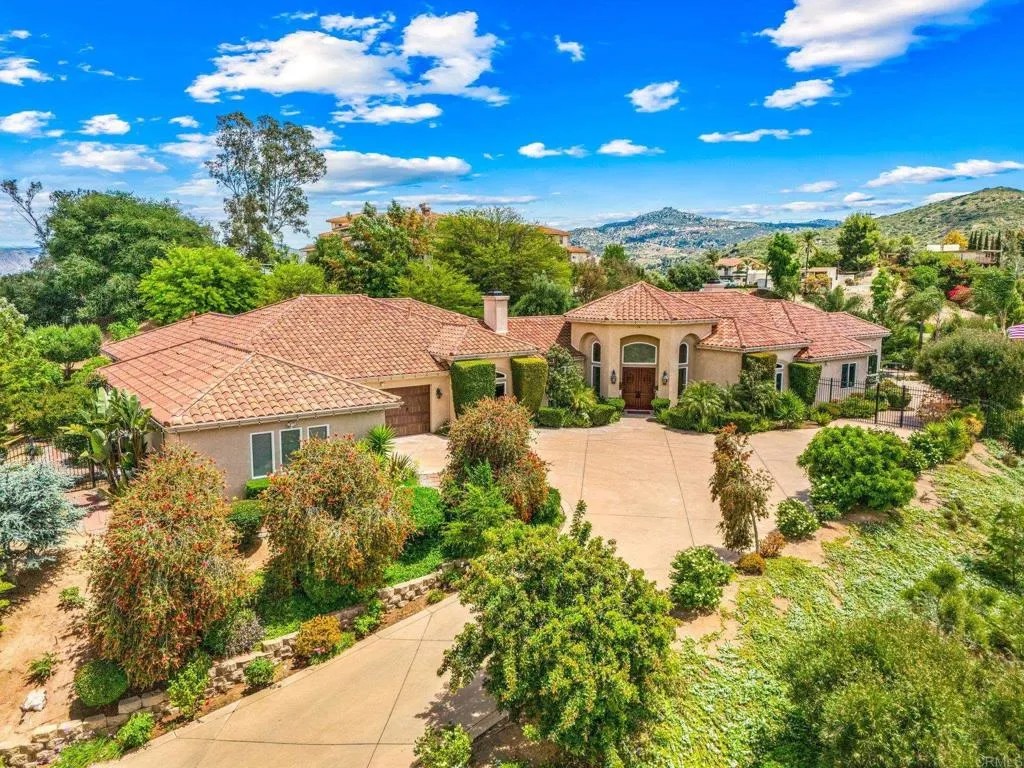
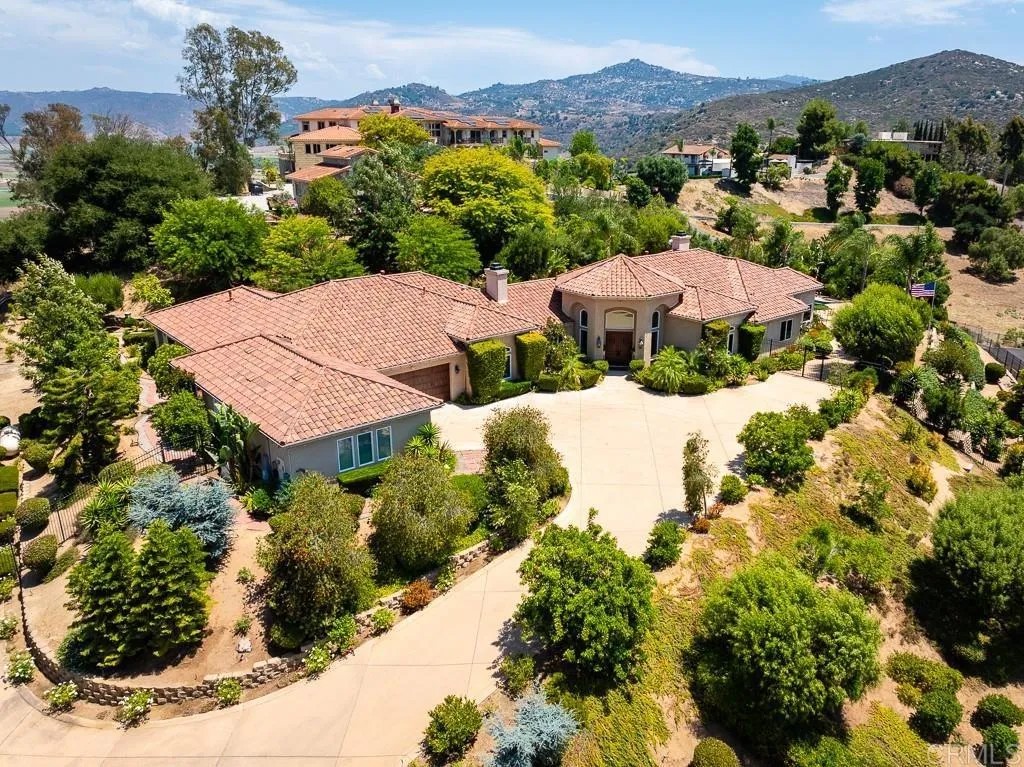
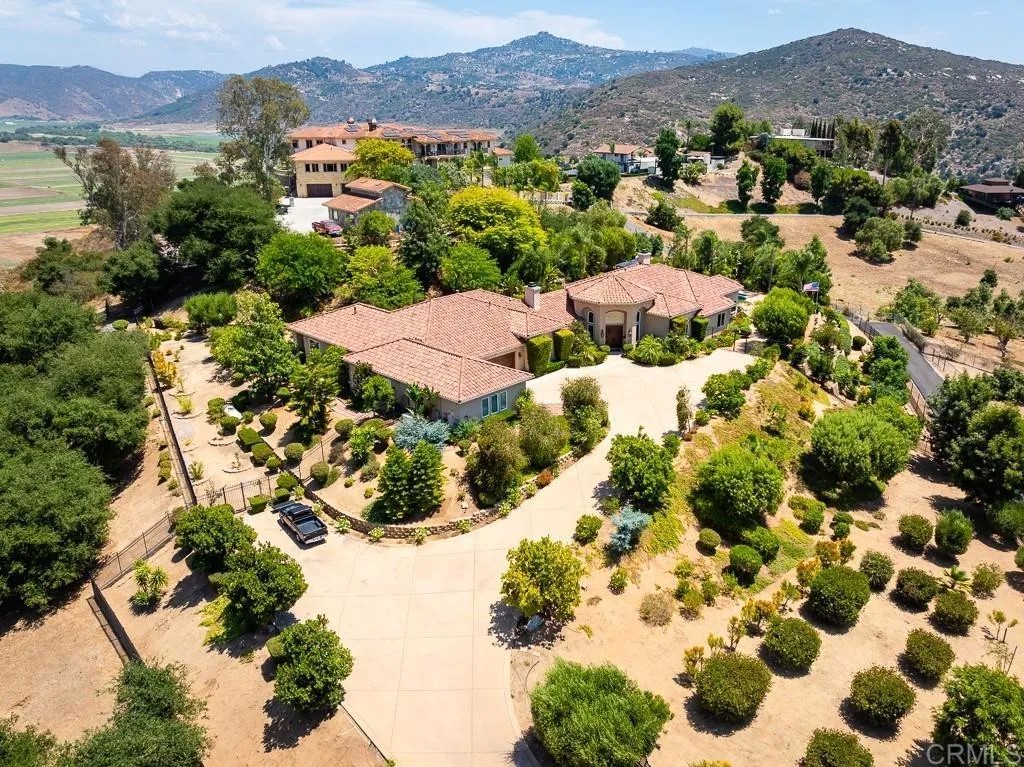
Property Description
Welcome to this 5,713 square foot private gated estate on over 30 acres overlooking the San Pasqual Valley. This custom-built single-story home boast five bedrooms, four full bathrooms, two half baths, two extra rooms which can be used as offices or game rooms, formal living room, formal dining room, a grand entry with 14-foot ceilings, family room, kitchen, breakfast nook, and a chilled wine closet. The chefs kitchen is equipped with an eight-burner dual fuel stove, 48-inch wide custom exhaust hood, two dishwashers, side-by-side 72-inch wide built-in refrigerator and freezer, an island with sink and garbage disposal and seating for four, butler pantry, built-in microwave, warming drawer, and separate walk-in pantry. Built-in stereo inside and outside, central vacuum, three fireplaces, recessed lights, ceiling fans in all bedrooms and the family room and dual pane windows throughout. Clay title roof, high ceilings, crown moldings and a combination of marble and tumbled travertine floors throughout the home. The family room opens to a 600 square foot covered porch with built-in barbeque and spectacular views. The attached oversized four-car garage consists of approximately 1,295 square feet of space and features built-in cabinets and countertop with a sink and a second clothes washer. There is ample space in the garage for extra storage. Large room sizes throughout. The saltwater pool and spa feature both a propane fired 400,000 btu heater and solar heating panels by Mark Naylor. The yard around the home is fenced with custom metal fencing. The driveway has two electric gates. The gate to the driveway to the home is controlled by a keypad, clicker or a remote application from your phone. Owned 40-panel ground-mounted electric solar under Net Metering One means no electric costs. 24 KV Generac propane powered generator with automatic transfer switch provides power when SGD&E has an outage. Three separate newer Trane air-conditioning units with individual thermostats. Hauge water softener. Exterior flood lights on motion sensors turn on exterior lights as you walk around the outside of the home at night. Gutter lights wrap the complete exterior of the home. Room to add additional buildings including an ADU. No HOA dues, no Mello Roos, low property tax rate. Walking distance to the Hungry Hawk Vineyard & Winery. Convenient to the San Diego Zoo Safari Park, Route 78 and to the 15 via the Via Rancho Parkway Exit. Primary bedroom: 22 x 18. Primary bedroom library: 13 x 11. Primary bedroom closet: 12 x 11. Bedroom two: 15 x 13. Bedroom three: 15 x 13. Bedroom four: 15 x 13. Bedroom five: 24 x 16. Extra room one: 19 x 15. Extra room two: 14 x 14. Family room: 22 x 19. Living room: 19 x 18. Dining room: 16.5 x 15.5. Kitchen: 24 x 19. Breakfast nook: 13 x 11.
Build Your Team
Quickly find investor-friendly professionals who can help you succeed in real estate investing at any stage of the investing journey.


Agents
Match with investor-friendly agents who can help you find, analyze, and close your next deal


Lenders
Get the best funding…find investor-friendly lenders who specialize in your deal strategy


Property Managers
Transition to passive investing. Find a trusted property management partnership that lasts.


Tax Pros & Accountants
Taxes and financial reporting made easy—find experts to create tax savings strategies, file taxes, and more
Location
Property Details
Parking
- Description: Auto Driveway Gate, Controlled Entrance, Driveway, Concrete, Garage, Garage Door Opener, Gated, Oversized, RV Access/Parking, Workshop in Garage
- Details: Gated, Garage, Garage Door Opener
- Garage Spaces: 4
- Spaces Total: 10
Bedroom Information
- # of Bedrooms: 5
Bathroom Information
- # of Baths (Full): 4
- # of Baths (Partial): 2
- # of Baths (Total): 6.0
Interior Features
- # of Stories: 1
- Fireplace: Yes
Exterior Features
- Pool: Yes
Land Information
- Land Use: Residential
- Land Use Subtype: Single Family Residential
Lot Information
- Parcel ID: 2411004500
- Lot Size: 0 sqft
Property Information
- Property Type: Single Family Residence
- Style: Custom Built, Mediterranean/Spanish
- Year Built: 2005
Tax Information
- Annual Tax: $0
Utilities
- Heating: Fireplace(s), Forced Air, Zoned, Propane
- Cooling: Zoned, Central Air
Location
- County: San Diego
Listing Details
Investment Summary
We noticed that property taxes are missing—this is a standard expense and should be considered in your estimate.
- Monthly Cash Flow
- -$10,798
- Cap Rate
- 2.4%
- Cash-on-Cash Return
- -16.1%
- Debt Coverage Ratio
- 0.39
- Internal Rate of Return (5 years)
- -11.6%
Cash Flow
Net Operating Income (NOI) minus mortgage payments.
Calculation:
NOI - Mortgage Payments
Cap Rate (Market Value)
Capitalization Rate is a rate of return that compares the yearly Net Operating Income (NOI) to the market value.
Calculation:
NOI / Market Value
Cash-on-Cash Return (CoC)
Annual Cash Flow / Cash Invested
Calculation:
Annual cash flow divided by initial cash invested.
Debt Coverage Ratio (DCR)
Net Operating Income (NOI) divided by total debt payments.
Calculation:
NOI / Total Debt Payments
Internal Rate of Return (IRR)
A metric for assessing profitability over time. IRR is the discount rate at which the net present value (NPV) of all future cash flows (positive and negative) from an investment equals zero — including both periodic cash flow (such as rent) and a projected sale at the end of the holding period. It represents the expected annualized return, accounting for income, expenses, and the recovery of capital through a future sale.
Purchase Details
Purchase PriceThe price paid for the property. Purchase price:
| $3,500,000 |
|---|---|
Amount FinancedThe amount of the purchase financed through a loan. Amount financed:
| -$2,800,000 |
Down paymentThe initial payment made towards the purchase. Down payment:
| $700,000 |
Closing CostsFees and expenses associated with purchasing a property, typically ranging from 2% to 5% of the home’s purchase price, paid at the end of a home purchase to cover services like lending, title transfer, and taxes. Closing costs:
| $105,000 |
Rehab CostsCosts incurred to repair or improve the property, including: roof, flooring, exterior siding, kitchen, exterior paint, bathrooms, etc. Rehab costs:
| $0 |
Initial Cash InvestedThe total initial cash invested in the property. Calculation:Down payment + Buying costs + Rehab costs Initial cash invested:
| $805,000 |
Square Feet (SQFT)The total square footage of the property. Square feet:
| 5,713 |
Cost Per Square FootCost per square foot of the property. Calculation:Purchase Price / Square Feet Cost per square foot:
| $613 |
Monthly Rent Per Square FootMonthly rent divided by the number of square feet. This ratio helps investors compare rental income efficiency across properties, markets, and unit sizes Calculation:Monthly Rent / Square Feet Monthly rent per square foot:
| $1.75 |
Financing Details
Loan AmountThe total sum of money borrowed from a lender to finance a property purchase. Calculation:Purchase Price - Down Payment
Loan amount:
| $2,800,000 |
|---|---|
Loan to Value Ratio (LTV)Loan amount divided by the market value of the property. Calculation:Loan Amount / Market Value
Loan to value ratio:
| 80.0% |
Loan TypeThe type of loan (e.g., fixed, adjustable).
Loan type:
| Amortizing |
TermThe loan repayment period in years.
Term:
| 30 years |
Interest RateThe percentage a lender charges on the borrowed amount of a loan, determining the cost of borrowing money.
Interest rate:
| 6.500% |
Principal & Interest (PI)The principal is the portion of the loan payment that reduces the loan balance. The interest is the lender's charge for borrowing money. Calculation:(P * r * (1 + r) ** n) / ((1 + r) ** n - 1) Where:
P = Loan amount (principal)
Principal & interest:
| $17,698 |
Property TaxesAnnual taxes levied by local governments on real estate properties. These taxes fund public services like schools, roads, and emergency services.
Property tax:
| $0 |
InsuranceThe costs for insurance coverage to protect against financial losses due to risks like fire, natural disasters, theft, liability, or tenant-related damages. Calculation:Assumes 7% of gross rental income, unless insurance rates are specified.
Insurance:
| $700 |
Private Mortgage Insurance (PMI)A fee that borrowers pay when they take out a conventional loan with a loan-to-value (LTV) ratio above 80%.
Private mortgage insurance (PMI):
| $0 |
Monthly PaymentThe fixed amount a borrower pays each month to repay a loan. It typically includes principal and interest (P&I) and may also cover property taxes, insurance, HOA fees, and PMI if escrowed. Monthly payment:
| $18,398 |
Operating Income
| % Rent | Monthly | Yearly | |
|---|---|---|---|
Gross RentThe total rental income received from tenants before deducting any expenses. Includes base rent, late fees, pet fees, parking fees, and other recurring charges.
Gross rent:
| $10,000 | $120,000 | |
Vacancy LossExpected loss of rent due to vacancies.
Vacancy loss:
(6%)
| 6% | -$600 | -$7,200 |
Operating IncomeGross rental income minus vacancy loss. Calculation:Gross rent - Vacancy loss
Operating income:
| $9,400 | $112,800 |
Operating Expenses
| % Rent | Monthly | Yearly | |
|---|---|---|---|
Property TaxesAnnual taxes levied by local governments on real estate properties. These taxes fund public services like schools, roads, and emergency services.
We noticed that property taxes are missing—these are standard expenses and should be considered in your estimate. | n/a | n/a | n/a |
InsuranceThe costs for insurance coverage to protect against financial losses due to risks like fire, natural disasters, theft, liability, or tenant-related damages. Calculation:Assumes 7% of gross rental income, unless insurance rates are specified. | 7% | -$700 | -$8,400 |
Property ManagementThe costs associated with hiring a property manager to handle the day-to-day operations of a rental property. Includes management fees, leasing fes, eviction fees, etc. Calculation:Assumes 8% of gross rental income. | 8% | -$800 | -$9,600 |
Repairs & MaintenanceOngoing costs for routine upkeep and minor fixes needed to keep a property in good working condition. Calculation:Assumes 5% of gross rental income. Varies by property age and condition. | 5% | -$500 | -$6,000 |
Capital ExpensesLarge, infrequent costs for major improvements or replacements, like a new roof, HVAC system, or appliances. Calculation:Assumes 5% of gross rental income. Varies by property age. | 5% | -$500 | -$6,000 |
HOA FeesRegular dues paid to a Homeowners Association for community maintenance, amenities, and management. Similar fees include: Condo Association Fees, Co-op Maintenance Fees, etc. | n/a | n/a | n/a |
Operating ExpensesRecurring costs required to maintain and manage a rental property, including property taxes, insurance, maintenance, repairs, utilities (if paid by the owner), property management fees, and other day-to-day expenses. Calculation:Insurance + Property Taxes + Property Management + Repairs & Maintenance + Capital Expenditures + HOA Fees | 25% | -$2,500 | -$30,000 |
Cash Flow
| Monthly | Yearly | |
|---|---|---|
Net Operating Income (NOI)The income generated from a property after deducting all operating expenses but before deducting mortgage payments, taxes, and capital expenditures. Calculation:Gross Operating Income - Operating Expenses
Net operating income:
| $6,900 | $82,800 |
Mortgage PaymentThe fixed amount a borrower pays each month to repay a loan. It typically includes principal and interest (P&I) and may also cover property taxes, insurance, HOA fees, and PMI if escrowed. | -$17,698 | -$212,376 |
Cash FlowNet Operating Income (NOI) minus mortgage payments. Calculation:NOI - Mortgage Payments | $10,798 | $129,576 |