San Diego County Investment Properties for Sale
Browse homes for sale and investment properties in San Diego County. Refine your search by price, property type, or more.
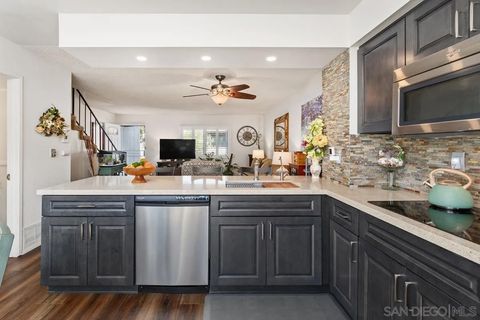
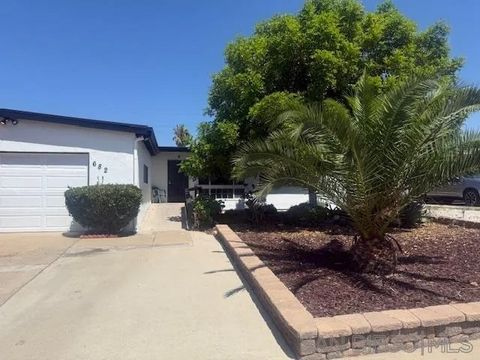
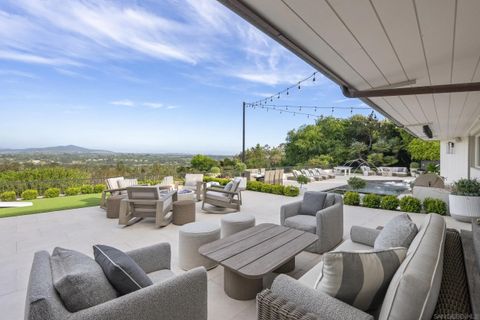
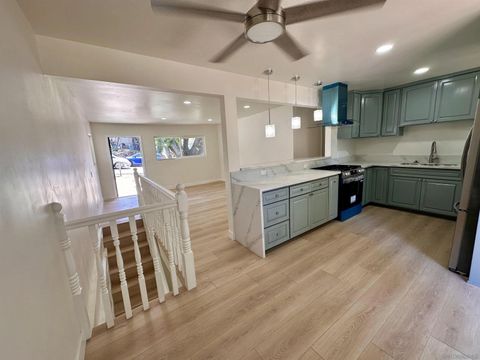
Best cash flowing properties in San Diego County
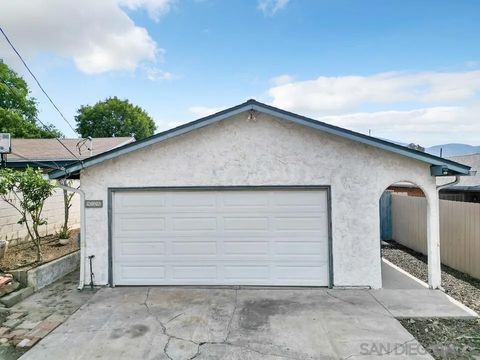
Active
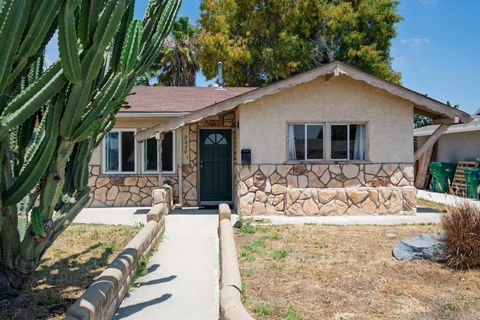
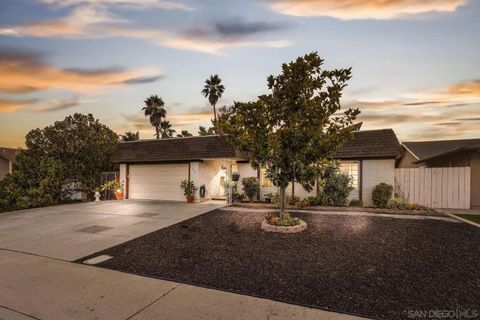
$467,500
2
bds
|
2
ba
|
1,002
sqft
|
built
1973
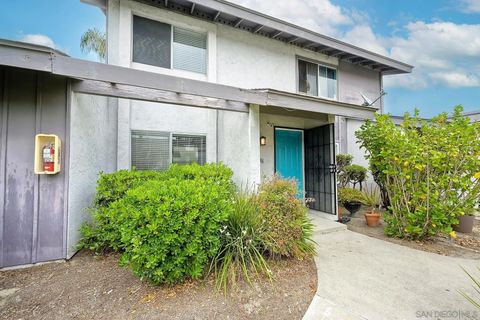
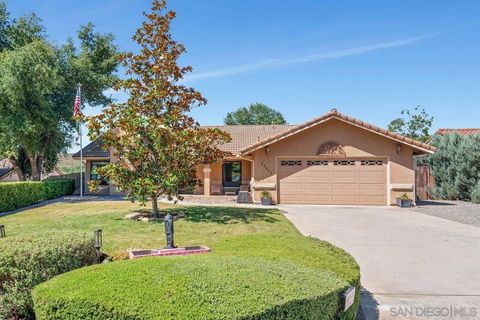
3436 Thunder Dr, Oceanside, CA 92056
$-838
Cash flow
-9.4%
Cash-on-Cash Return
3.5%
Cap rate
0.6%
Rent to Value Ratio
Active
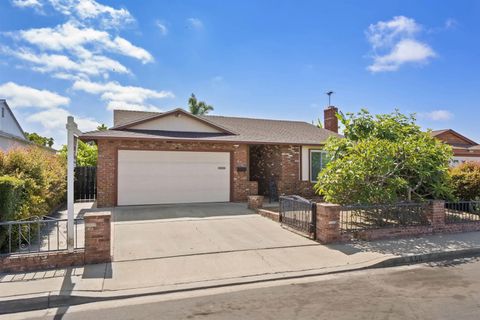
$419,900
bds
|
1
ba
|
520
sqft
|
built
1988
3790 Florida St, San Diego, CA 92104
$-945
Cash flow
-11.7%
Cash-on-Cash Return
3.4%
Cap rate
0.5%
Rent to Value Ratio
1,171 out of 2,876 properties for sale in San Diego County
Limited Results Shown
Create a free account, or log in to reveal all property listings and enjoy the complete experience.
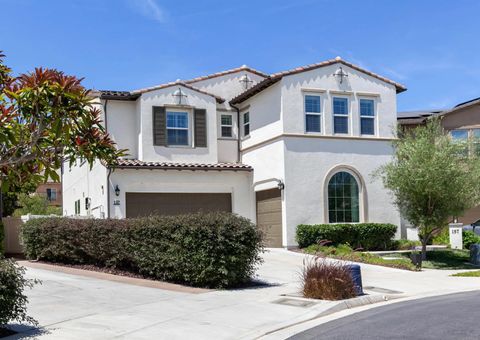
Active
$1,150,000
5
bds
|
3
ba
|
2,224
sqft
|
built
1969
1756 Alhudson Dr, Escondido, CA 92029
$-1,233
Cash flow
-5.6%
Cash-on-Cash Return
4.4%
Cap rate
0.5%
Rent to Value Ratio
Active
$3,590,000
5
bds
|
6
ba
|
4,888
sqft
|
built
2003
836 Jensen Ct, Encinitas, CA 92024
$-11,059
Cash flow
-16.1%
Cash-on-Cash Return
2.0%
Cap rate
0.3%
Rent to Value Ratio
Active
$899,000
5
bds
|
3
ba
|
2,569
sqft
|
built
1994
25657 Bellemore Dr, Ramona, CA 92065
$-1,340
Cash flow
-7.8%
Cash-on-Cash Return
4.3%
Cap rate
0.5%
Rent to Value Ratio
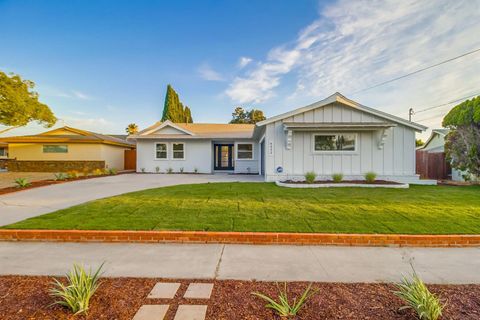
Active
$489,000
3
bds
|
1
ba
|
1,035
sqft
|
built
1974
1772 Summertime Dr, El Cajon, CA 92021
$-1,041
Cash flow
-11.1%
Cash-on-Cash Return
3.5%
Cap rate
0.6%
Rent to Value Ratio
Active
$1,588,000
5
bds
|
3
ba
|
2,792
sqft
|
built
1985
1761 Winterwarm Dr, Fallbrook, CA 92028
$-4,580
Cash flow
-15.0%
Cash-on-Cash Return
2.6%
Cap rate
0.3%
Rent to Value Ratio
Active
$949,000
3
bds
|
3
ba
|
1,452
sqft
|
built
1984
2957 Lexington Cir, Carlsbad, CA 92010
$-2,685
Cash flow
-14.8%
Cash-on-Cash Return
2.7%
Cap rate
0.4%
Rent to Value Ratio
Active
$615,900
2
bds
|
2
ba
|
1,080
sqft
|
built
1974
5800 Lake Murray Blvd, La Mesa, CA 91942
$-1,406
Cash flow
-11.9%
Cash-on-Cash Return
3.3%
Cap rate
0.5%
Rent to Value Ratio
Active
$799,000
3
bds
|
2
ba
|
1,596
sqft
|
built
1959
682 Valley Village Dr, El Cajon, CA 92021
$-1,556
Cash flow
-10.2%
Cash-on-Cash Return
3.7%
Cap rate
0.5%
Rent to Value Ratio
Active
$4,995,000
3
bds
|
3
ba
|
2,533
sqft
|
built
1955
5665 Linea Del Cielo, Rancho Santa Fe, CA 92067
$-18,357
Cash flow
-19.2%
Cash-on-Cash Return
1.7%
Cap rate
0.2%
Rent to Value Ratio
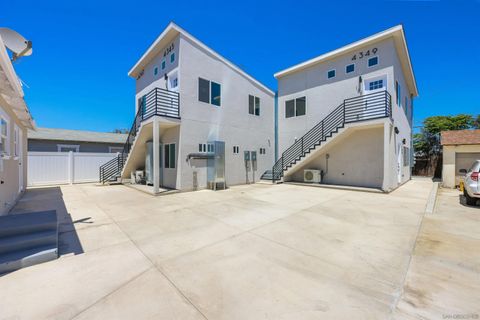
Active
$829,000
4
bds
|
3
ba
|
1,599
sqft
|
built
1960
2256 El Prado Ave, Lemon Grove, CA 91945
$-1,501
Cash flow
-9.4%
Cash-on-Cash Return
3.9%
Cap rate
0.5%
Rent to Value Ratio
Active
$759,000
3
bds
|
2
ba
|
1,597
sqft
|
built
1960
9530 Galston Dr, Santee, CA 92071
$-1,078
Cash flow
-7.4%
Cash-on-Cash Return
4.4%
Cap rate
0.5%
Rent to Value Ratio
Active
$788,000
4
bds
|
2
ba
|
1,677
sqft
|
built
1971
856 Orchid Way, San Diego, CA 92154
$-1,570
Cash flow
-10.4%
Cash-on-Cash Return
3.7%
Cap rate
0.4%
Rent to Value Ratio
Active
$2,250,000
4
bds
|
2
ba
|
2,166
sqft
|
built
1970
2105 Harbour Heights Rd, San Diego, CA 92109
$-6,409
Cash flow
-14.9%
Cash-on-Cash Return
2.6%
Cap rate
0.3%
Rent to Value Ratio
Active
$749,000
3
bds
|
2
ba
|
1,152
sqft
|
built
1950
3416 Winlow St, San Diego, CA 92105
$-1,372
Cash flow
-9.6%
Cash-on-Cash Return
3.9%
Cap rate
0.5%
Rent to Value Ratio
Active
$779,000
2
bds
|
2
ba
|
1,290
sqft
|
built
1975
2345 Mira Sol Dr, Vista, CA 92084
$-1,455
Cash flow
-9.7%
Cash-on-Cash Return
3.8%
Cap rate
0.5%
Rent to Value Ratio
Active
$950,000
4
bds
|
4
ba
|
2,080
sqft
|
built
1974
140 Rainier Ct, Chula Vista, CA 91911
$-1,630
Cash flow
-9.0%
Cash-on-Cash Return
4.0%
Cap rate
0.5%
Rent to Value Ratio
Active
$1,349,900
3
bds
|
2
ba
|
1,165
sqft
|
built
1988
6951 Quiet Cove Dr, Carlsbad, CA 92011
$-3,152
Cash flow
-12.2%
Cash-on-Cash Return
3.3%
Cap rate
0.4%
Rent to Value Ratio
Active
$4,750,000
4
bds
|
2
ba
|
2,327
sqft
|
built
1970
364 Bellaire St, Del Mar, CA 92014
$-17,809
Cash flow
-19.6%
Cash-on-Cash Return
1.6%
Cap rate
0.2%
Rent to Value Ratio
Active
$685,000
3
bds
|
2
ba
|
1,125
sqft
|
built
1980
935 Ramona Ave, Spring Valley, CA 91977
$-980
Cash flow
-7.5%
Cash-on-Cash Return
4.4%
Cap rate
0.5%
Rent to Value Ratio
Active
$1,600,000
6
bds
|
4
ba
|
3,870
sqft
|
built
2018
157 Montessa Way, San Marcos, CA 92069
$-3,503
Cash flow
-11.4%
Cash-on-Cash Return
3.4%
Cap rate
0.4%
Rent to Value Ratio
Active
$1,349,000
3
bds
|
2
ba
|
1,395
sqft
|
built
1961
6535 Mount Albertine Ct, San Diego, CA 92111
$-3,992
Cash flow
-15.4%
Cash-on-Cash Return
2.5%
Cap rate
0.3%
Rent to Value Ratio
Active
$2,500,000
3
bds
|
2
ba
|
3,492
sqft
|
built
1937
4343 Bancroft St, San Diego, CA 92104
$-10,433
Cash flow
-21.8%
Cash-on-Cash Return
1.1%
Cap rate
0.1%
Rent to Value Ratio
Active
$2,995,000
3
bds
|
2
ba
|
1,330
sqft
|
built
1948
375 E Ave, Coronado, CA 92118
$-11,625
Cash flow
-20.3%
Cash-on-Cash Return
1.4%
Cap rate
0.2%
Rent to Value Ratio
Active
$2,995,000
5
bds
|
3
ba
|
3,416
sqft
|
built
1988
15951 Avenida Calma, Rancho Santa Fe, CA 92091
$-8,252
Cash flow
-14.4%
Cash-on-Cash Return
2.8%
Cap rate
0.3%
Rent to Value Ratio
Active
$899,000
2
bds
|
3
ba
|
1,389
sqft
|
built
2007
17022 Calle Trevino, San Diego, CA 92127
$-2,162
Cash flow
-12.5%
Cash-on-Cash Return
3.2%
Cap rate
0.4%
Rent to Value Ratio
Active
$989,900
2
bds
|
2
ba
|
1,087
sqft
|
built
1981
4732 Iroquois Ave, San Diego, CA 92117
$-3,085
Cash flow
-16.3%
Cash-on-Cash Return
2.3%
Cap rate
0.4%
Rent to Value Ratio
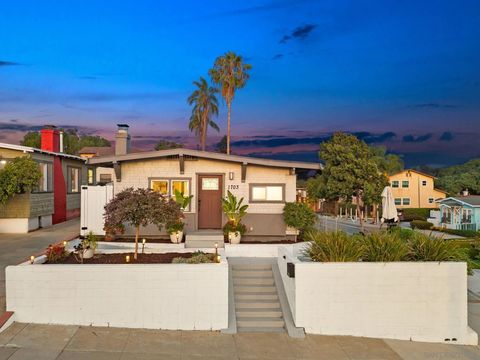
Active
$1,299,000
3
bds
|
2
ba
|
950
sqft
|
built
1914
1703 30th St, San Diego, CA 92102
$-3,463
Cash flow
-13.9%
Cash-on-Cash Return
2.9%
Cap rate
0.3%
Rent to Value Ratio
Active
$1,099,000
4
bds
|
4
ba
|
2,058
sqft
|
built
1977
1711 Alhudson Dr, Escondido, CA 92029
$-1,141
Cash flow
-5.4%
Cash-on-Cash Return
4.8%
Cap rate
0.6%
Rent to Value Ratio
Active
$785,000
3
bds
|
3
ba
|
1,076
sqft
|
built
1953
7310 Waite Dr, La Mesa, CA 91941
$-1,485
Cash flow
-9.9%
Cash-on-Cash Return
3.8%
Cap rate
0.5%
Rent to Value Ratio
Active
$1,050,000
4
bds
|
3
ba
|
2,069
sqft
|
built
2003
871 Niguel St, Oceanside, CA 92057
$-2,348
Cash flow
-11.7%
Cash-on-Cash Return
3.4%
Cap rate
0.4%
Rent to Value Ratio
Active
$799,900
3
bds
|
2
ba
|
1,196
sqft
|
built
1955
6237 Falmouth Dr, La Mesa, CA 91942
$-1,285
Cash flow
-8.4%
Cash-on-Cash Return
4.1%
Cap rate
0.5%
Rent to Value Ratio
Active
$1,150,000
3
bds
|
4
ba
|
1,806
sqft
|
built
1951
4542 Toni Ln, La Mesa, CA 91942
$-2,020
Cash flow
-9.2%
Cash-on-Cash Return
4.0%
Cap rate
0.5%
Rent to Value Ratio
Active
$999,999
5
bds
|
3
ba
|
2,462
sqft
|
built
2002
10022 Triple J Trl, Escondido, CA 92026
$-1,607
Cash flow
-8.4%
Cash-on-Cash Return
4.1%
Cap rate
0.5%
Rent to Value Ratio
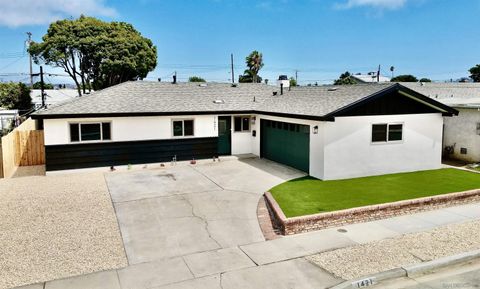
Active
$899,000
5
bds
|
2
ba
|
1,671
sqft
|
built
1961
1421 Thermal Ave, San Diego, CA 92154
$-1,855
Cash flow
-10.8%
Cash-on-Cash Return
3.6%
Cap rate
0.4%
Rent to Value Ratio
Active
$1,249,900
4
bds
|
2
ba
|
1,935
sqft
|
built
1973
14152 Kendra Way, Poway, CA 92064
$-2,456
Cash flow
-10.3%
Cash-on-Cash Return
3.7%
Cap rate
0.4%
Rent to Value Ratio
Active
$610,000
3
bds
|
3
ba
|
1,400
sqft
|
built
2005
840 Spinnaker Point Ter, San Diego, CA 92154
$-1,034
Cash flow
-8.8%
Cash-on-Cash Return
4.0%
Cap rate
0.6%
Rent to Value Ratio
Active
$1,690,000
3
bds
|
2
ba
|
1,399
sqft
|
built
1960
3428 Garrison St, San Diego, CA 92106
$-4,337
Cash flow
-13.4%
Cash-on-Cash Return
3.0%
Cap rate
0.4%
Rent to Value Ratio
Active
$1,195,000
1
bds
|
1
ba
|
3,416
sqft
|
built
1975
913 Grand Ave, Spring Valley, CA 91977
$-4,111
Cash flow
-17.9%
Cash-on-Cash Return
1.9%
Cap rate
0.2%
Rent to Value Ratio