Orange County Investment Properties for Sale
Browse homes for sale and investment properties in Orange County. Refine your search by price, property type, or more.
Best cash flowing properties in Orange County
Active
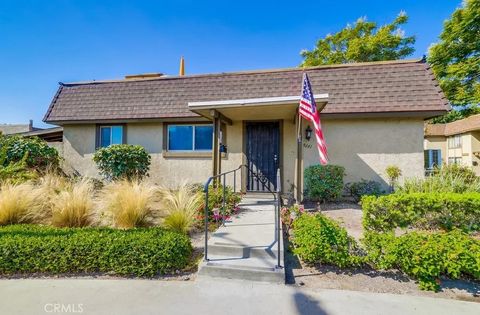
$649,000
2
bds
|
1
ba
|
925
sqft
|
built
1971
8661 Windsor Cir, La Palma, CA 90623
$-1,641
Cash flow
-13.2%
Cash-on-Cash Return
3.0%
Cap rate
0.4%
Rent to Value Ratio
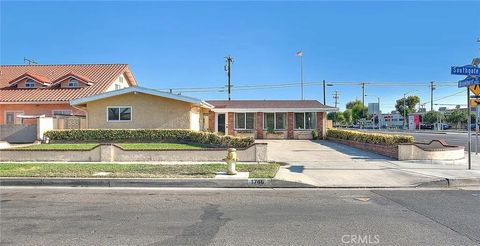
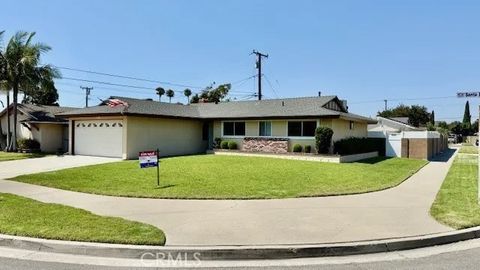
Active
$849,980
3
bds
|
2
ba
|
1,253
sqft
|
built
1954
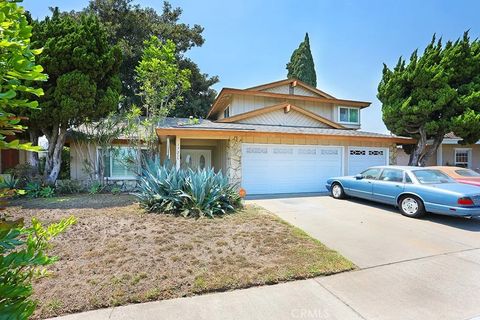
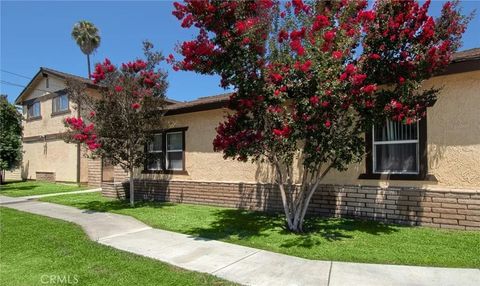
1746 W Southgate Ave, Fullerton, CA 92833
$-1,814
Cash flow
-11.1%
Cash-on-Cash Return
3.5%
Cap rate
0.4%
Rent to Value Ratio
167 out of 1,944 properties for sale in Orange County
Limited Results Shown
Create a free account, or log in to reveal all property listings and enjoy the complete experience.
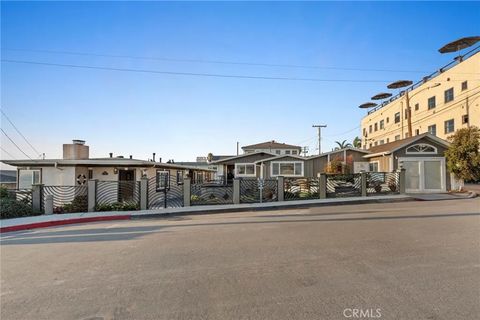
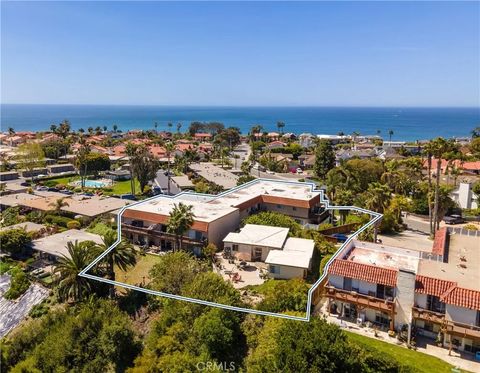
Active
$6,994,950
bds
|
0
ba
|
0
sqft
|
built
1955
150 Cress St, Laguna Beach, CA 92651
$-27,099
Cash flow
-20.2%
Cash-on-Cash Return
1.0%
Cap rate
0.1%
Rent to Value Ratio
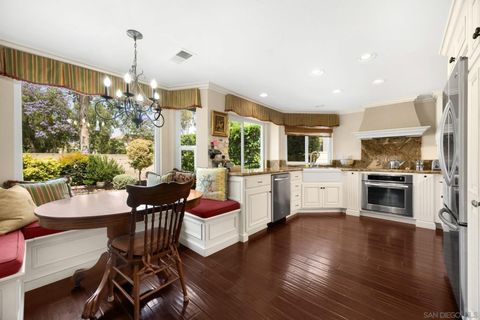
Active
$1,950,000
4
bds
|
3
ba
|
2,459
sqft
|
built
1978
40 Brena, Irvine, CA 92620
$-6,048
Cash flow
-16.2%
Cash-on-Cash Return
2.3%
Cap rate
0.3%
Rent to Value Ratio
Active
$11,995,000
12
bds
|
9
ba
|
0
sqft
|
built
1969
34381 Dana Strand Rd, Dana Point, CA 92629
$-57,479
Cash flow
-25.0%
Cash-on-Cash Return
0.3%
Cap rate
0.0%
Rent to Value Ratio

Active
$849,950
5
bds
|
2
ba
|
0
sqft
|
built
1923
226 S Hillcrest St, La Habra, CA 90631
$-1,883
Cash flow
-11.6%
Cash-on-Cash Return
3.4%
Cap rate
0.4%
Rent to Value Ratio
Active
$1,450,000
4
bds
|
5
ba
|
2,236
sqft
|
built
1963
9331 Grand Dr, Huntington Beach, CA 92646
$-3,537
Cash flow
-12.7%
Cash-on-Cash Return
3.1%
Cap rate
0.4%
Rent to Value Ratio

Active
$1,799,000
3
bds
|
3
ba
|
2,406
sqft
|
built
1989
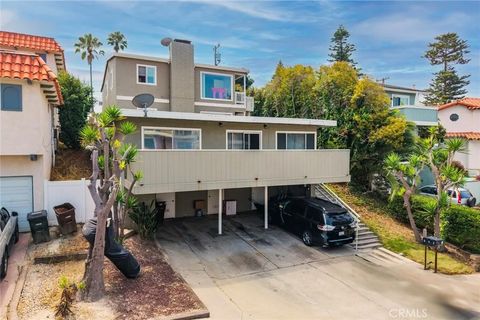
1208 California St, Huntington Beach, CA 92648
$-4,750
Cash flow
-13.8%
Cash-on-Cash Return
2.9%
Cap rate
0.4%
Rent to Value Ratio
Active
$1,700,000
4
bds
|
4
ba
|
0
sqft
|
built
1976
24832 Sherwood Way, Dana Point, CA 92629
$-5,560
Cash flow
-17.1%
Cash-on-Cash Return
2.1%
Cap rate
0.3%
Rent to Value Ratio
Active
$10,900,000
6
bds
|
0
ba
|
0
sqft
|
built
1965
5901 Seashore Dr, Newport Beach, CA 92663
$-51,252
Cash flow
-24.5%
Cash-on-Cash Return
0.4%
Cap rate
0.1%
Rent to Value Ratio
Active
$1,650,000
3
bds
|
3
ba
|
1,711
sqft
|
built
1993
171 E 18th St, Costa Mesa, CA 92627
$-5,413
Cash flow
-17.1%
Cash-on-Cash Return
2.1%
Cap rate
0.3%
Rent to Value Ratio
Active
$1,600,000
4
bds
|
3
ba
|
2,119
sqft
|
built
1968
17215 Buttonwood St, Fountain Valley, CA 92708
$-4,709
Cash flow
-15.4%
Cash-on-Cash Return
2.5%
Cap rate
0.3%
Rent to Value Ratio
Active
$979,900
2
bds
|
2
ba
|
0
sqft
|
built
1947
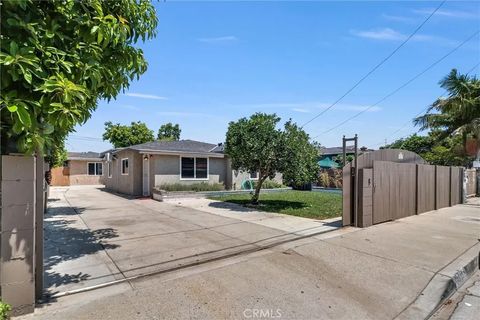
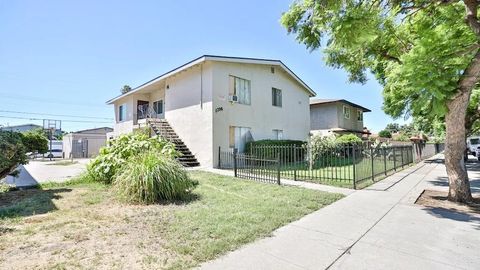
2513 W Occidental St, Santa Ana, CA 92704
$-2,816
Cash flow
-15.0%
Cash-on-Cash Return
2.6%
Cap rate
0.3%
Rent to Value Ratio
Active
$890,000
4
bds
|
2
ba
|
0
sqft
|
built
1962
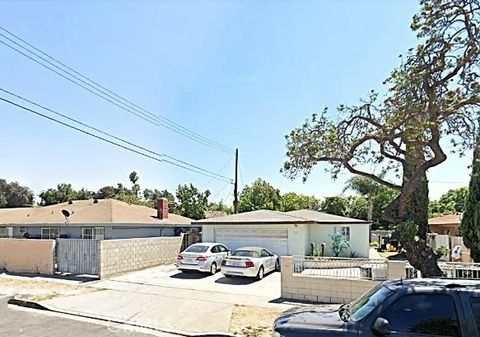
3510 W Pine St, Santa Ana, CA 92704
$-2,361
Cash flow
-13.8%
Cash-on-Cash Return
2.9%
Cap rate
0.3%
Rent to Value Ratio
Active
$5,295,000
4
bds
|
3
ba
|
2,945
sqft
|
built
1973
32591 Mediterranean Dr, Dana Point, CA 92629
$-20,824
Cash flow
-20.5%
Cash-on-Cash Return
1.3%
Cap rate
0.2%
Rent to Value Ratio
Active
$3,125,000
8
bds
|
8
ba
|
0
sqft
|
built
1977
6411 Western Ave, Buena Park, CA 90621
$-14,077
Cash flow
-23.5%
Cash-on-Cash Return
0.7%
Cap rate
0.1%
Rent to Value Ratio
Active
$1,949,000
6
bds
|
4
ba
|
0
sqft
|
built
1962
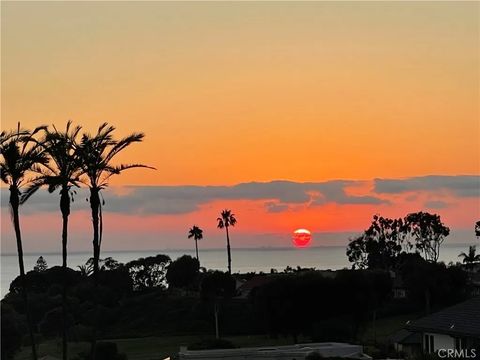
211 W Escalones, San Clemente, CA 92672
$-7,647
Cash flow
-20.5%
Cash-on-Cash Return
1.4%
Cap rate
0.2%
Rent to Value Ratio
Active
$1,295,000
2
bds
|
1
ba
|
0
sqft
|
built
1961
1714 Evergreen St, Santa Ana, CA 92707
$-4,961
Cash flow
-20.0%
Cash-on-Cash Return
1.5%
Cap rate
0.2%
Rent to Value Ratio
Active
$7,295,000
3
bds
|
3
ba
|
1,583
sqft
|
built
1933
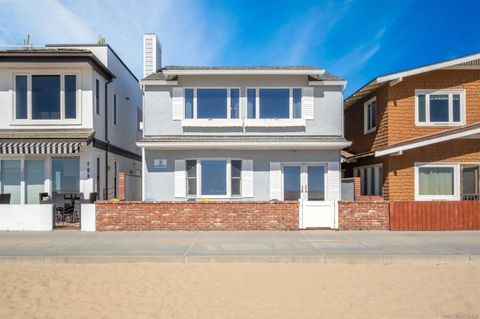
206 E Oceanfront, Newport Beach, CA 92661
$-32,609
Cash flow
-23.3%
Cash-on-Cash Return
0.7%
Cap rate
0.1%
Rent to Value Ratio
Active
$4,899,000
4
bds
|
0
ba
|
0
sqft
|
built
2017
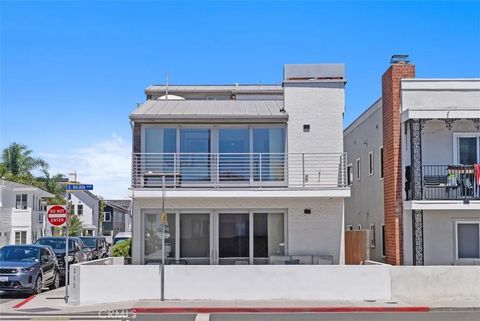
200 E Balboa Blvd, Newport Beach, CA 92661
$-16,906
Cash flow
-18.0%
Cash-on-Cash Return
1.9%
Cap rate
0.2%
Rent to Value Ratio
Active
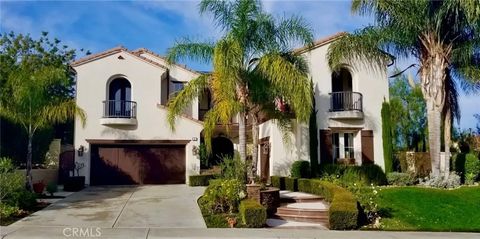
$3,070,000
4
bds
|
5
ba
|
4,232
sqft
|
built
2002
3 Hubbard Way, Coto De Caza, CA 92679
$-8,218
Cash flow
-14.0%
Cash-on-Cash Return
2.9%
Cap rate
0.4%
Rent to Value Ratio
Active
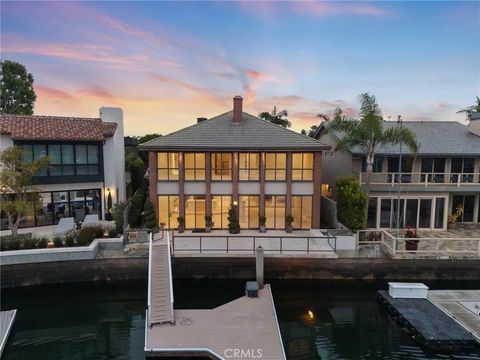
$8,249,000
5
bds
|
5
ba
|
4,503
sqft
|
built
1969
73 Linda Isle, Newport Beach, CA 92660
$-35,666
Cash flow
-22.6%
Cash-on-Cash Return
0.9%
Cap rate
0.1%
Rent to Value Ratio
Active
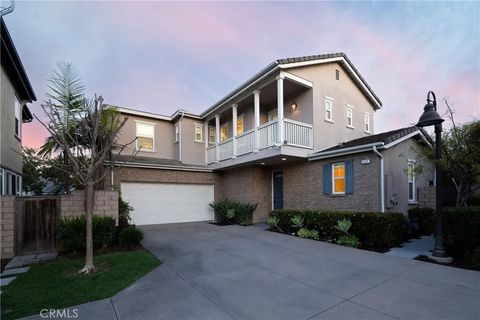
$2,500,000
4
bds
|
3
ba
|
2,191
sqft
|
built
2006
2547 Cornerstone Ln, Costa Mesa, CA 92626
$-7,987
Cash flow
-16.7%
Cash-on-Cash Return
2.2%
Cap rate
0.3%
Rent to Value Ratio
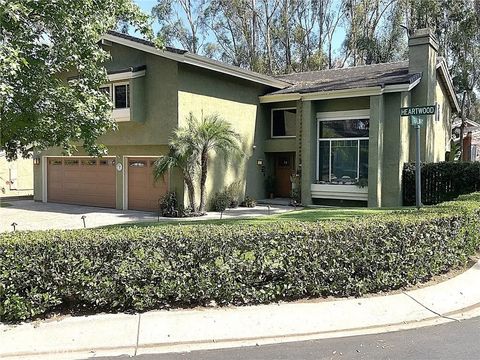
Active
$1,589,900
4
bds
|
3
ba
|
2,728
sqft
|
built
1976
24975 Heartwood Cir, Lake Forest, CA 92630
$-4,375
Cash flow
-14.4%
Cash-on-Cash Return
2.8%
Cap rate
0.4%
Rent to Value Ratio
Active
$3,058,000
4
bds
|
2
ba
|
2,035
sqft
|
built
1968
18761 Via San Marco, Irvine, CA 92603
$-11,188
Cash flow
-19.1%
Cash-on-Cash Return
1.7%
Cap rate
0.2%
Rent to Value Ratio
Active
$3,750,000
5
bds
|
5
ba
|
0
sqft
|
built
1927
243 Avenida Madrid, San Clemente, CA 92672
$-17,237
Cash flow
-24.0%
Cash-on-Cash Return
0.6%
Cap rate
0.1%
Rent to Value Ratio
Active
$1,499,000
6
bds
|
4
ba
|
0
sqft
|
built
1958
1030 W Romneya Dr, Anaheim, CA 92801
$-5,096
Cash flow
-17.7%
Cash-on-Cash Return
2.0%
Cap rate
0.2%
Rent to Value Ratio

Active
$1,999,999
7
bds
|
4
ba
|
0
sqft
|
built
1954
1701 Lake St, Huntington Beach, CA 92648
$-5,946
Cash flow
-15.5%
Cash-on-Cash Return
2.1%
Cap rate
0.3%
Rent to Value Ratio
Active
$6,000,000
9
bds
|
8
ba
|
0
sqft
|
built
27512 Del Gado Rd, San Clemente, CA 92672
$-28,200
Cash flow
-24.5%
Cash-on-Cash Return
0.4%
Cap rate
0.1%
Rent to Value Ratio

Active
$1,395,000
3
bds
|
2
ba
|
1,198
sqft
|
built
1957
432 Beryl Cove Way, Seal Beach, CA 90740
$-4,018
Cash flow
-15.0%
Cash-on-Cash Return
2.6%
Cap rate
0.3%
Rent to Value Ratio
Active
$1,250,000
4
bds
|
2
ba
|
1,459
sqft
|
built
1960
6051 Santa Barbara Ave, Garden Grove, CA 92845
$-3,561
Cash flow
-14.9%
Cash-on-Cash Return
2.6%
Cap rate
0.3%
Rent to Value Ratio

Active
$925,000
3
bds
|
2
ba
|
1,338
sqft
|
built
1962
8940 Comet Cir, Westminster, CA 92683
$-2,193
Cash flow
-12.4%
Cash-on-Cash Return
3.2%
Cap rate
0.4%
Rent to Value Ratio
Active
$1,700,000
2
bds
|
0
ba
|
0
sqft
|
built
1943
13141 Monroe St, Garden Grove, CA 92844
$-6,457
Cash flow
-19.8%
Cash-on-Cash Return
1.5%
Cap rate
0.2%
Rent to Value Ratio

Active
$1,399,000
3
bds
|
2
ba
|
1,156
sqft
|
built
1965
213 Calle Dorado, San Clemente, CA 92672
$-3,279
Cash flow
-12.2%
Cash-on-Cash Return
3.3%
Cap rate
0.4%
Rent to Value Ratio

Active
$1,050,000
4
bds
|
2
ba
|
1,735
sqft
|
built
1970
473 Brittany Ln, Brea, CA 92821
$-2,274
Cash flow
-11.3%
Cash-on-Cash Return
3.5%
Cap rate
0.4%
Rent to Value Ratio

Active
$2,199,999
6
bds
|
6
ba
|
0
sqft
|
built
2004
3405 S El Camino Real, San Clemente, CA 92672
$-8,640
Cash flow
-20.5%
Cash-on-Cash Return
1.4%
Cap rate
0.2%
Rent to Value Ratio
Active
$2,200,000
9
bds
|
8
ba
|
0
sqft
|
built
1972
1400 Eastpark Dr, La Habra, CA 90631
$-9,330
Cash flow
-22.1%
Cash-on-Cash Return
1.0%
Cap rate
0.1%
Rent to Value Ratio
Active
$2,200,000
3
bds
|
2
ba
|
1,868
sqft
|
built
1941
622 Center St, Costa Mesa, CA 92627
$-7,674
Cash flow
-18.2%
Cash-on-Cash Return
1.9%
Cap rate
0.2%
Rent to Value Ratio

Active
$14,500,000
5
bds
|
6
ba
|
4,477
sqft
|
built
2003
2238 Channel Rd, Newport Beach, CA 92661
$-66,420
Cash flow
-23.9%
Cash-on-Cash Return
0.6%
Cap rate
0.1%
Rent to Value Ratio

Active
$1,390,000
3
bds
|
3
ba
|
2,449
sqft
|
built
1991
14 Morningstar, Trabuco Canyon, CA 92679
$-3,830
Cash flow
-14.4%
Cash-on-Cash Return
2.8%
Cap rate
0.4%
Rent to Value Ratio