
$2,500,000
Investment Summary
- Monthly Cash Flow
- -$9,162
- Cap Rate
- 1.7%
- Cash-on-Cash Return
- -19.1%
- Debt Coverage Ratio
- 0.28
- Internal Rate of Return (5 years)
- -14.5%
Cash Flow
Net Operating Income (NOI) minus mortgage payments.
Calculation:
NOI - Mortgage Payments
Cap Rate (Market Value)
Capitalization Rate is a rate of return that compares the yearly Net Operating Income (NOI) to the market value.
Calculation:
NOI / Market Value
Cash-on-Cash Return (CoC)
Annual Cash Flow / Cash Invested
Calculation:
Annual cash flow divided by initial cash invested.
Debt Coverage Ratio (DCR)
Net Operating Income (NOI) divided by total debt payments.
Calculation:
NOI / Total Debt Payments
Internal Rate of Return (IRR)
A metric for assessing profitability over time. IRR is the discount rate at which the net present value (NPV) of all future cash flows (positive and negative) from an investment equals zero — including both periodic cash flow (such as rent) and a projected sale at the end of the holding period. It represents the expected annualized return, accounting for income, expenses, and the recovery of capital through a future sale.
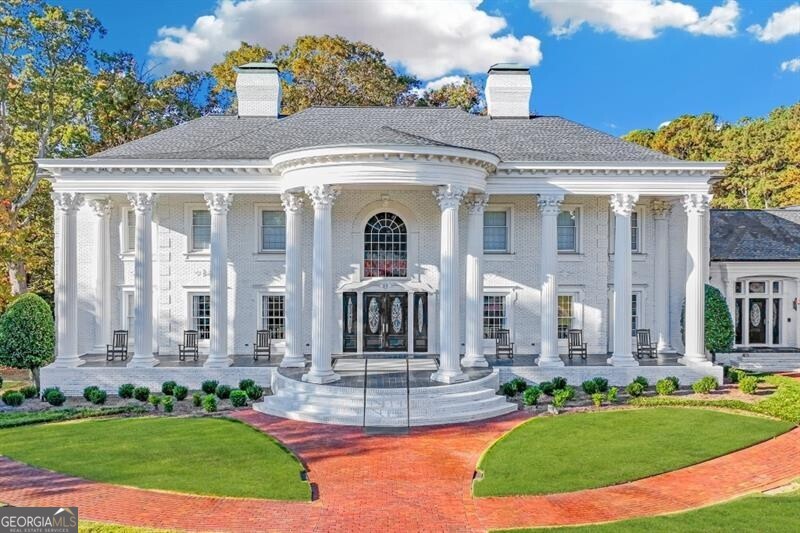
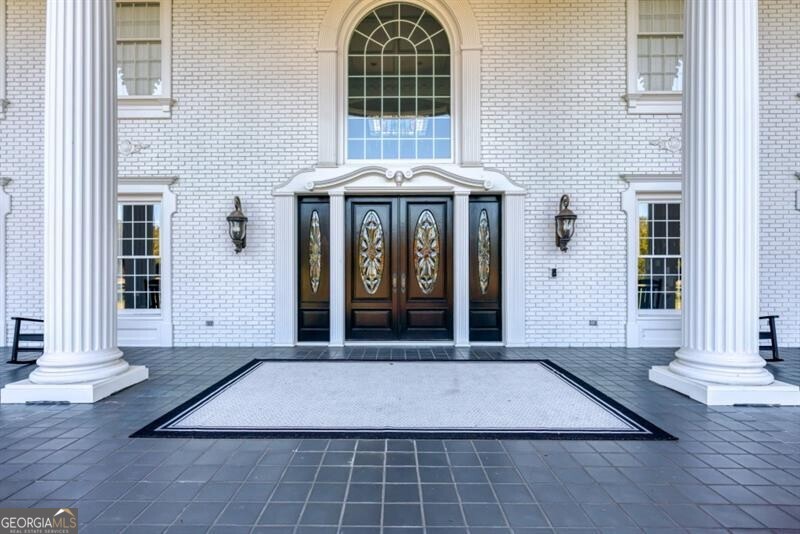
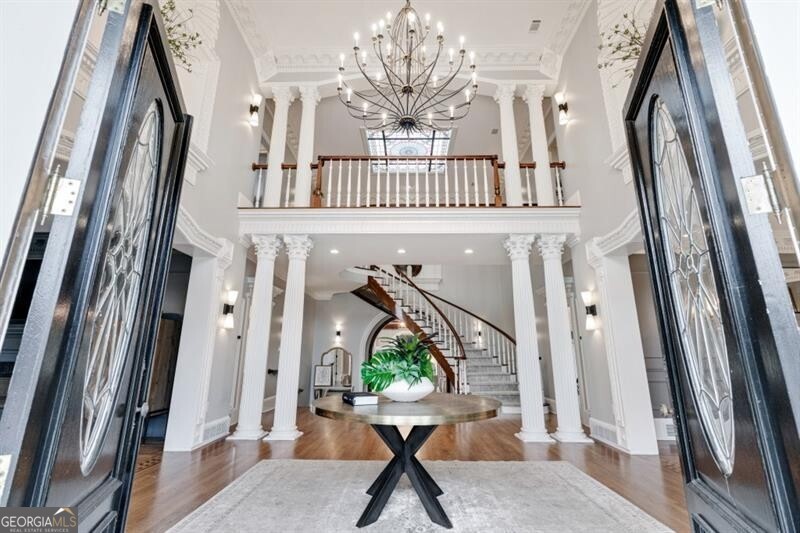
Property Description
Welcome to this one-of-a-kind home. Combining the timeless traditional southern mansion with modern design aesthetics this home is like a rare jewel in every way. 12.65-acre estate with beautiful trees & emerald zoysia lawn. 11 two-story columns & grand sweeping staircase invite you in. Every room in the home features ornate woodwork from floor to ceiling that was originally imported from Italy. The study/formal salon to the left of the grand foyer and a gorgeous formal dining room to the right. The sunken great room features mahogany bookshelves, and two-story ceilings with gorgeous, stained woodwork. The completely remodeled kitchen is drop-dead gorgeous featuring white cabinetry, top-of-the-line Cambria Quartz counters, pot filler, 64-inch built-in refrigerator/freezer, Wolf double range w/a commercial grade vent hood, microwave & Bosch dishwasher. Huge custom walk-in pantry with a scullery area. The breakfast room will fit a table for 12 and has a built-in buffet. The sunken sunroom has gorgeous views of the yard and the pool. There are two primary bedrooms, one on the main and the larger one upstairs. Both suites feature a fireplace and newly renovated white marble bathrooms that are jaw-dropping. There is an elevator off the kitchen that takes you to the top two floors. The laundry room is filled with tons of custom cabinets, a sink, a built-in mud area for coats & shoes, and space for an extra refrigerator. The secondary bedrooms feature large closets and adjoining bathrooms. Above the secondary bedrooms is a third-floor loft space that would make a great hobby or playroom. Hardwood floors throughout the home except for two closets & tile in the kitchen & laundry. There is an apartment for a housekeeper that features a full kitchen, family room, bedroom, and bathroom. The basement is finished with a half bath. There are two half baths on the main level. The 20x40 heated saltwater pool with a waterfall and hidden stone grotto. There is a sunken pavilion that has a fireplace, outdoor kitchen, & swim-up bar. Custom closets in every room. 16 Total Garage Spaces. 3-car oversized garage attached, 1-car boat door in the basement and there are floor drains in the basement and one of the previous owners would pull multiple cars into the basement and wash all their cars. The 60 x40 detached building or workshop can house 10-12 cars very easily. The building has electricity, heat & water and is stubbed for a bath. 3 water heaters. 6 HVAC Units. 5 Gas Fireplaces indoors and 1 electric fireplace at the pavilion. Roof is only 4 years old. Over $1,000,000 spent in renovations to bring this home to the showplace it is today. Seller is a licensed agent in the state of Georgia. Appointment Only.
Build Your Team
Quickly find investor-friendly professionals who can help you succeed in real estate investing at any stage of the investing journey.


Agents
Match with investor-friendly agents who can help you find, analyze, and close your next deal


Lenders
Get the best funding…find investor-friendly lenders who specialize in your deal strategy


Property Managers
Transition to passive investing. Find a trusted property management partnership that lasts.


Tax Pros & Accountants
Taxes and financial reporting made easy—find experts to create tax savings strategies, file taxes, and more
Location
Property Details
Parking
- Description: Attached, Garage, Garage Door Opener, Garage Faces Rear, Garage Faces Side, Kitchen Level, Level Driveway
- Details: Attached, Garage, Garage Door Opener, Kitchen Level, Boat
- Garage Spaces: 0
- Spaces Total: 0
Bedroom Information
- # of Bedrooms: 5
Bathroom Information
- # of Baths (Full): 4
- # of Baths (Partial): 3
- # of Baths (Total): 0.0
Interior Features
- # of Rooms: 13
- # of Stories: 3
- Attic: Yes
- Basement: Yes
- Basement Description: Concrete, Daylight, Exterior Entry, Finished, Full
- Fireplace: Yes
Exterior Features
- Exterior Walls Materials: Brick
- Roof Type: Gable or Hip
- Roof Material: Composition, Other
Land Information
- Land Use: Residential
- Land Use Subtype: Single Family Residential
Lot Information
- Parcel ID: R5088231
- Lot Size: 0 sqft
Property Information
- Property Type: Single Family Residence
- Style: Brick 4 Side, Colonial
- Year Built: 1988
Tax Information
- Annual Tax: $22,510
Utilities
- Water & Sewer: Public
- Heating: Central, Forced Air, Natural Gas, Other
- Cooling: Ceiling Fan(s), Central Air, Zoned
Location
- County: Gwinnett
Investment Summary
- Monthly Cash Flow
- -$9,162
- Cap Rate
- 1.7%
- Cash-on-Cash Return
- -19.1%
- Debt Coverage Ratio
- 0.28
- Internal Rate of Return (5 years)
- -14.5%
Cash Flow
Net Operating Income (NOI) minus mortgage payments.
Calculation:
NOI - Mortgage Payments
Cap Rate (Market Value)
Capitalization Rate is a rate of return that compares the yearly Net Operating Income (NOI) to the market value.
Calculation:
NOI / Market Value
Cash-on-Cash Return (CoC)
Annual Cash Flow / Cash Invested
Calculation:
Annual cash flow divided by initial cash invested.
Debt Coverage Ratio (DCR)
Net Operating Income (NOI) divided by total debt payments.
Calculation:
NOI / Total Debt Payments
Internal Rate of Return (IRR)
A metric for assessing profitability over time. IRR is the discount rate at which the net present value (NPV) of all future cash flows (positive and negative) from an investment equals zero — including both periodic cash flow (such as rent) and a projected sale at the end of the holding period. It represents the expected annualized return, accounting for income, expenses, and the recovery of capital through a future sale.
Purchase Details
Purchase PriceThe price paid for the property. Purchase price:
| $2,500,000 |
|---|---|
Amount FinancedThe amount of the purchase financed through a loan. Amount financed:
| -$2,000,000 |
Down paymentThe initial payment made towards the purchase. Down payment:
| $500,000 |
Closing CostsFees and expenses associated with purchasing a property, typically ranging from 2% to 5% of the home’s purchase price, paid at the end of a home purchase to cover services like lending, title transfer, and taxes. Closing costs:
| $75,000 |
Rehab CostsCosts incurred to repair or improve the property, including: roof, flooring, exterior siding, kitchen, exterior paint, bathrooms, etc. Rehab costs:
| $0 |
Initial Cash InvestedThe total initial cash invested in the property. Calculation:Down payment + Buying costs + Rehab costs Initial cash invested:
| $575,000 |
Square Feet (SQFT)The total square footage of the property. Square feet:
| 15,866 |
Cost Per Square FootCost per square foot of the property. Calculation:Purchase Price / Square Feet Cost per square foot:
| $158 |
Monthly Rent Per Square FootMonthly rent divided by the number of square feet. This ratio helps investors compare rental income efficiency across properties, markets, and unit sizes Calculation:Monthly Rent / Square Feet Monthly rent per square foot:
| $0.50 |
Financing Details
Loan AmountThe total sum of money borrowed from a lender to finance a property purchase. Calculation:Purchase Price - Down Payment
Loan amount:
| $2,000,000 |
|---|---|
Loan to Value Ratio (LTV)Loan amount divided by the market value of the property. Calculation:Loan Amount / Market Value
Loan to value ratio:
| 80.0% |
Loan TypeThe type of loan (e.g., fixed, adjustable).
Loan type:
| Amortizing |
TermThe loan repayment period in years.
Term:
| 30 years |
Interest RateThe percentage a lender charges on the borrowed amount of a loan, determining the cost of borrowing money.
Interest rate:
| 6.625% |
Principal & Interest (PI)The principal is the portion of the loan payment that reduces the loan balance. The interest is the lender's charge for borrowing money. Calculation:(P * r * (1 + r) ** n) / ((1 + r) ** n - 1) Where:
P = Loan amount (principal)
Principal & interest:
| $12,806 |
Property TaxesAnnual taxes levied by local governments on real estate properties. These taxes fund public services like schools, roads, and emergency services.
Property tax:
| $1,876 |
InsuranceThe costs for insurance coverage to protect against financial losses due to risks like fire, natural disasters, theft, liability, or tenant-related damages. Calculation:Assumes 7% of gross rental income, unless insurance rates are specified.
Insurance:
| $560 |
Private Mortgage Insurance (PMI)A fee that borrowers pay when they take out a conventional loan with a loan-to-value (LTV) ratio above 80%.
Private mortgage insurance (PMI):
| $0 |
Monthly PaymentThe fixed amount a borrower pays each month to repay a loan. It typically includes principal and interest (P&I) and may also cover property taxes, insurance, HOA fees, and PMI if escrowed. Monthly payment:
| $15,242 |
Operating Income
| % Rent | Monthly | Yearly | |
|---|---|---|---|
Gross RentThe total rental income received from tenants before deducting any expenses. Includes base rent, late fees, pet fees, parking fees, and other recurring charges.
Gross rent:
| $8,000 | $96,000 | |
Vacancy LossExpected loss of rent due to vacancies.
Vacancy loss:
(6%)
| 6% | -$480 | -$5,760 |
Operating IncomeGross rental income minus vacancy loss. Calculation:Gross rent - Vacancy loss
Operating income:
| $7,520 | $90,240 |
Operating Expenses
| % Rent | Monthly | Yearly | |
|---|---|---|---|
Property TaxesAnnual taxes levied by local governments on real estate properties. These taxes fund public services like schools, roads, and emergency services. | 23% | -$1,876 | -$22,510 |
InsuranceThe costs for insurance coverage to protect against financial losses due to risks like fire, natural disasters, theft, liability, or tenant-related damages. Calculation:Assumes 7% of gross rental income, unless insurance rates are specified. | 7% | -$560 | -$6,720 |
Property ManagementThe costs associated with hiring a property manager to handle the day-to-day operations of a rental property. Includes management fees, leasing fes, eviction fees, etc. Calculation:Assumes 8% of gross rental income. | 8% | -$640 | -$7,680 |
Repairs & MaintenanceOngoing costs for routine upkeep and minor fixes needed to keep a property in good working condition. Calculation:Assumes 5% of gross rental income. Varies by property age and condition. | 5% | -$400 | -$4,800 |
Capital ExpensesLarge, infrequent costs for major improvements or replacements, like a new roof, HVAC system, or appliances. Calculation:Assumes 5% of gross rental income. Varies by property age. | 5% | -$400 | -$4,800 |
HOA FeesRegular dues paid to a Homeowners Association for community maintenance, amenities, and management. Similar fees include: Condo Association Fees, Co-op Maintenance Fees, etc. | n/a | n/a | n/a |
Operating ExpensesRecurring costs required to maintain and manage a rental property, including property taxes, insurance, maintenance, repairs, utilities (if paid by the owner), property management fees, and other day-to-day expenses. Calculation:Insurance + Property Taxes + Property Management + Repairs & Maintenance + Capital Expenditures + HOA Fees | 48% | -$3,876 | -$46,510 |
Cash Flow
| Monthly | Yearly | |
|---|---|---|
Net Operating Income (NOI)The income generated from a property after deducting all operating expenses but before deducting mortgage payments, taxes, and capital expenditures. Calculation:Gross Operating Income - Operating Expenses
Net operating income:
| $3,644 | $43,728 |
Mortgage PaymentThe fixed amount a borrower pays each month to repay a loan. It typically includes principal and interest (P&I) and may also cover property taxes, insurance, HOA fees, and PMI if escrowed. | -$12,806 | -$153,672 |
Cash FlowNet Operating Income (NOI) minus mortgage payments. Calculation:NOI - Mortgage Payments | $9,162 | $109,944 |