Grayson, GA Investment Properties for Sale
Browse homes for sale and investment properties in Grayson, GA. Refine your search by price, property type, or more.
Best cash flowing properties in Grayson, GA
Active
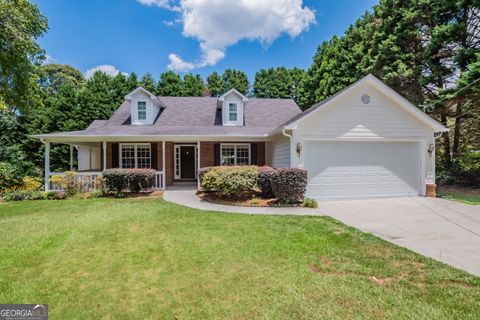
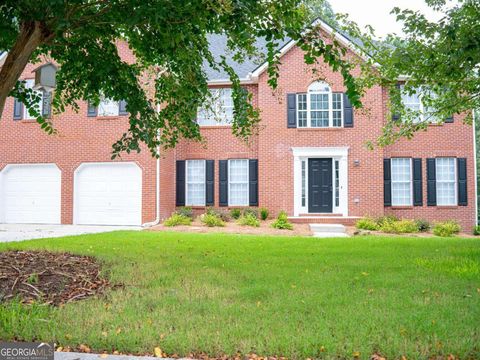
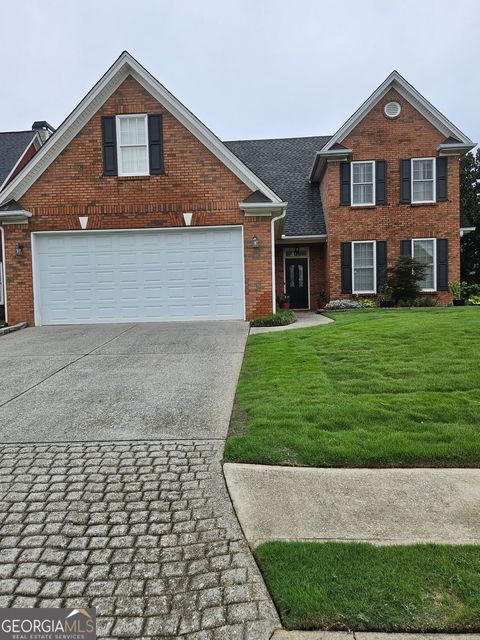
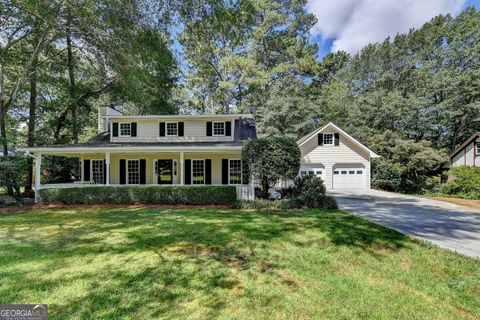
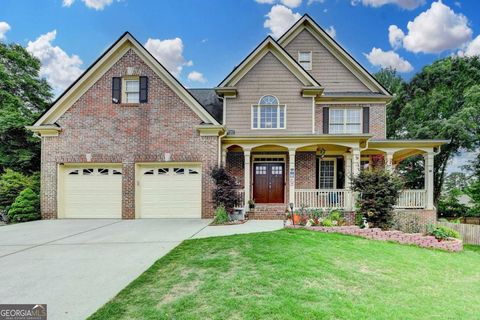
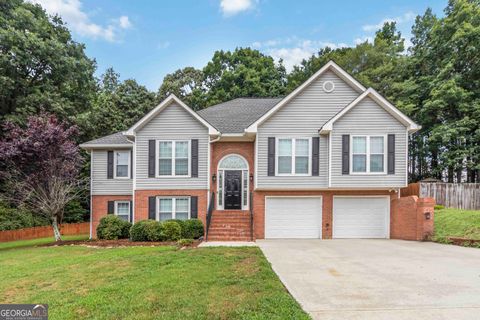
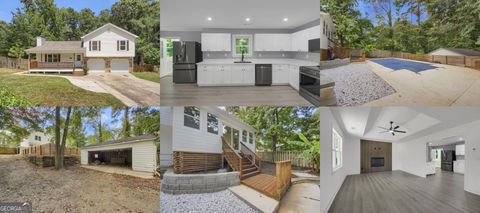
$314,000
3
bds
|
2
ba
|
1,295
sqft
|
built
1985
1403 Lakemont Dr, Grayson, GA 30017
$-258
Cash flow
-4.3%
Cash-on-Cash Return
5.2%
Cap rate
0.8%
Rent to Value Ratio
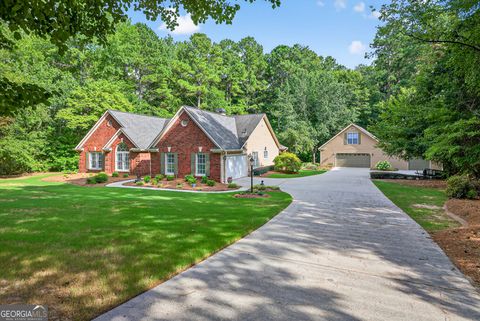
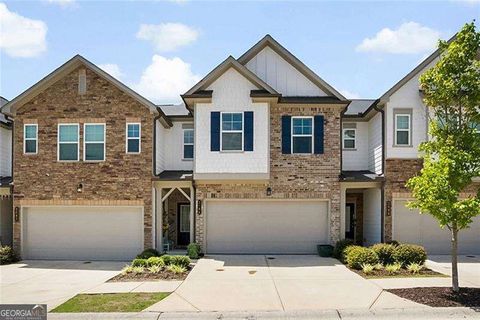
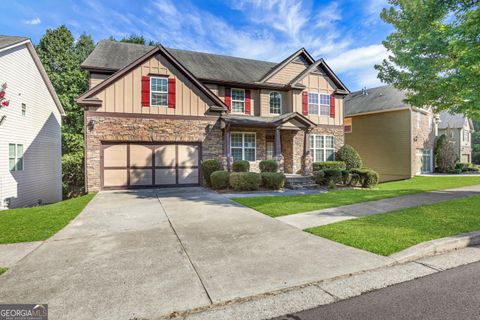
Active
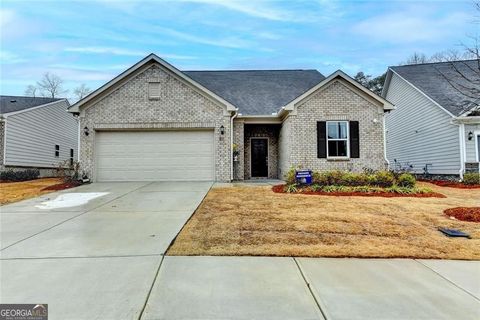
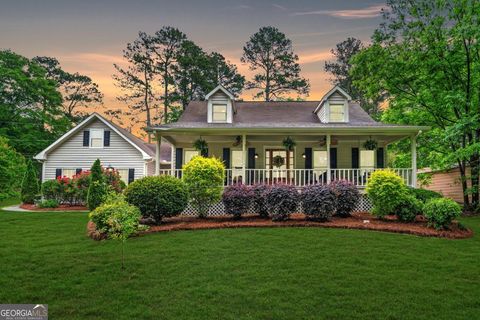
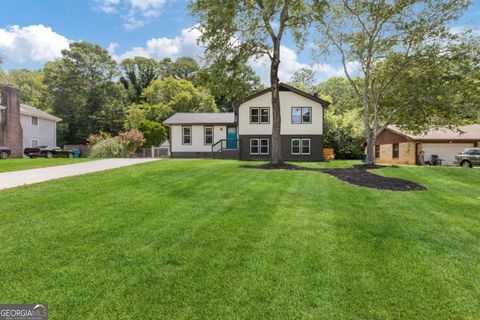
$399,900
3
bds
|
2
ba
|
2,343
sqft
|
built
1992
2110 Meadow View Ct, Grayson, GA 30017
$-461
Cash flow
-6.0%
Cash-on-Cash Return
4.8%
Cap rate
0.6%
Rent to Value Ratio
61 out of 64 properties for sale in Grayson, GA
Limited Results Shown
Create a free account, or log in to reveal all property listings and enjoy the complete experience.
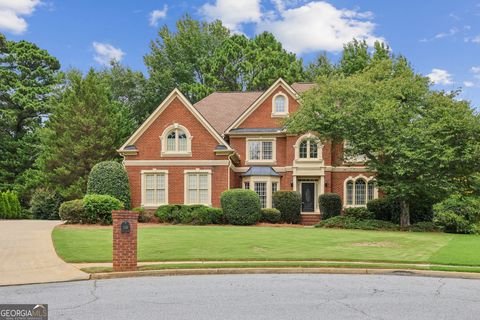
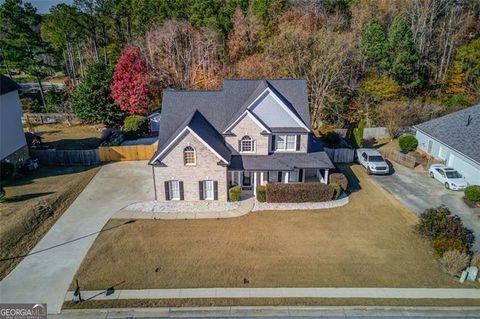
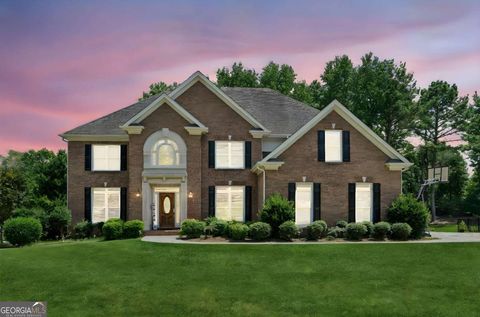
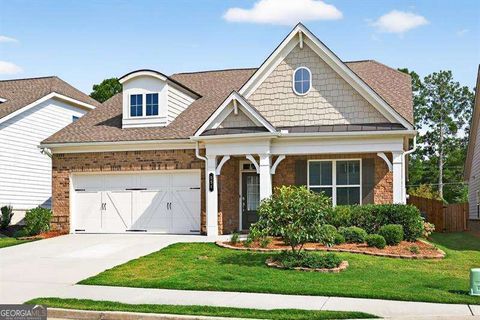
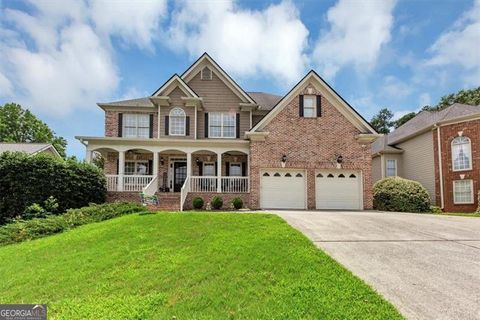
Active
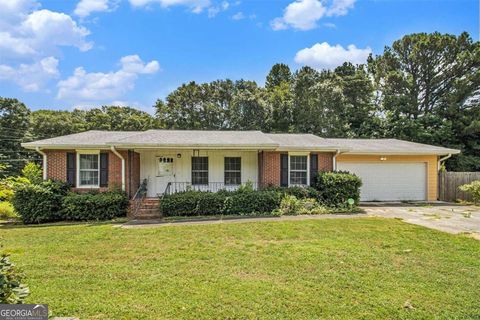
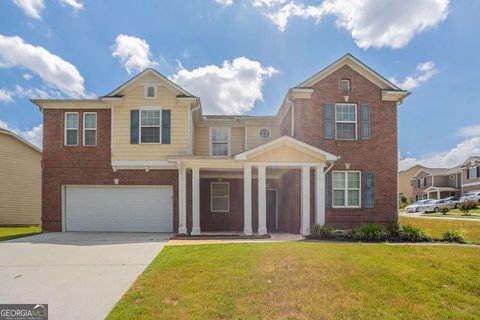
$465,000
3
bds
|
3
ba
|
2,519
sqft
|
built
2023
811 Pineberry Ct, Grayson, GA 30017
$-1,301
Cash flow
-14.6%
Cash-on-Cash Return
2.8%
Cap rate
0.5%
Rent to Value Ratio
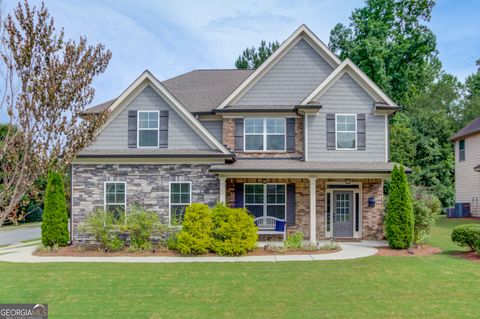
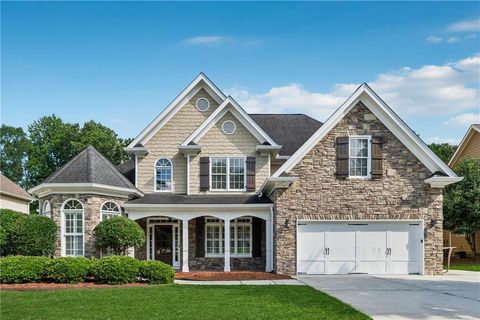
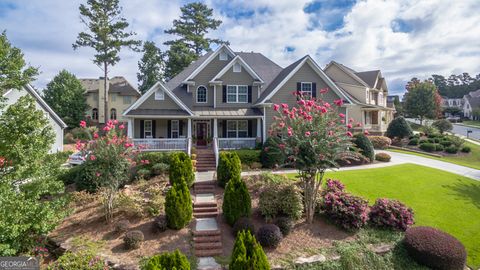
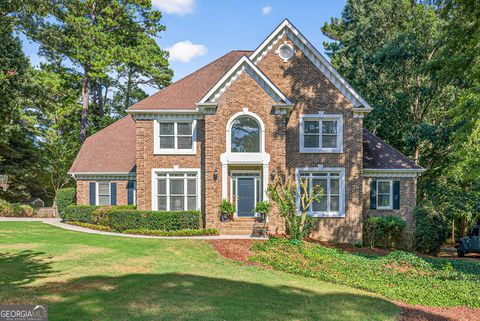
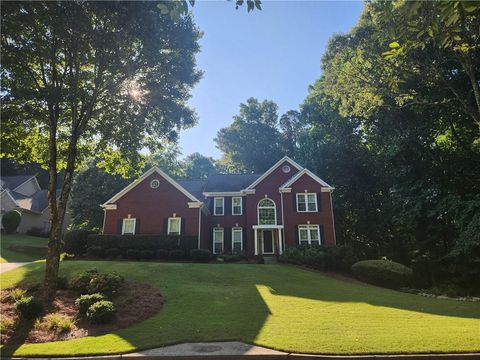
Active
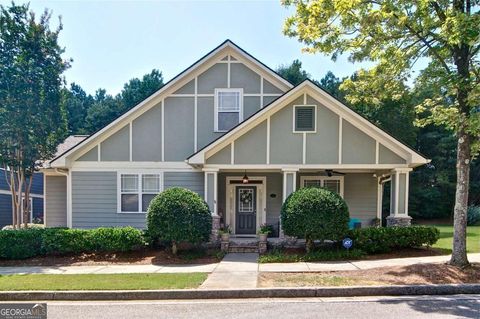
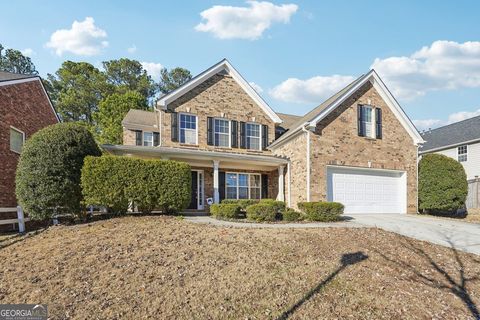
$525,000
6
bds
|
4
ba
|
3,659
sqft
|
built
2001
1729 Pinehurst View Ct, Grayson, GA 30017
$-1,549
Cash flow
-15.4%
Cash-on-Cash Return
2.6%
Cap rate
0.5%
Rent to Value Ratio
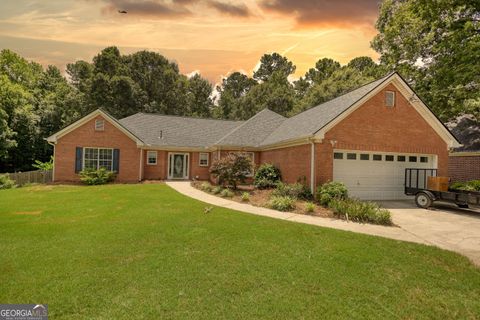
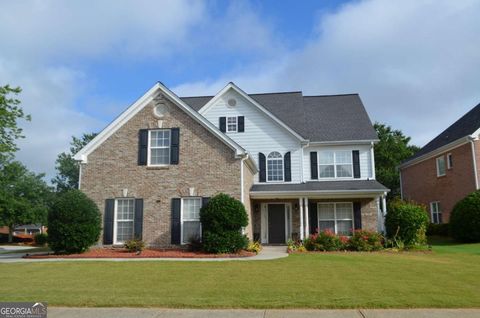
Active
$555,000
5
bds
|
3
ba
|
3,449
sqft
|
built
1999
1860 Pinehurst View Dr, Grayson, GA 30017
$-1,740
Cash flow
-16.4%
Cash-on-Cash Return
2.4%
Cap rate
0.5%
Rent to Value Ratio
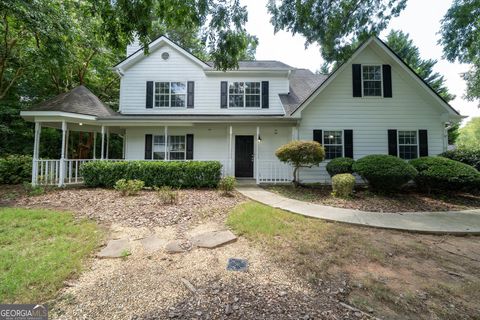
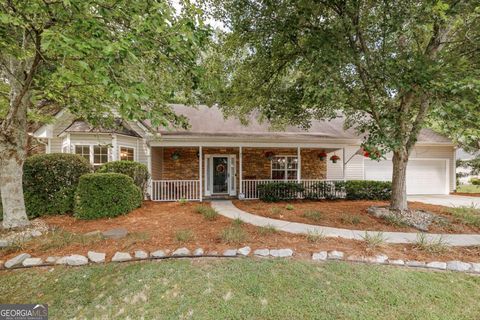
Active
$774,900
7
bds
|
6
ba
|
5,732
sqft
|
built
2002
1360 Mount Mc Kinley Dr, Grayson, GA 30017
$-1,963
Cash flow
-13.2%
Cash-on-Cash Return
3.1%
Cap rate
0.5%
Rent to Value Ratio
Active
$467,000
4
bds
|
3
ba
|
4,436
sqft
|
built
2005
1978 Cutleaf Creek Rd, Grayson, GA 30017
$-1,169
Cash flow
-13.1%
Cash-on-Cash Return
3.1%
Cap rate
0.6%
Rent to Value Ratio

Active
$419,000
3
bds
|
2.5
ba
|
2,158
sqft
|
built
2007
178 Mission Oak Dr, Grayson, GA 30017
$-1,062
Cash flow
-13.2%
Cash-on-Cash Return
3.1%
Cap rate
0.5%
Rent to Value Ratio
Active
$384,900
4
bds
|
2
ba
|
1,933
sqft
|
built
1995
1900 Mc Connell Rd, Grayson, GA 30017
$-852
Cash flow
-11.5%
Cash-on-Cash Return
3.5%
Cap rate
0.6%
Rent to Value Ratio
Active
$695,000
6
bds
|
5.5
ba
|
5,022
sqft
|
built
1999
1151 Gulfport Run, Grayson, GA 30017
$-1,593
Cash flow
-12.0%
Cash-on-Cash Return
3.4%
Cap rate
0.6%
Rent to Value Ratio
Active
$470,000
4
bds
|
3.5
ba
|
2,855
sqft
|
built
2019
1565 Stargrass Dr, Grayson, GA 30017
$-745
Cash flow
-8.3%
Cash-on-Cash Return
4.2%
Cap rate
0.7%
Rent to Value Ratio
Active
$449,000
3
bds
|
2
ba
|
2,285
sqft
|
built
1998
545 Herring Rd, Grayson, GA 30017
$-804
Cash flow
-9.3%
Cash-on-Cash Return
4.0%
Cap rate
0.5%
Rent to Value Ratio
Active
$399,990
4
bds
|
2.5
ba
|
1,785
sqft
|
built
1996
2161 Flowering Dr, Grayson, GA 30017
$-768
Cash flow
-10.0%
Cash-on-Cash Return
3.8%
Cap rate
0.6%
Rent to Value Ratio
Active
$487,000
3
bds
|
2.5
ba
|
2,566
sqft
|
built
2002
725 Windsor Place Cir, Grayson, GA 30017
$-1,053
Cash flow
-11.3%
Cash-on-Cash Return
3.6%
Cap rate
0.6%
Rent to Value Ratio
Active
$749,900
4
bds
|
3
ba
|
2,589
sqft
|
built
1996
455 Herring Rd, Grayson, GA 30017
$-2,096
Cash flow
-14.6%
Cash-on-Cash Return
2.8%
Cap rate
0.4%
Rent to Value Ratio
Active
$530,000
4
bds
|
2.5
ba
|
2,908
sqft
|
built
2002
1120 Mount Mc Kinley Dr, Grayson, GA 30017
$-912
Cash flow
-9.0%
Cash-on-Cash Return
4.1%
Cap rate
0.7%
Rent to Value Ratio
Active
$499,000
4
bds
|
3
ba
|
0
sqft
|
built
2003
1640 Wheat Grass Way, Grayson, GA 30017
$-847
Cash flow
-8.9%
Cash-on-Cash Return
4.1%
Cap rate
0.6%
Rent to Value Ratio
Active
$334,900
3
bds
|
2
ba
|
2,304
sqft
|
built
1982
1981 Shoreline Trce, Grayson, GA 30017
$-676
Cash flow
-10.5%
Cash-on-Cash Return
3.7%
Cap rate
0.7%
Rent to Value Ratio
Active
$324,900
3
bds
|
2.5
ba
|
0
sqft
|
built
2021
1484 Ben Park Way, Grayson, GA 30017
$-469
Cash flow
-7.5%
Cash-on-Cash Return
4.4%
Cap rate
0.8%
Rent to Value Ratio
Active
$790,000
5
bds
|
4.5
ba
|
0
sqft
|
built
1999
1404 Hattiesburg Ct, Grayson, GA 30017
$-2,292
Cash flow
-15.1%
Cash-on-Cash Return
2.7%
Cap rate
0.5%
Rent to Value Ratio
Active
$579,000
5
bds
|
4
ba
|
3,390
sqft
|
built
2004
1060 Windsor Creek Dr, Grayson, GA 30017
$-1,491
Cash flow
-13.4%
Cash-on-Cash Return
3.1%
Cap rate
0.5%
Rent to Value Ratio
Active
$555,000
6
bds
|
2.5
ba
|
4,560
sqft
|
built
2003
1732 Sweet Branch Trl, Grayson, GA 30017
$-1,490
Cash flow
-14.0%
Cash-on-Cash Return
2.9%
Cap rate
0.5%
Rent to Value Ratio
Active
$400,000
4
bds
|
2
ba
|
3,159
sqft
|
built
1982
1870 Shoreline Trce, Grayson, GA 30017
$-801
Cash flow
-10.4%
Cash-on-Cash Return
3.7%
Cap rate
0.6%
Rent to Value Ratio
Active
$325,000
3
bds
|
2
ba
|
0
sqft
|
built
1974
87 Grayson New Hope Rd, Grayson, GA 30017
$-465
Cash flow
-7.5%
Cash-on-Cash Return
4.4%
Cap rate
0.7%
Rent to Value Ratio
Active
$400,000
3
bds
|
2.5
ba
|
2,276
sqft
|
built
2003
278 Mission Oak Dr, Grayson, GA 30017
$-1,070
Cash flow
-14.0%
Cash-on-Cash Return
2.9%
Cap rate
0.6%
Rent to Value Ratio
Active
$434,900
5
bds
|
3
ba
|
3,618
sqft
|
built
1998
556 Wine Cluster Ct, Grayson, GA 30017
$-527
Cash flow
-6.3%
Cash-on-Cash Return
4.7%
Cap rate
0.7%
Rent to Value Ratio
Active
$389,900
4
bds
|
3
ba
|
1,728
sqft
|
built
1975
2531 Falcon Ridge Dr, Grayson, GA 30017
$-833
Cash flow
-11.1%
Cash-on-Cash Return
3.6%
Cap rate
0.6%
Rent to Value Ratio
Active
$417,000
5
bds
|
3
ba
|
3,401
sqft
|
built
2006
2108 Cutleaf Creek Rd, Grayson, GA 30017
$-1,012
Cash flow
-12.7%
Cash-on-Cash Return
3.2%
Cap rate
0.6%
Rent to Value Ratio
Active
$399,900
4
bds
|
3
ba
|
2,720
sqft
|
built
2006
2130 Cooper Lakes Dr, Grayson, GA 30017
$-681
Cash flow
-8.9%
Cash-on-Cash Return
4.1%
Cap rate
0.7%
Rent to Value Ratio
Active
$439,900
4
bds
|
3
ba
|
2,606
sqft
|
built
2021
554 Everton Pl, Grayson, GA 30017
$-897
Cash flow
-10.6%
Cash-on-Cash Return
3.7%
Cap rate
0.6%
Rent to Value Ratio
Active
$779,000
6
bds
|
5
ba
|
6,782
sqft
|
built
1993
1430 Roanoke Trce, Grayson, GA 30017
$-2,507
Cash flow
-16.8%
Cash-on-Cash Return
2.3%
Cap rate
0.4%
Rent to Value Ratio
Active
$450,000
4
bds
|
3
ba
|
2,806
sqft
|
built
2003
1844 Sosebee Farm Rd, Grayson, GA 30017
$-872
Cash flow
-10.1%
Cash-on-Cash Return
3.8%
Cap rate
0.6%
Rent to Value Ratio
Active
$399,900
4
bds
|
3
ba
|
2,253
sqft
|
built
1999
2249 Cluster Ln, Grayson, GA 30017
$-825
Cash flow
-10.8%
Cash-on-Cash Return
3.7%
Cap rate
0.6%
Rent to Value Ratio
Active
$415,000
3
bds
|
2
ba
|
1,562
sqft
|
built
1986
1099 Westwood Pl, Grayson, GA 30017
$-935
Cash flow
-11.8%
Cash-on-Cash Return
3.4%
Cap rate
0.5%
Rent to Value Ratio
Active
$484,900
6
bds
|
5
ba
|
5,675
sqft
|
built
2006
410 Chandler Bluff Ct, Grayson, GA 30017
$-978
Cash flow
-10.5%
Cash-on-Cash Return
3.7%
Cap rate
0.7%
Rent to Value Ratio
Active
$530,000
5
bds
|
4
ba
|
4,551
sqft
|
built
2002
122 Sweet Branch Ct, Grayson, GA 30017
$-1,243
Cash flow
-12.2%
Cash-on-Cash Return
3.3%
Cap rate
0.6%
Rent to Value Ratio
Active
$588,000
6
bds
|
5
ba
|
6,058
sqft
|
built
1995
2520 Cobble Creek Ln, Grayson, GA 30017
$-1,571
Cash flow
-13.9%
Cash-on-Cash Return
2.9%
Cap rate
0.5%
Rent to Value Ratio

Active
$459,900
4
bds
|
3
ba
|
2,718
sqft
|
built
2006
541 Pine Grove Ave, Grayson, GA 30017
$-743
Cash flow
-8.4%
Cash-on-Cash Return
4.2%
Cap rate
0.6%
Rent to Value Ratio

Active
$649,000
4
bds
|
4.5
ba
|
4,821
sqft
|
built
2000
917 Mount Mc Kinley Way, Grayson, GA 30017
$-1,520
Cash flow
-12.2%
Cash-on-Cash Return
3.3%
Cap rate
0.6%
Rent to Value Ratio

Active
$484,900
5
bds
|
3
ba
|
0
sqft
|
built
2014
345 Mc Kenzie Grace Ln, Grayson, GA 30017
$-1,318
Cash flow
-14.2%
Cash-on-Cash Return
2.9%
Cap rate
0.6%
Rent to Value Ratio