
$2,558,000
Investment Summary
We noticed that property taxes are missing—this is a standard expense and should be considered in your estimate.
- Monthly Cash Flow
- -$7,277
- Cap Rate
- 2.7%
- Cash-on-Cash Return
- -14.8%
- Debt Coverage Ratio
- 0.44
- Internal Rate of Return (5 years)
- -10.4%
Cash Flow
Net Operating Income (NOI) minus mortgage payments.
Calculation:
NOI - Mortgage Payments
Cap Rate (Market Value)
Capitalization Rate is a rate of return that compares the yearly Net Operating Income (NOI) to the market value.
Calculation:
NOI / Market Value
Cash-on-Cash Return (CoC)
Annual Cash Flow / Cash Invested
Calculation:
Annual cash flow divided by initial cash invested.
Debt Coverage Ratio (DCR)
Net Operating Income (NOI) divided by total debt payments.
Calculation:
NOI / Total Debt Payments
Internal Rate of Return (IRR)
A metric for assessing profitability over time. IRR is the discount rate at which the net present value (NPV) of all future cash flows (positive and negative) from an investment equals zero — including both periodic cash flow (such as rent) and a projected sale at the end of the holding period. It represents the expected annualized return, accounting for income, expenses, and the recovery of capital through a future sale.
Property Description
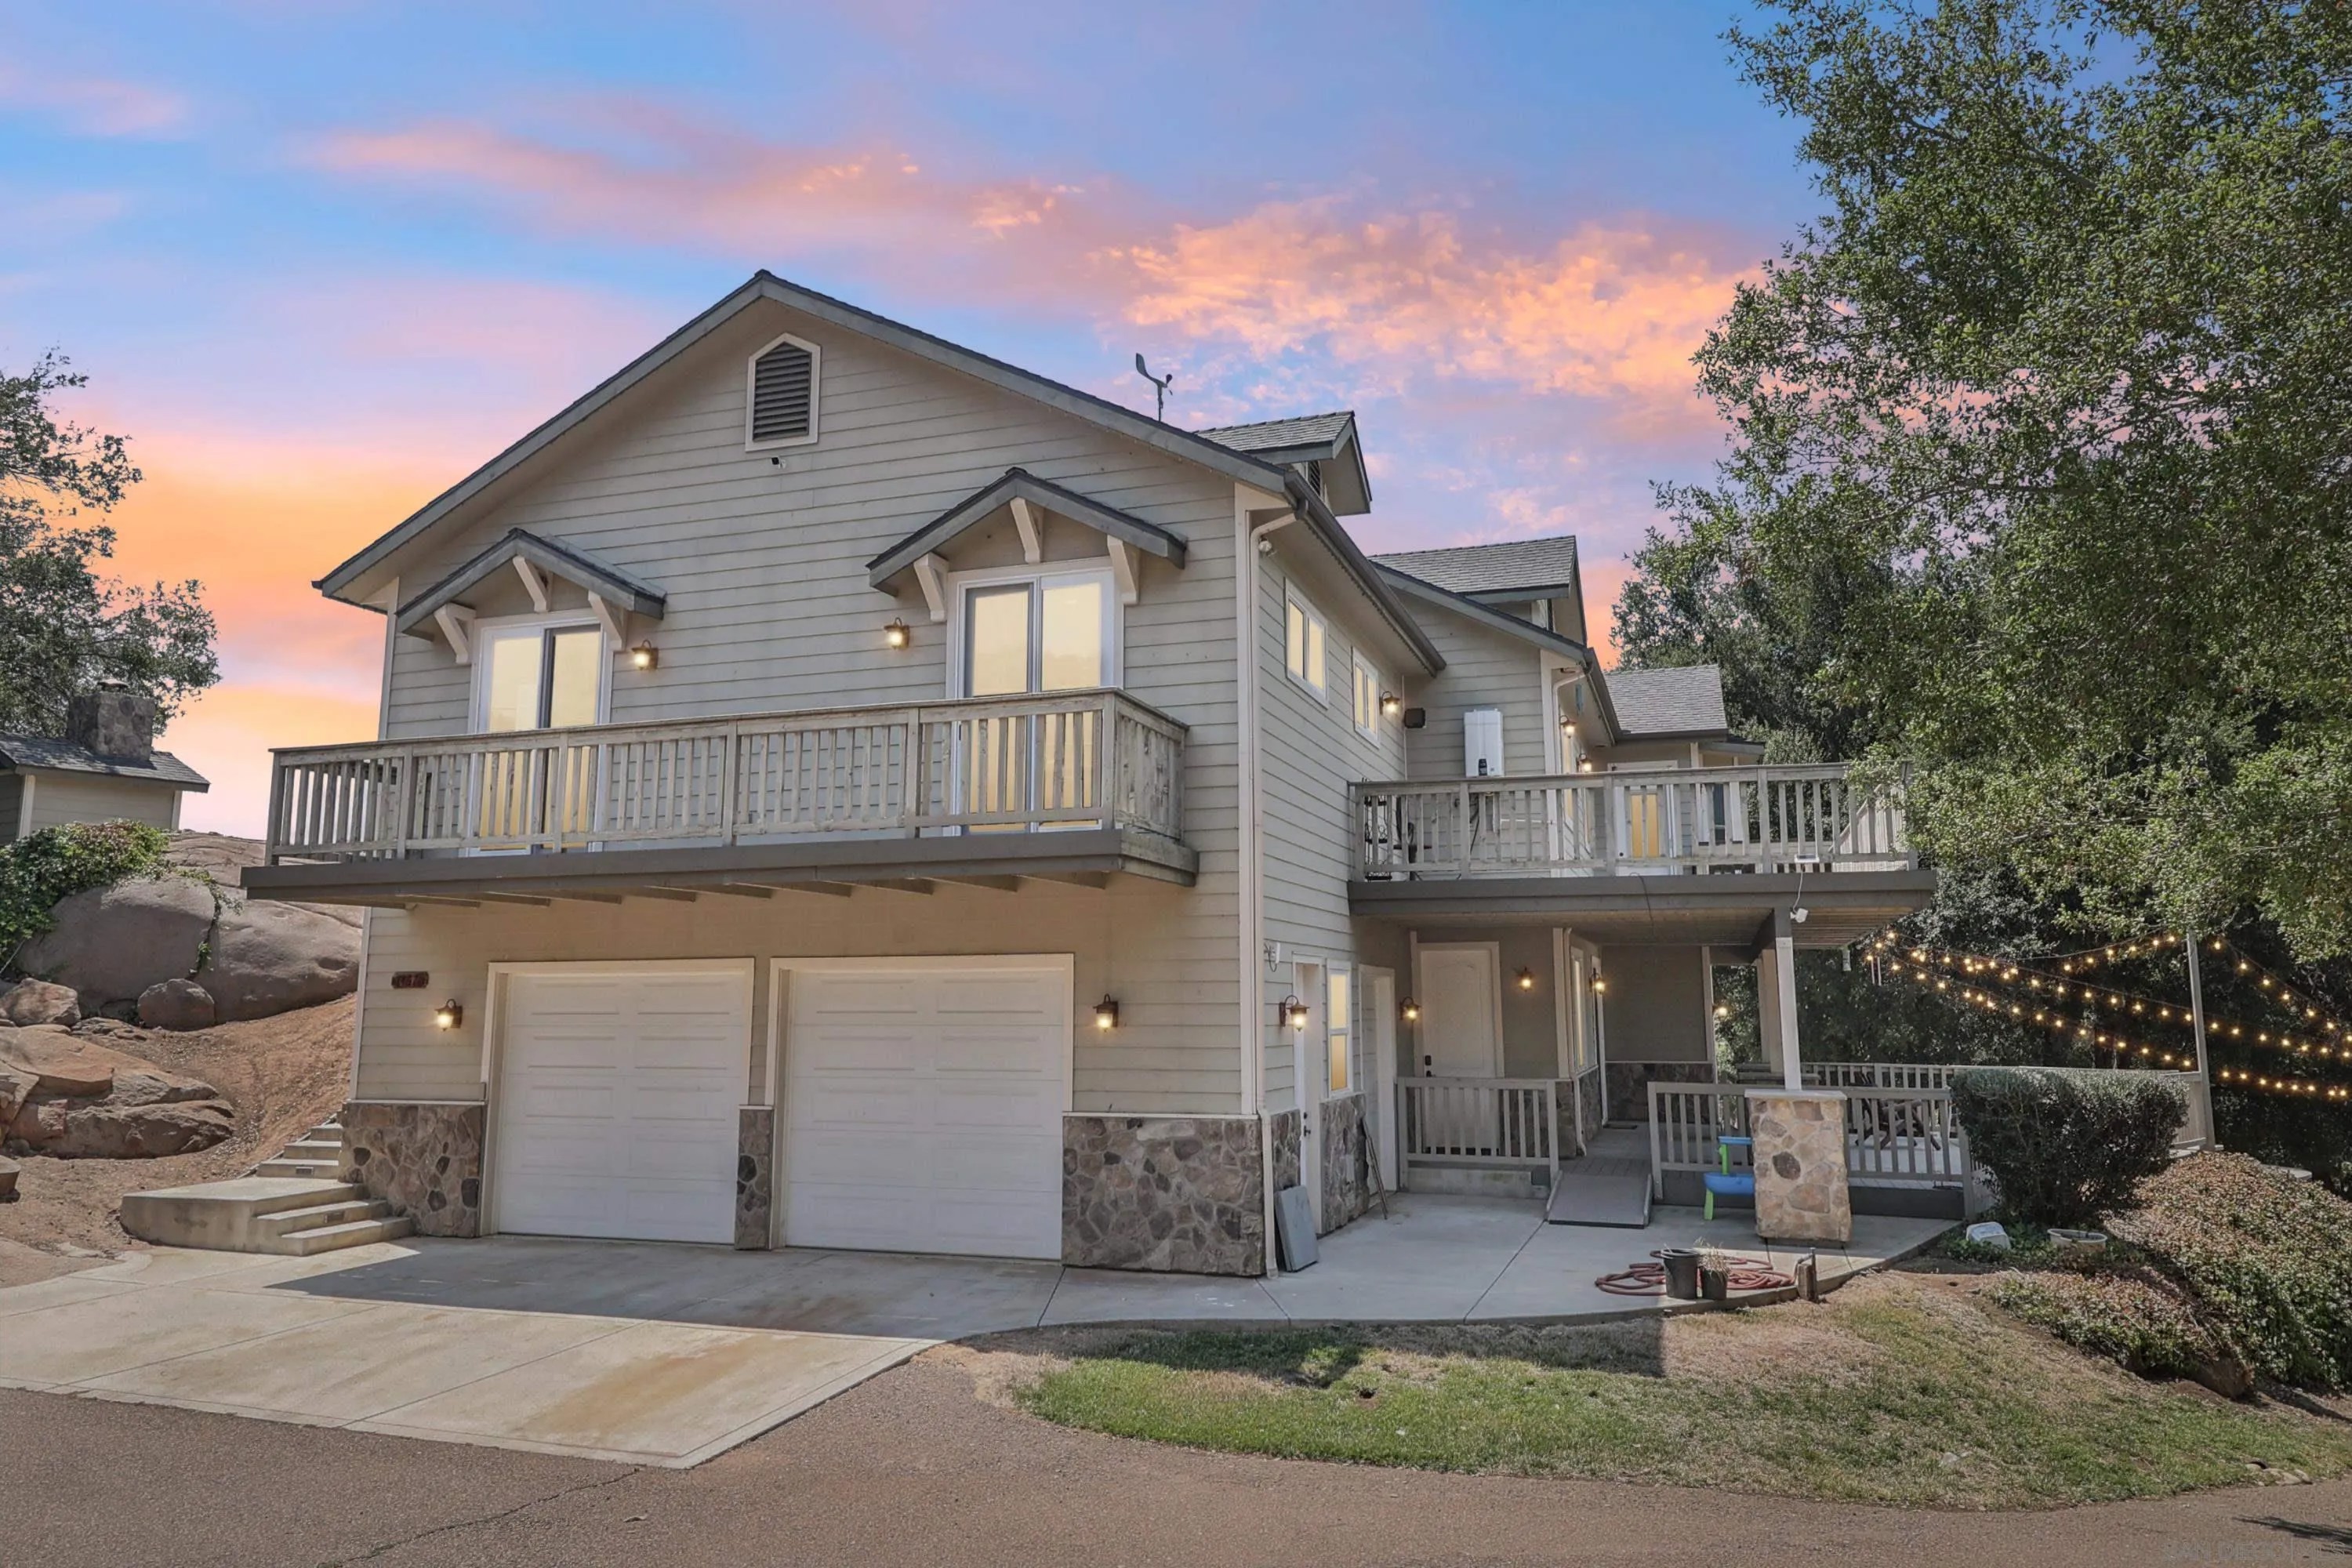
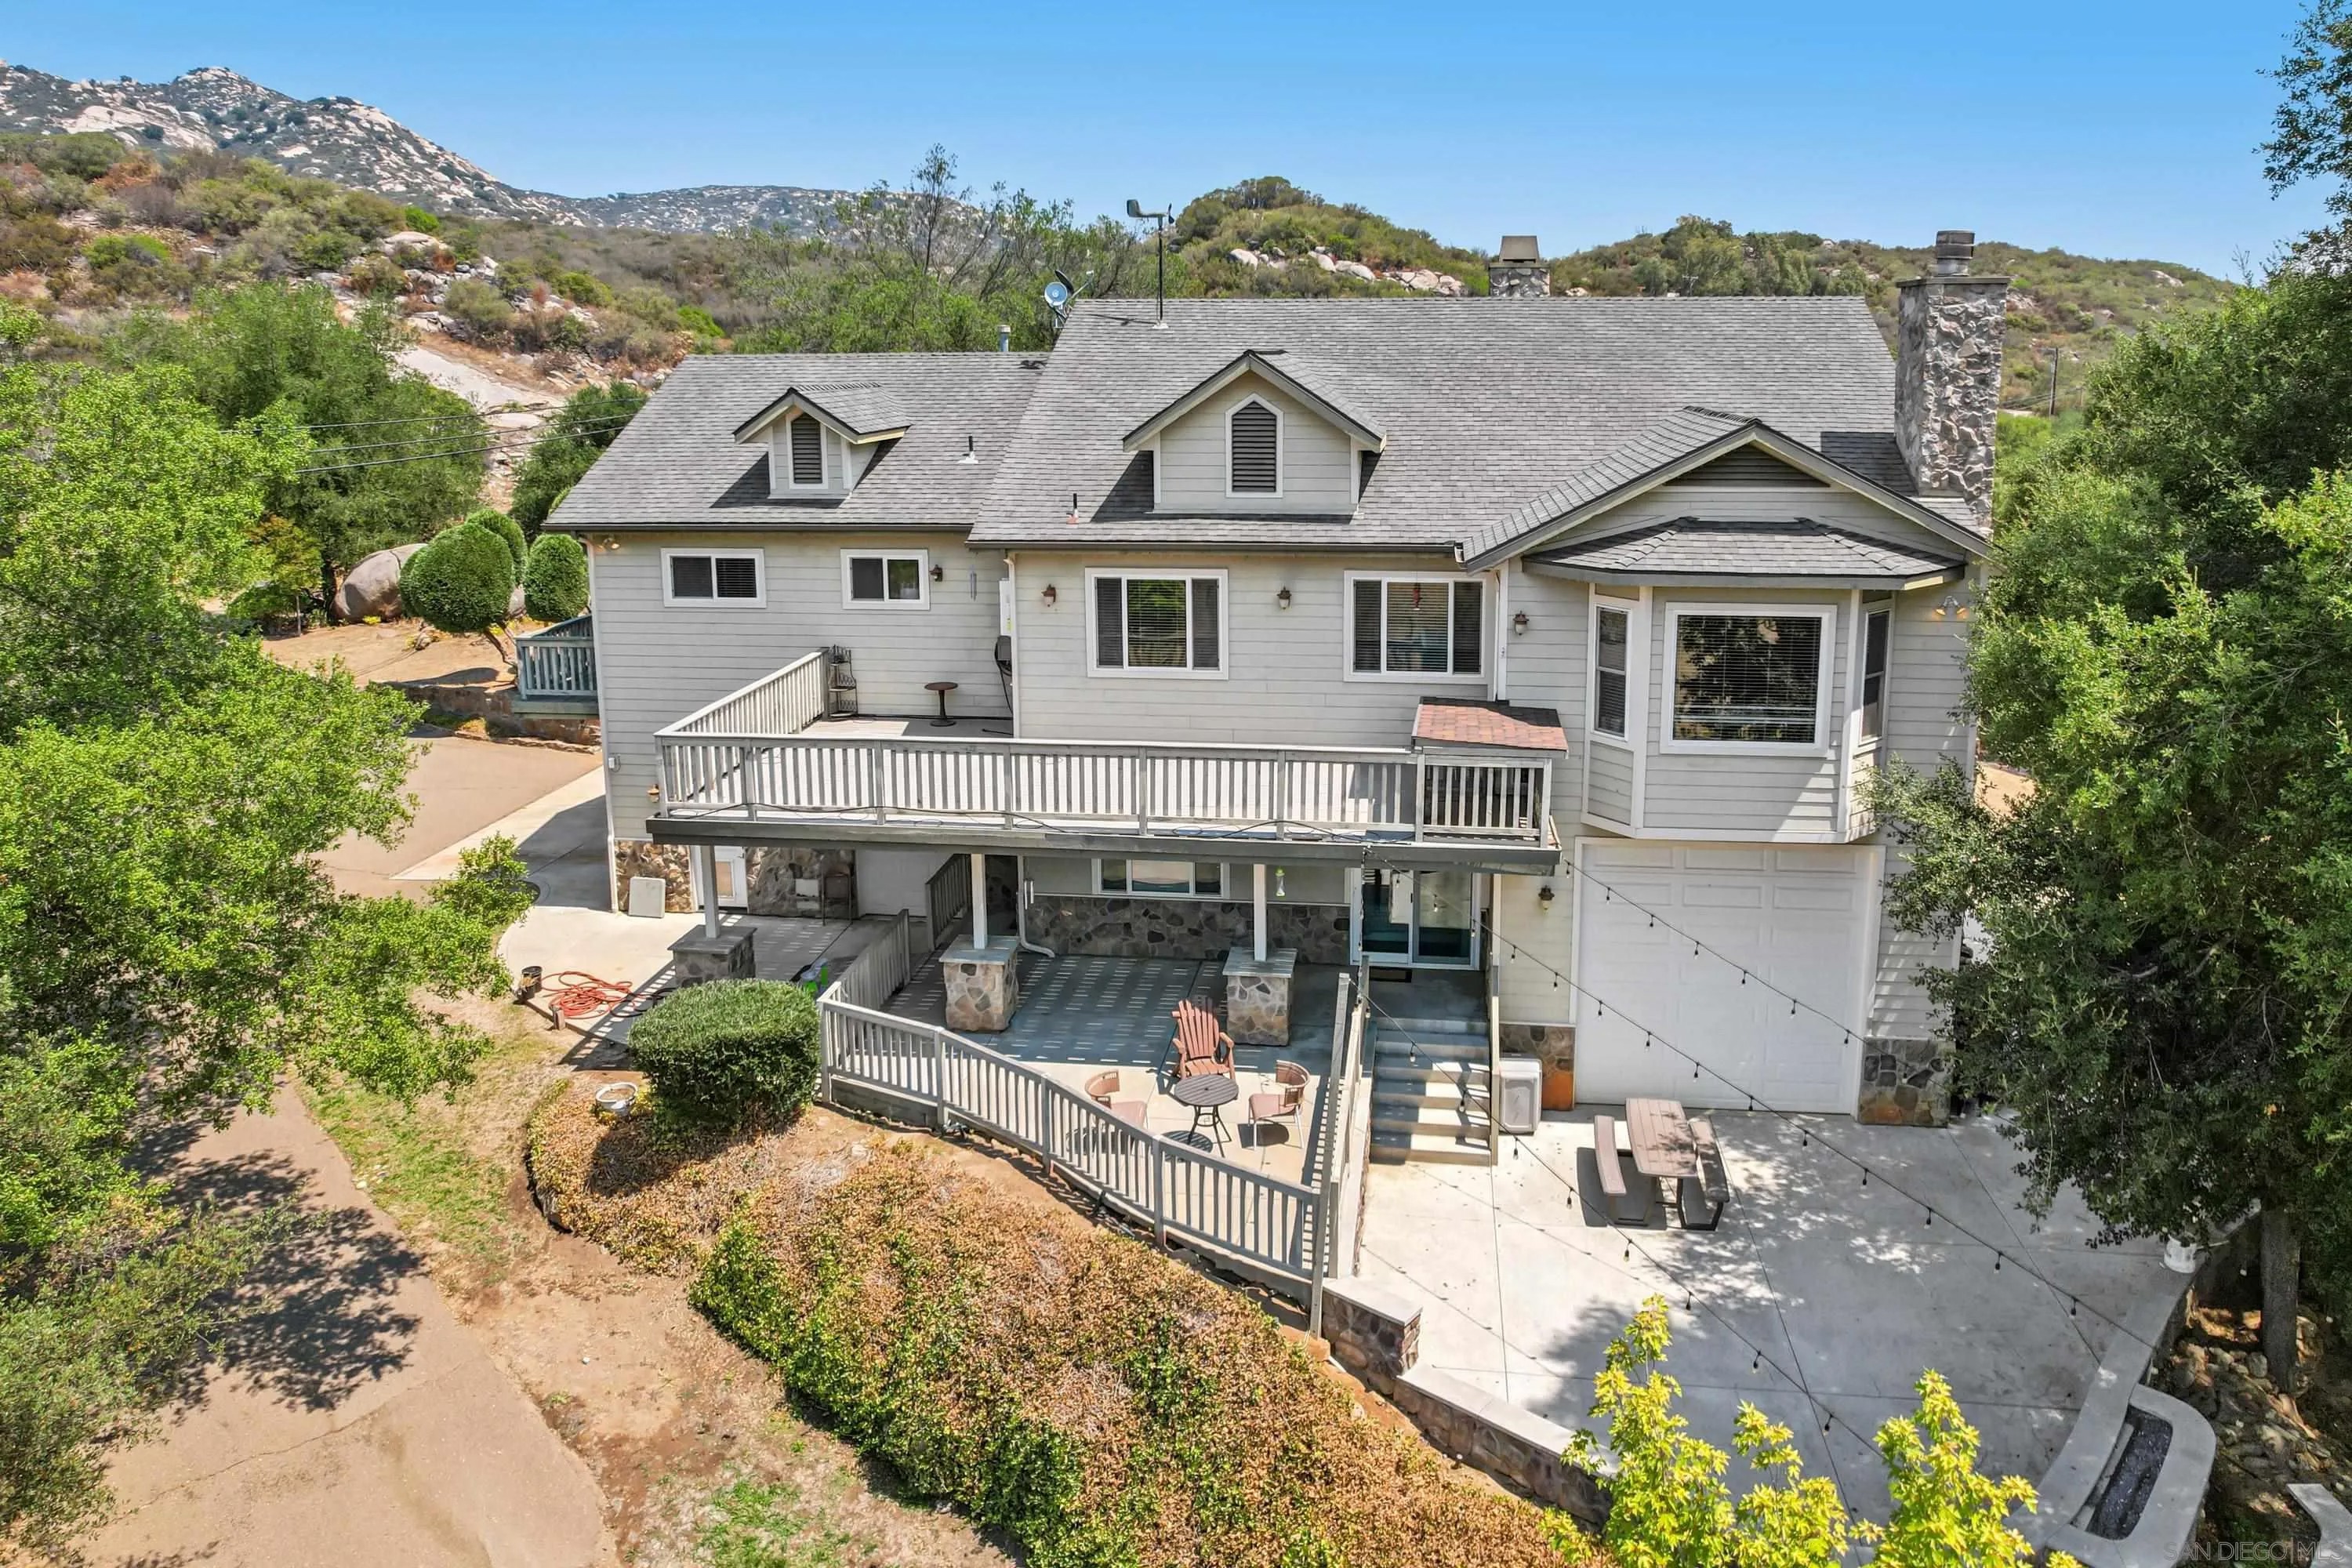
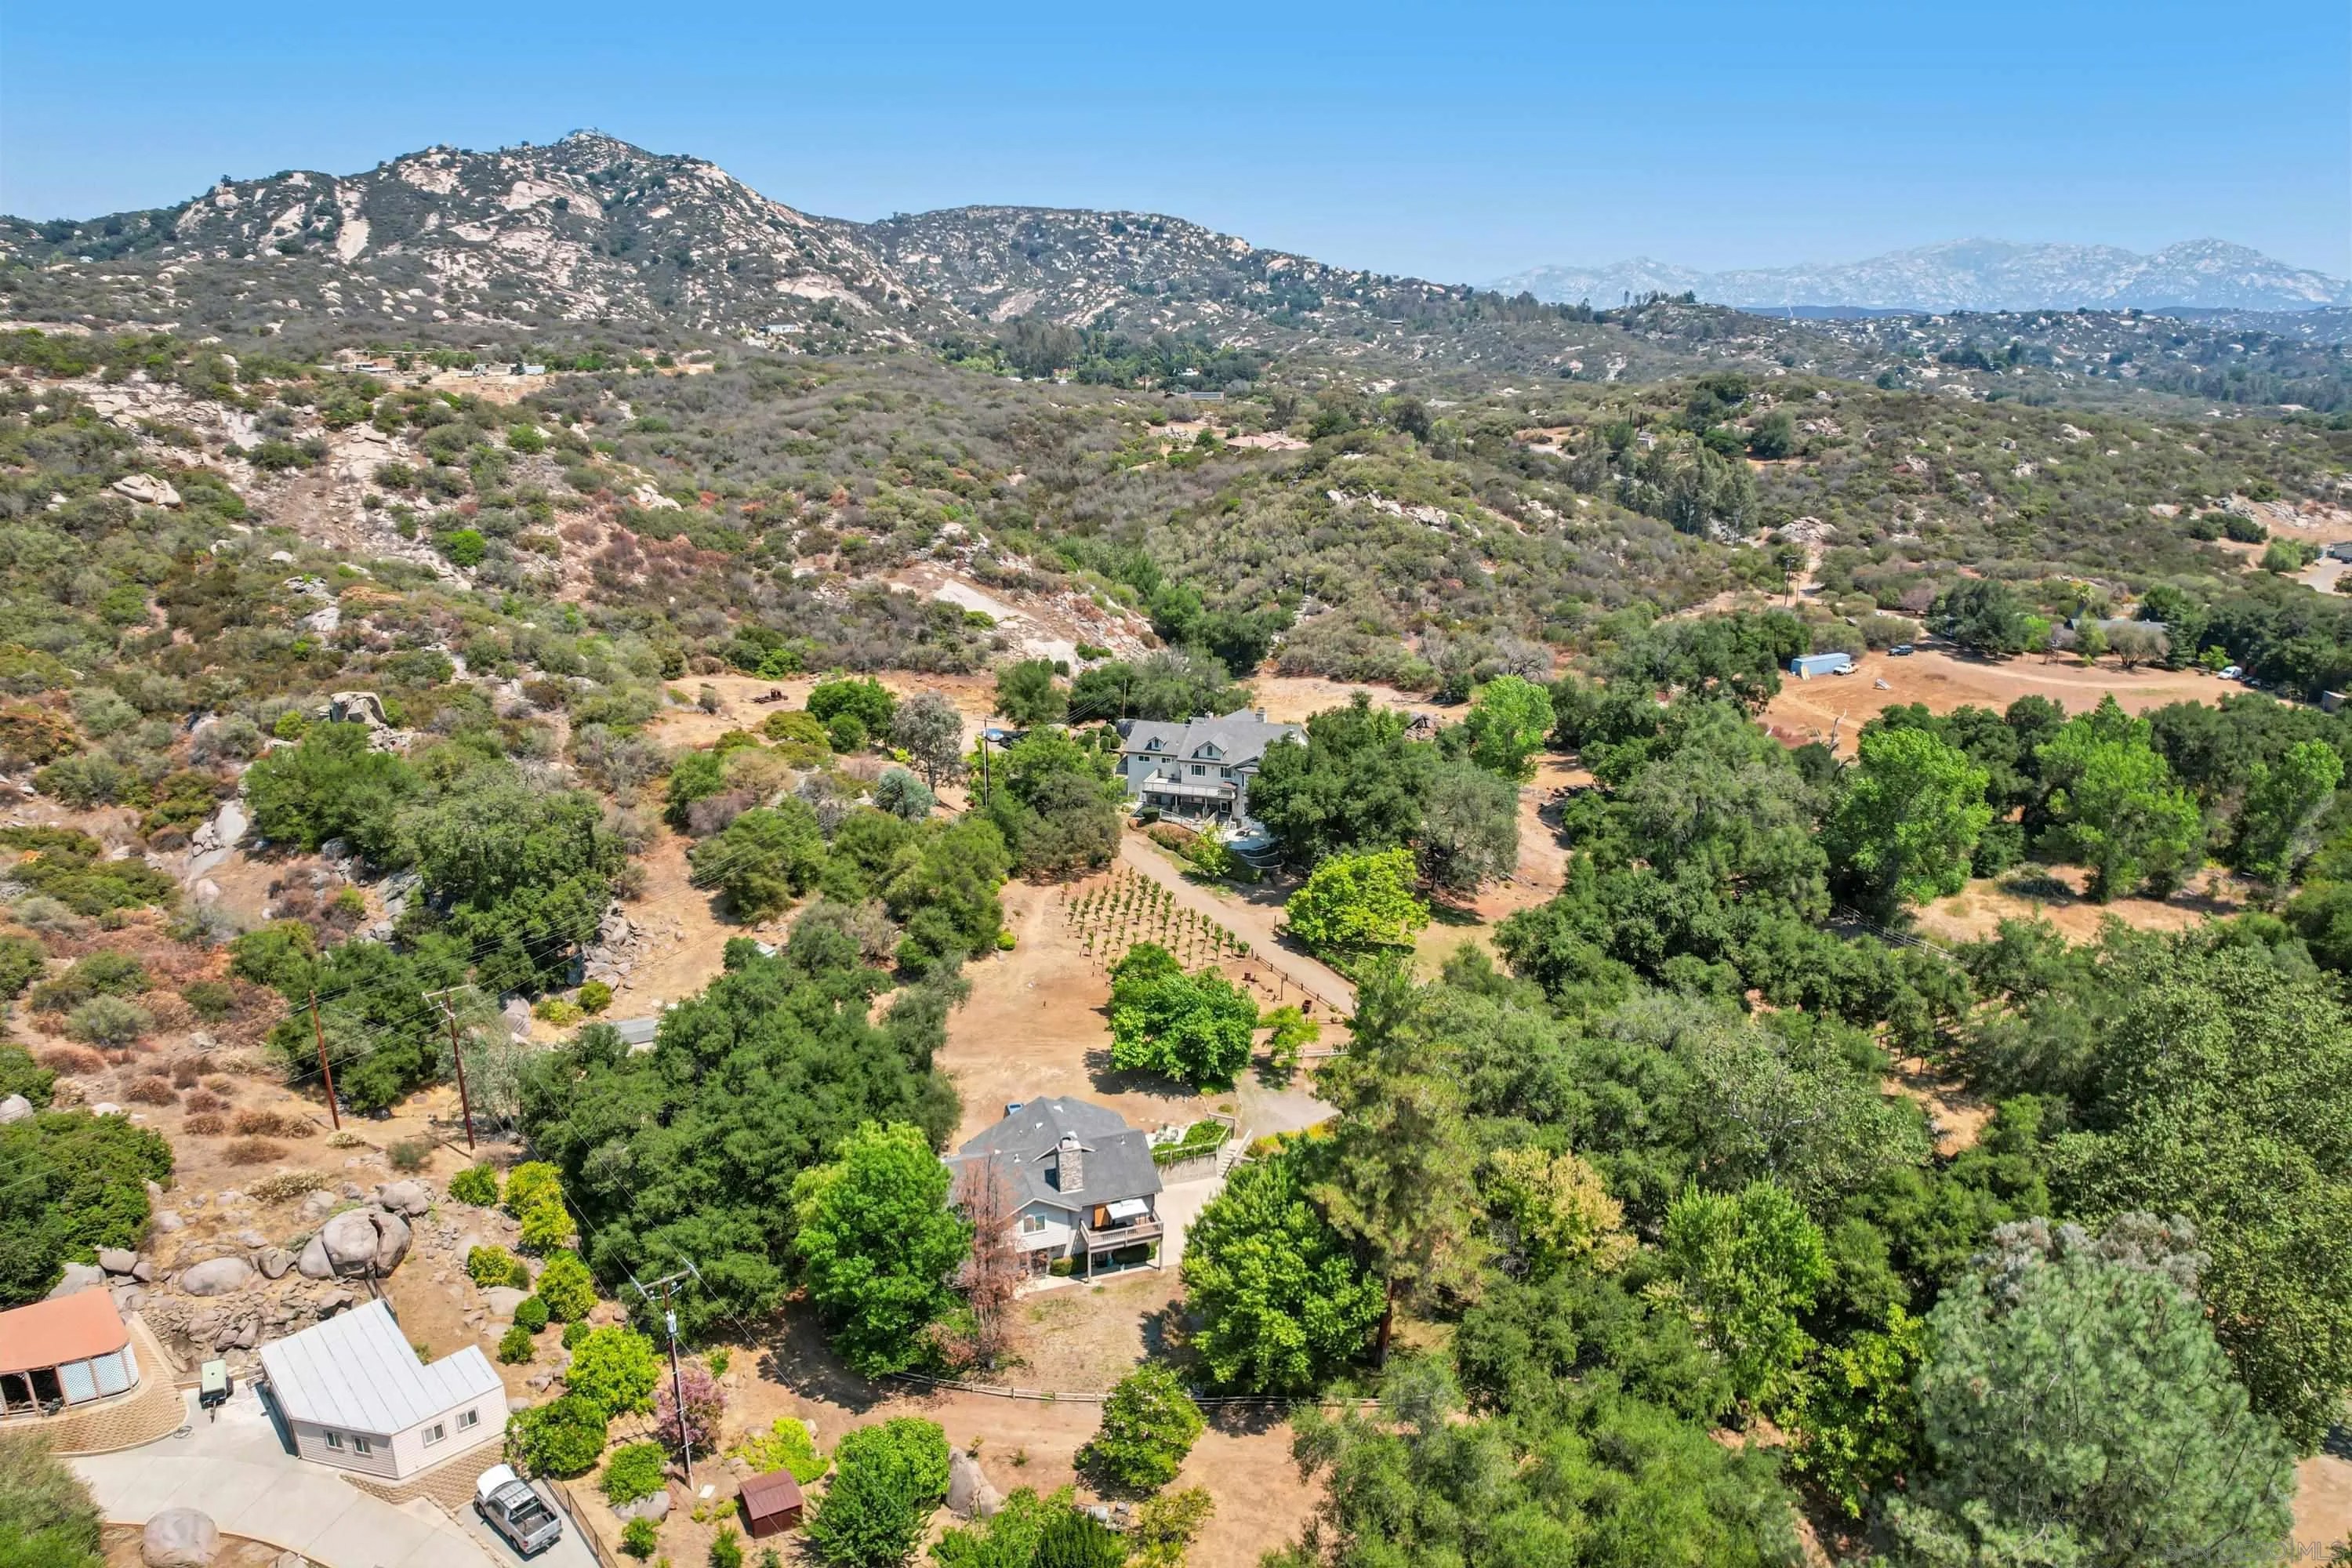
Welcome to Seven Meadows in beautiful Ramona. Surround yourself in the beauty of nature with majestic oak trees, a seasonal stream, and serene mountain views. As you enter this retreat-like residence, you are greeted by 2 vineyards, a fruit orchard and a bridge over the stream, leading up to the two residences. The main home is 3BR/2BA and lives like a single level luxury cabin. Vaulted beamed ceilings, wood floors, stone accents and a floor to ceiling stone fireplace. The kitchen blends with knotty pine cabinetry, stainless steel appliances and two breakfast bars with seating for 8, plus a walk-in pantry. The primary bedroom suite is located on the opposite site and features a sliding glass door to the patio with built in BBQ, pizza oven, firepit and portable spa. There are two walk in closets and a luxurious bathroom. The other wing of the home offers two bedrooms, each with access to a view deck, and sharing a beautifully appointed bathroom. There is also a full size laundry with plenty of storage! Downstairs is the attached 1BR/1BA apartment, 2-car garage and RV garage. RV garage is approx.. 23x17 with a 13x16 room behind including half bath and 220 power. The 11+ acres whisk you into a lifestyle filled with nature. With over 50 oak trees, natural rock outcroppings, you will be greeting daily by wildlife including deer. There are 3 vineyards. The previous owner was a wine maker and yielded over 3000 lbs of grapes between the different varieties: Zinfandel, Tempranillo, Syrah, Grenache and Mourvedre. See Supplement Vines are watered by a well. Approx. 500 Vines total. The property is also ideal for multi generational living, or perfect for an investment. There is one additional home that includes two units. A 3BR/2BA on the top floor, and a 2BR/2BA on the bottom floor. Approx. 2900 SF between the two units, plus a garage. Rental income is currently over $5000/mo for the two units. Tenants are on a month to month. There is just one water meter between all the homes, however, Ramona Water District can add a second meter, for a fee of approx.. $25k. There is plenty of room for horses, livestock and more. Behind the main residence are two additional cleared sites that could be ideal for animals, workshop etc. In addition, there is a RV pad with full hook ups that was previously rented for $1500/mo. Chicken coop, several sheds, rustic accents, lush lawn, approx.. 125 fruit trees completed this perfect retreat. Located on the west end of Ramona for easy commute and close to Dos Picos park for hiking and camping. Seller is in the process of completing another airBnB unit in the oak trees. 1BR with view deck and bathroom, approx.. 120 Sf.
Build Your Team
Quickly find investor-friendly professionals who can help you succeed in real estate investing at any stage of the investing journey.


Agents
Match with investor-friendly agents who can help you find, analyze, and close your next deal


Lenders
Get the best funding…find investor-friendly lenders who specialize in your deal strategy


Property Managers
Transition to passive investing. Find a trusted property management partnership that lasts.


Tax Pros & Accountants
Taxes and financial reporting made easy—find experts to create tax savings strategies, file taxes, and more
Location
Property Details
Parking
- Description: Driveway, Garage
- Details: Attached
- Garage Spaces: 2
- Spaces Total: 22
Bedroom Information
- # of Bedrooms: 9
Bathroom Information
- # of Baths (Full): 6
- # of Baths (Partial): 1
- # of Baths (Total): 6.0
Interior Features
- # of Stories: 2
- Fireplace: Yes
Exterior Features
- Roof Material: Concrete
Land Information
- Land Use: Residential
- Land Use Subtype: Single Family Residential
Lot Information
- Parcel ID: 3270108000
- Lot Size: 0 sqft
Property Information
- Property Type: Single Family Residence
- Style: Craftsman, Ranch
- Year Built: 2008
Tax Information
- Annual Tax: $0
Utilities
- Heating: Forced Air, Propane
- Cooling: Central Air
Location
- County: San Diego
Listing Details
Investment Summary
We noticed that property taxes are missing—this is a standard expense and should be considered in your estimate.
- Monthly Cash Flow
- -$7,277
- Cap Rate
- 2.7%
- Cash-on-Cash Return
- -14.8%
- Debt Coverage Ratio
- 0.44
- Internal Rate of Return (5 years)
- -10.4%
Cash Flow
Net Operating Income (NOI) minus mortgage payments.
Calculation:
NOI - Mortgage Payments
Cap Rate (Market Value)
Capitalization Rate is a rate of return that compares the yearly Net Operating Income (NOI) to the market value.
Calculation:
NOI / Market Value
Cash-on-Cash Return (CoC)
Annual Cash Flow / Cash Invested
Calculation:
Annual cash flow divided by initial cash invested.
Debt Coverage Ratio (DCR)
Net Operating Income (NOI) divided by total debt payments.
Calculation:
NOI / Total Debt Payments
Internal Rate of Return (IRR)
A metric for assessing profitability over time. IRR is the discount rate at which the net present value (NPV) of all future cash flows (positive and negative) from an investment equals zero — including both periodic cash flow (such as rent) and a projected sale at the end of the holding period. It represents the expected annualized return, accounting for income, expenses, and the recovery of capital through a future sale.
Purchase Details
Purchase PriceThe price paid for the property. Purchase price:
| $2,558,000 |
|---|---|
Amount FinancedThe amount of the purchase financed through a loan. Amount financed:
| -$2,046,400 |
Down paymentThe initial payment made towards the purchase. Down payment:
| $511,600 |
Closing CostsFees and expenses associated with purchasing a property, typically ranging from 2% to 5% of the home’s purchase price, paid at the end of a home purchase to cover services like lending, title transfer, and taxes. Closing costs:
| $76,740 |
Rehab CostsCosts incurred to repair or improve the property, including: roof, flooring, exterior siding, kitchen, exterior paint, bathrooms, etc. Rehab costs:
| $0 |
Initial Cash InvestedThe total initial cash invested in the property. Calculation:Down payment + Buying costs + Rehab costs Initial cash invested:
| $588,340 |
Square Feet (SQFT)The total square footage of the property. Square feet:
| 6,182 |
Cost Per Square FootCost per square foot of the property. Calculation:Purchase Price / Square Feet Cost per square foot:
| $414 |
Monthly Rent Per Square FootMonthly rent divided by the number of square feet. This ratio helps investors compare rental income efficiency across properties, markets, and unit sizes Calculation:Monthly Rent / Square Feet Monthly rent per square foot:
| $1.33 |
Financing Details
Loan AmountThe total sum of money borrowed from a lender to finance a property purchase. Calculation:Purchase Price - Down Payment
Loan amount:
| $2,046,400 |
|---|---|
Loan to Value Ratio (LTV)Loan amount divided by the market value of the property. Calculation:Loan Amount / Market Value
Loan to value ratio:
| 80.0% |
Loan TypeThe type of loan (e.g., fixed, adjustable).
Loan type:
| Amortizing |
TermThe loan repayment period in years.
Term:
| 30 years |
Interest RateThe percentage a lender charges on the borrowed amount of a loan, determining the cost of borrowing money.
Interest rate:
| 6.500% |
Principal & Interest (PI)The principal is the portion of the loan payment that reduces the loan balance. The interest is the lender's charge for borrowing money. Calculation:(P * r * (1 + r) ** n) / ((1 + r) ** n - 1) Where:
P = Loan amount (principal)
Principal & interest:
| $12,935 |
Property TaxesAnnual taxes levied by local governments on real estate properties. These taxes fund public services like schools, roads, and emergency services.
Property tax:
| $0 |
InsuranceThe costs for insurance coverage to protect against financial losses due to risks like fire, natural disasters, theft, liability, or tenant-related damages. Calculation:Assumes 7% of gross rental income, unless insurance rates are specified.
Insurance:
| $574 |
Private Mortgage Insurance (PMI)A fee that borrowers pay when they take out a conventional loan with a loan-to-value (LTV) ratio above 80%.
Private mortgage insurance (PMI):
| $0 |
Monthly PaymentThe fixed amount a borrower pays each month to repay a loan. It typically includes principal and interest (P&I) and may also cover property taxes, insurance, HOA fees, and PMI if escrowed. Monthly payment:
| $13,509 |
Operating Income
| % Rent | Monthly | Yearly | |
|---|---|---|---|
Gross RentThe total rental income received from tenants before deducting any expenses. Includes base rent, late fees, pet fees, parking fees, and other recurring charges.
Gross rent:
| $8,200 | $98,400 | |
Vacancy LossExpected loss of rent due to vacancies.
Vacancy loss:
(6%)
| 6% | -$492 | -$5,904 |
Operating IncomeGross rental income minus vacancy loss. Calculation:Gross rent - Vacancy loss
Operating income:
| $7,708 | $92,496 |
Operating Expenses
| % Rent | Monthly | Yearly | |
|---|---|---|---|
Property TaxesAnnual taxes levied by local governments on real estate properties. These taxes fund public services like schools, roads, and emergency services.
We noticed that property taxes are missing—these are standard expenses and should be considered in your estimate. | n/a | n/a | n/a |
InsuranceThe costs for insurance coverage to protect against financial losses due to risks like fire, natural disasters, theft, liability, or tenant-related damages. Calculation:Assumes 7% of gross rental income, unless insurance rates are specified. | 7% | -$574 | -$6,888 |
Property ManagementThe costs associated with hiring a property manager to handle the day-to-day operations of a rental property. Includes management fees, leasing fes, eviction fees, etc. Calculation:Assumes 8% of gross rental income. | 8% | -$656 | -$7,872 |
Repairs & MaintenanceOngoing costs for routine upkeep and minor fixes needed to keep a property in good working condition. Calculation:Assumes 5% of gross rental income. Varies by property age and condition. | 5% | -$410 | -$4,920 |
Capital ExpensesLarge, infrequent costs for major improvements or replacements, like a new roof, HVAC system, or appliances. Calculation:Assumes 5% of gross rental income. Varies by property age. | 5% | -$410 | -$4,920 |
HOA FeesRegular dues paid to a Homeowners Association for community maintenance, amenities, and management. Similar fees include: Condo Association Fees, Co-op Maintenance Fees, etc. | n/a | n/a | n/a |
Operating ExpensesRecurring costs required to maintain and manage a rental property, including property taxes, insurance, maintenance, repairs, utilities (if paid by the owner), property management fees, and other day-to-day expenses. Calculation:Insurance + Property Taxes + Property Management + Repairs & Maintenance + Capital Expenditures + HOA Fees | 25% | -$2,050 | -$24,600 |
Cash Flow
| Monthly | Yearly | |
|---|---|---|
Net Operating Income (NOI)The income generated from a property after deducting all operating expenses but before deducting mortgage payments, taxes, and capital expenditures. Calculation:Gross Operating Income - Operating Expenses
Net operating income:
| $5,658 | $67,896 |
Mortgage PaymentThe fixed amount a borrower pays each month to repay a loan. It typically includes principal and interest (P&I) and may also cover property taxes, insurance, HOA fees, and PMI if escrowed. | -$12,935 | -$155,220 |
Cash FlowNet Operating Income (NOI) minus mortgage payments. Calculation:NOI - Mortgage Payments | $7,277 | $87,324 |