

$1,150,000
Investment Summary
- Monthly Cash Flow
- -$1,626
- Cap Rate
- 4.5%
- Cash-on-Cash Return
- -7.4%
- Debt Coverage Ratio
- 0.72
- Internal Rate of Return (5 years)
- -3.2%
Cash Flow
Net Operating Income (NOI) minus mortgage payments.
Calculation:
NOI - Mortgage Payments
Cap Rate (Market Value)
Capitalization Rate is a rate of return that compares the yearly Net Operating Income (NOI) to the market value.
Calculation:
NOI / Market Value
Cash-on-Cash Return (CoC)
Annual Cash Flow / Cash Invested
Calculation:
Annual cash flow divided by initial cash invested.
Debt Coverage Ratio (DCR)
Net Operating Income (NOI) divided by total debt payments.
Calculation:
NOI / Total Debt Payments
Internal Rate of Return (IRR)
A metric for assessing profitability over time. IRR is the discount rate at which the net present value (NPV) of all future cash flows (positive and negative) from an investment equals zero — including both periodic cash flow (such as rent) and a projected sale at the end of the holding period. It represents the expected annualized return, accounting for income, expenses, and the recovery of capital through a future sale.
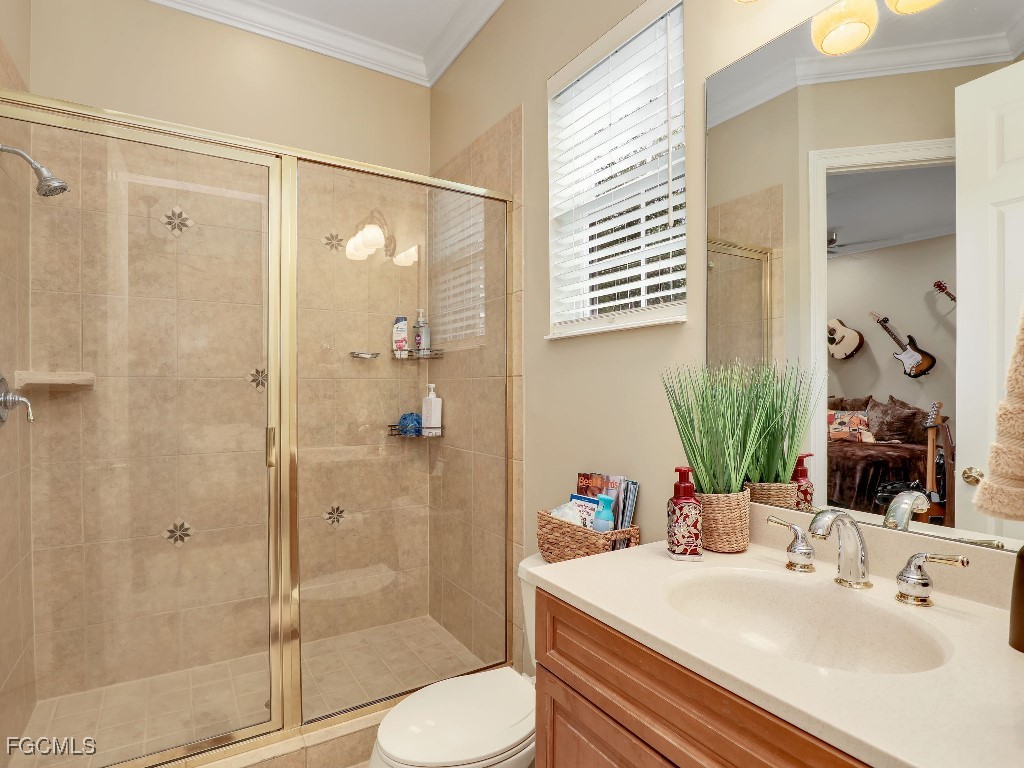
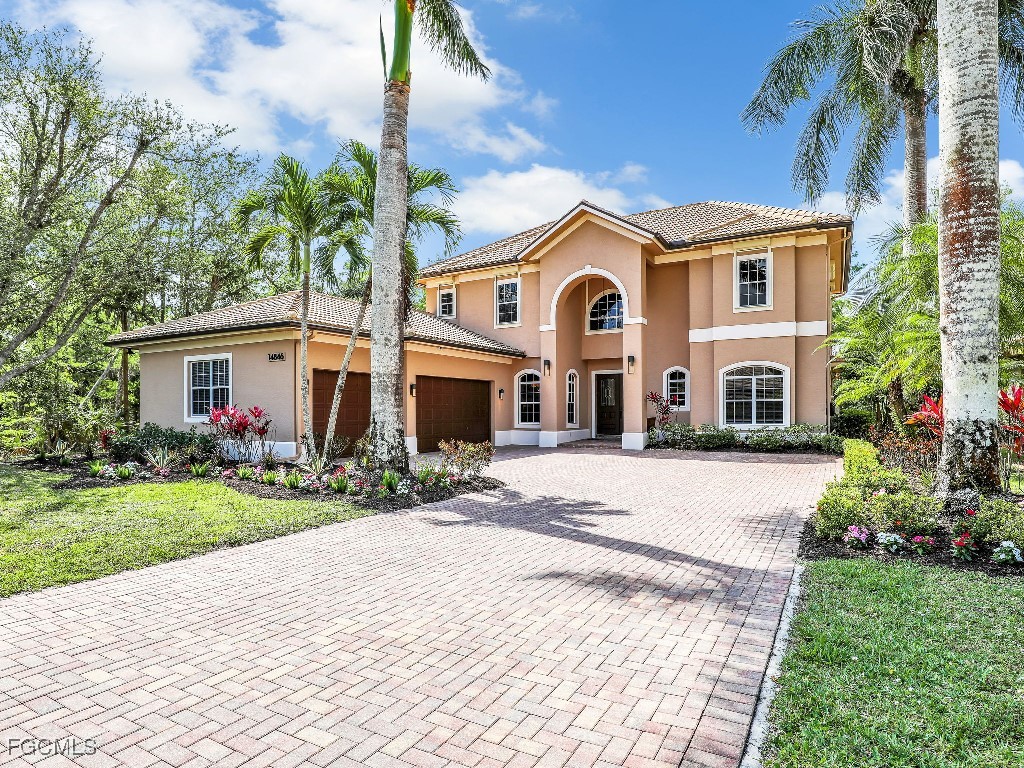
Property Description
Welcome Home to Indigo Lakes Preserve! Largest lot in Indigo Lakes, backs to preserve on three sides, abundant wildlife outside your kitchen window, meticulously maintained and updated inside and out, oversized three car garage with mini-split, updated stainless steel refrigerator and double ovens. *Don’t forget to see video* Owners selling the house fully furnished. One-of-a-kind nature lover’s dream home sits perfectly situated on the largest, most private lot in the gated community of Indigo Lakes. This meticulously maintained and upgraded 5 bedroom, 4.5 bath home w/office is turn-key ready for its next extended family. Custom crafted by Diamond Builders, it’s nearly 4,000sf of sunlit open spaces and is perfect for entertaining guests or simply enjoying the abundant wildlife in peace and quiet. The first floor offers a master bedroom with large ensuite bath, two walk-in his/her closets, private door leading to the heated pool/spa, a private office/den, half-bath, and another full bath. Upstairs features 4 bedrooms and 2 full Jack-and-Jill bathrooms plus a large bonus room for kids to enjoy gaming, reading, or relaxing with neighborhood friends. Throughout the house there are custom closet and pantry solutions (2022) which maximize space and efficient living. One of the best features of this home is the abundant wildlife outside your kitchen window including deer, rabbits, squirrels, birds, and the occasional turkey! There are three mature, Indian mango trees and a sapote fruit tree with plenty of additional space for your vegetable/herb garden. Another standout feature of this home is your almost half-acre property line extends out across the “street” (see aerial photo with lot lines). No more driveway car shuffle; you can comfortably park up to 8 vehicles! Previous owners had a new roof installed in 2018 as well as roll-down hurricane shutters on the second floor and hanging panel shutters on the first floor. Current owners have invested in significant upgrades and repairs since 2021 including new 80-gallon hybrid water heater in 2023, new carpet throughout in 2022, new gutters with GutterGuards in 2023, new LED lighting throughout in 2023, crown molding in every room 2023, insulated garage with mini-split in 2024, new ADT security system with eight outdoor cameras in 2022, whole-house generator hookup in 2024, additional refrigerator and ice chest in garage 2024, and much more. Detailed list of upgrades, repairs, and costs is available on request. Located minutes to grocery shopping, restaurants and in a top-rated school district including walkable community gated access to A-rated Oak Ridge Middle School. This family-friendly gated community has low HOA fees and includes cable, internet, and irrigation. Amenities include clubhouse, community pool, fitness center, basketball and tennis courts, and a new children’s playground. Buyers will be asked to provide a financial qualification letter prior to showing.
Build Your Team
Quickly find investor-friendly professionals who can help you succeed in real estate investing at any stage of the investing journey.


Agents
Match with investor-friendly agents who can help you find, analyze, and close your next deal


Lenders
Get the best funding…find investor-friendly lenders who specialize in your deal strategy


Property Managers
Transition to passive investing. Find a trusted property management partnership that lasts.


Tax Pros & Accountants
Taxes and financial reporting made easy—find experts to create tax savings strategies, file taxes, and more
Location
Property Details
Parking
- Details: Attached, Driveway, Garage, Paved, Garage Door Opener
- Garage Spaces: 3
- Spaces Total: 0
Bedroom Information
- # of Bedrooms: 5
Bathroom Information
- # of Baths (Full): 4
- # of Baths (Total): 5.0
Interior Features
- # of Rooms: 3
- # of Stories: 2
Exterior Features
- Roof Material: Tile
- Pool: Yes
HOA
- Has HOA: Yes
- Additional HOA Fee: $341/monthly
Land Information
- Land Use: Residential
- Land Use Subtype: Single Family Residential
Lot Information
- Parcel ID: 51960001389
- Lot Size: 0 sqft
Property Information
- Property Type: Single Family Residence
- Style: Other, Traditional
- Year Built: 2004
Tax Information
- Annual Tax: $9,313
Utilities
- Water & Sewer: Public
- Heating: Central, Electric
- Cooling: Central Air, Ceiling Fan(s), Electric
Location
- County: Collier
Listing Details
Investment Summary
- Monthly Cash Flow
- -$1,626
- Cap Rate
- 4.5%
- Cash-on-Cash Return
- -7.4%
- Debt Coverage Ratio
- 0.72
- Internal Rate of Return (5 years)
- -3.2%
Cash Flow
Net Operating Income (NOI) minus mortgage payments.
Calculation:
NOI - Mortgage Payments
Cap Rate (Market Value)
Capitalization Rate is a rate of return that compares the yearly Net Operating Income (NOI) to the market value.
Calculation:
NOI / Market Value
Cash-on-Cash Return (CoC)
Annual Cash Flow / Cash Invested
Calculation:
Annual cash flow divided by initial cash invested.
Debt Coverage Ratio (DCR)
Net Operating Income (NOI) divided by total debt payments.
Calculation:
NOI / Total Debt Payments
Internal Rate of Return (IRR)
A metric for assessing profitability over time. IRR is the discount rate at which the net present value (NPV) of all future cash flows (positive and negative) from an investment equals zero — including both periodic cash flow (such as rent) and a projected sale at the end of the holding period. It represents the expected annualized return, accounting for income, expenses, and the recovery of capital through a future sale.
Purchase Details
Purchase PriceThe price paid for the property. Purchase price:
| $1,150,000 |
|---|---|
Amount FinancedThe amount of the purchase financed through a loan. Amount financed:
| -$920,000 |
Down paymentThe initial payment made towards the purchase. Down payment:
| $230,000 |
Closing CostsFees and expenses associated with purchasing a property, typically ranging from 2% to 5% of the home’s purchase price, paid at the end of a home purchase to cover services like lending, title transfer, and taxes. Closing costs:
| $34,500 |
Rehab CostsCosts incurred to repair or improve the property, including: roof, flooring, exterior siding, kitchen, exterior paint, bathrooms, etc. Rehab costs:
| $0 |
Initial Cash InvestedThe total initial cash invested in the property. Calculation:Down payment + Buying costs + Rehab costs Initial cash invested:
| $264,500 |
Square Feet (SQFT)The total square footage of the property. Square feet:
| 3,975 |
Cost Per Square FootCost per square foot of the property. Calculation:Purchase Price / Square Feet Cost per square foot:
| $289 |
Monthly Rent Per Square FootMonthly rent divided by the number of square feet. This ratio helps investors compare rental income efficiency across properties, markets, and unit sizes Calculation:Monthly Rent / Square Feet Monthly rent per square foot:
| $1.96 |
Financing Details
Loan AmountThe total sum of money borrowed from a lender to finance a property purchase. Calculation:Purchase Price - Down Payment
Loan amount:
| $920,000 |
|---|---|
Loan to Value Ratio (LTV)Loan amount divided by the market value of the property. Calculation:Loan Amount / Market Value
Loan to value ratio:
| 80.0% |
Loan TypeThe type of loan (e.g., fixed, adjustable).
Loan type:
| Amortizing |
TermThe loan repayment period in years.
Term:
| 30 years |
Interest RateThe percentage a lender charges on the borrowed amount of a loan, determining the cost of borrowing money.
Interest rate:
| 6.625% |
Principal & Interest (PI)The principal is the portion of the loan payment that reduces the loan balance. The interest is the lender's charge for borrowing money. Calculation:(P * r * (1 + r) ** n) / ((1 + r) ** n - 1) Where:
P = Loan amount (principal)
Principal & interest:
| $5,891 |
Property TaxesAnnual taxes levied by local governments on real estate properties. These taxes fund public services like schools, roads, and emergency services.
Property tax:
| $776 |
InsuranceThe costs for insurance coverage to protect against financial losses due to risks like fire, natural disasters, theft, liability, or tenant-related damages. Calculation:Assumes 7% of gross rental income, unless insurance rates are specified.
Insurance:
| $546 |
Private Mortgage Insurance (PMI)A fee that borrowers pay when they take out a conventional loan with a loan-to-value (LTV) ratio above 80%.
Private mortgage insurance (PMI):
| $0 |
Monthly PaymentThe fixed amount a borrower pays each month to repay a loan. It typically includes principal and interest (P&I) and may also cover property taxes, insurance, HOA fees, and PMI if escrowed. Monthly payment:
| $7,213 |
Operating Income
| % Rent | Monthly | Yearly | |
|---|---|---|---|
Gross RentThe total rental income received from tenants before deducting any expenses. Includes base rent, late fees, pet fees, parking fees, and other recurring charges.
Gross rent:
| $7,800 | $93,600 | |
Vacancy LossExpected loss of rent due to vacancies.
Vacancy loss:
(6%)
| 6% | -$468 | -$5,616 |
Operating IncomeGross rental income minus vacancy loss. Calculation:Gross rent - Vacancy loss
Operating income:
| $7,332 | $87,984 |
Operating Expenses
| % Rent | Monthly | Yearly | |
|---|---|---|---|
Property TaxesAnnual taxes levied by local governments on real estate properties. These taxes fund public services like schools, roads, and emergency services. | 10% | -$776 | -$9,313 |
InsuranceThe costs for insurance coverage to protect against financial losses due to risks like fire, natural disasters, theft, liability, or tenant-related damages. Calculation:Assumes 7% of gross rental income, unless insurance rates are specified. | 7% | -$546 | -$6,552 |
Property ManagementThe costs associated with hiring a property manager to handle the day-to-day operations of a rental property. Includes management fees, leasing fes, eviction fees, etc. Calculation:Assumes 8% of gross rental income. | 8% | -$624 | -$7,488 |
Repairs & MaintenanceOngoing costs for routine upkeep and minor fixes needed to keep a property in good working condition. Calculation:Assumes 5% of gross rental income. Varies by property age and condition. | 5% | -$390 | -$4,680 |
Capital ExpensesLarge, infrequent costs for major improvements or replacements, like a new roof, HVAC system, or appliances. Calculation:Assumes 5% of gross rental income. Varies by property age. | 5% | -$390 | -$4,680 |
HOA FeesRegular dues paid to a Homeowners Association for community maintenance, amenities, and management. Similar fees include: Condo Association Fees, Co-op Maintenance Fees, etc. | 4% | -$341 | -$4,092 |
Operating ExpensesRecurring costs required to maintain and manage a rental property, including property taxes, insurance, maintenance, repairs, utilities (if paid by the owner), property management fees, and other day-to-day expenses. Calculation:Insurance + Property Taxes + Property Management + Repairs & Maintenance + Capital Expenditures + HOA Fees | 39% | -$3,067 | -$36,805 |
Cash Flow
| Monthly | Yearly | |
|---|---|---|
Net Operating Income (NOI)The income generated from a property after deducting all operating expenses but before deducting mortgage payments, taxes, and capital expenditures. Calculation:Gross Operating Income - Operating Expenses
Net operating income:
| $4,265 | $51,180 |
Mortgage PaymentThe fixed amount a borrower pays each month to repay a loan. It typically includes principal and interest (P&I) and may also cover property taxes, insurance, HOA fees, and PMI if escrowed. | -$5,891 | -$70,692 |
Cash FlowNet Operating Income (NOI) minus mortgage payments. Calculation:NOI - Mortgage Payments | -$1,626 | -$19,512 |