$507,877
Investment Summary
- Monthly Cash Flow
- -$17
- Cap Rate
- 5.6%
- Cash-on-Cash Return
- -0.2%
- Debt Coverage Ratio
- 0.99
- Internal Rate of Return (5 years)
- 3.8%
Cash Flow
Net Operating Income (NOI) minus mortgage payments.
Calculation:
NOI - Mortgage Payments
Cap Rate (Market Value)
Capitalization Rate is a rate of return that compares the yearly Net Operating Income (NOI) to the market value.
Calculation:
NOI / Market Value
Cash-on-Cash Return (CoC)
Annual Cash Flow / Cash Invested
Calculation:
Annual cash flow divided by initial cash invested.
Debt Coverage Ratio (DCR)
Net Operating Income (NOI) divided by total debt payments.
Calculation:
NOI / Total Debt Payments
Internal Rate of Return (IRR)
A metric for assessing profitability over time. IRR is the discount rate at which the net present value (NPV) of all future cash flows (positive and negative) from an investment equals zero — including both periodic cash flow (such as rent) and a projected sale at the end of the holding period. It represents the expected annualized return, accounting for income, expenses, and the recovery of capital through a future sale.
Property Description
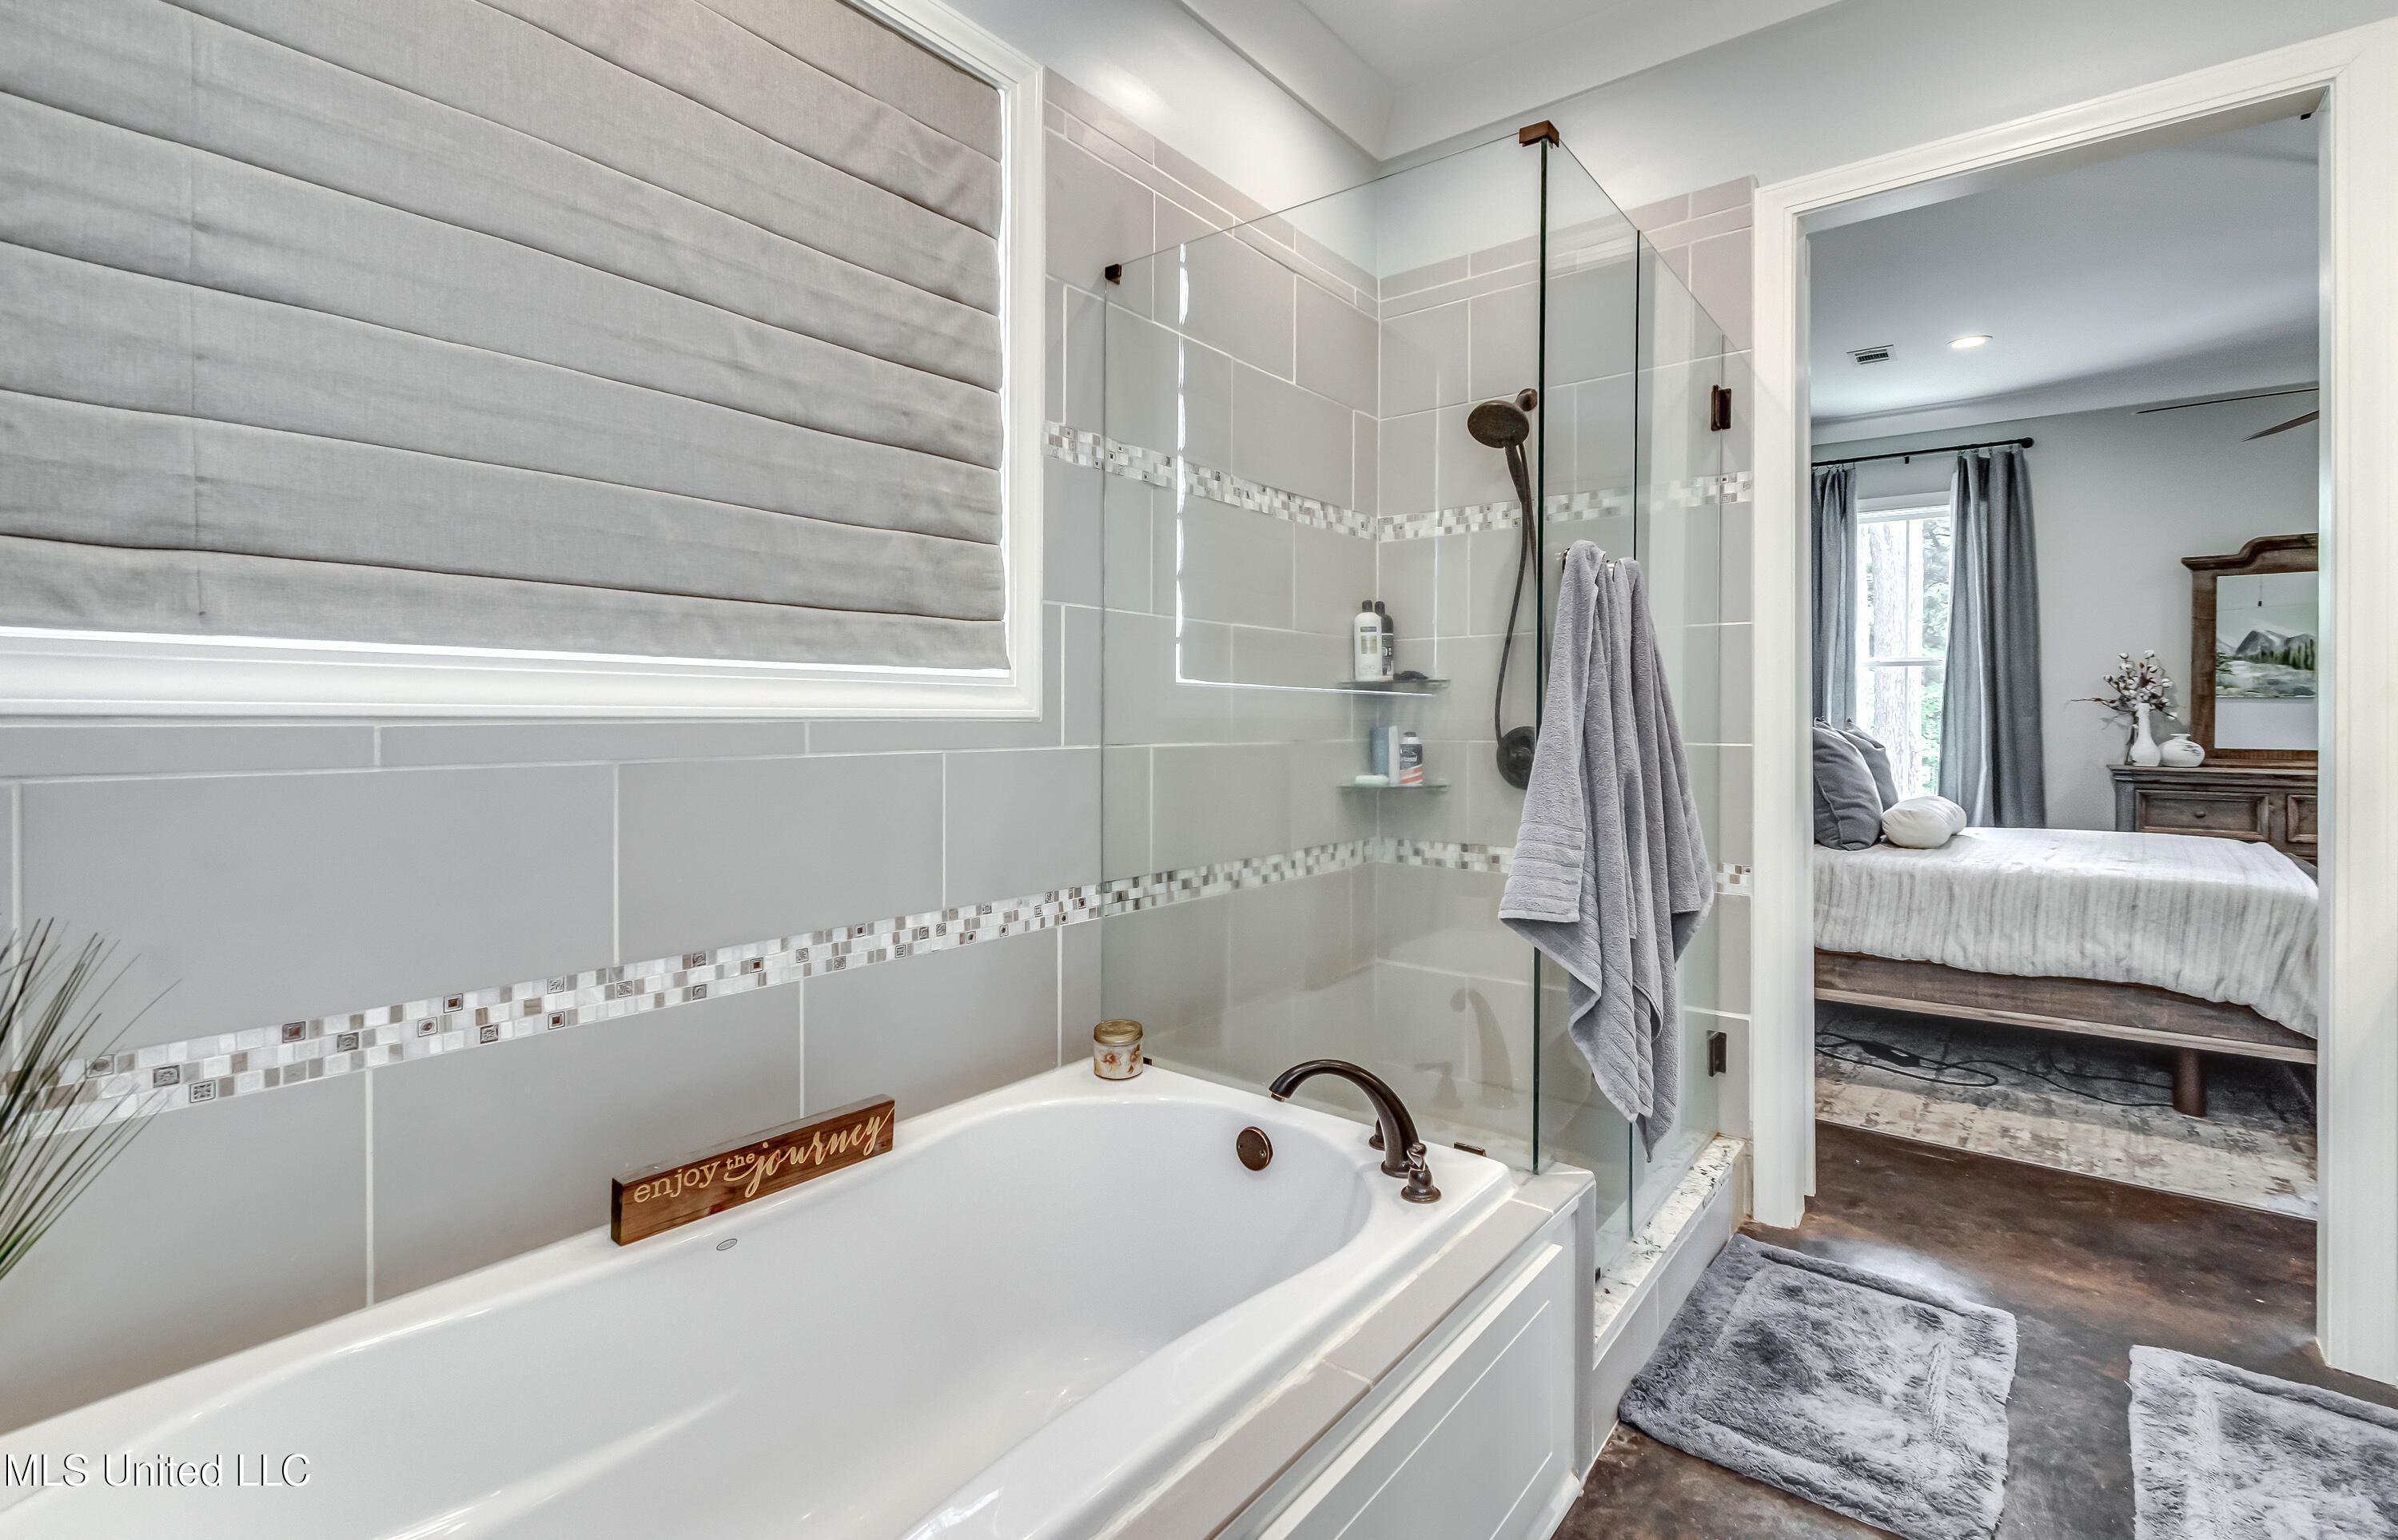
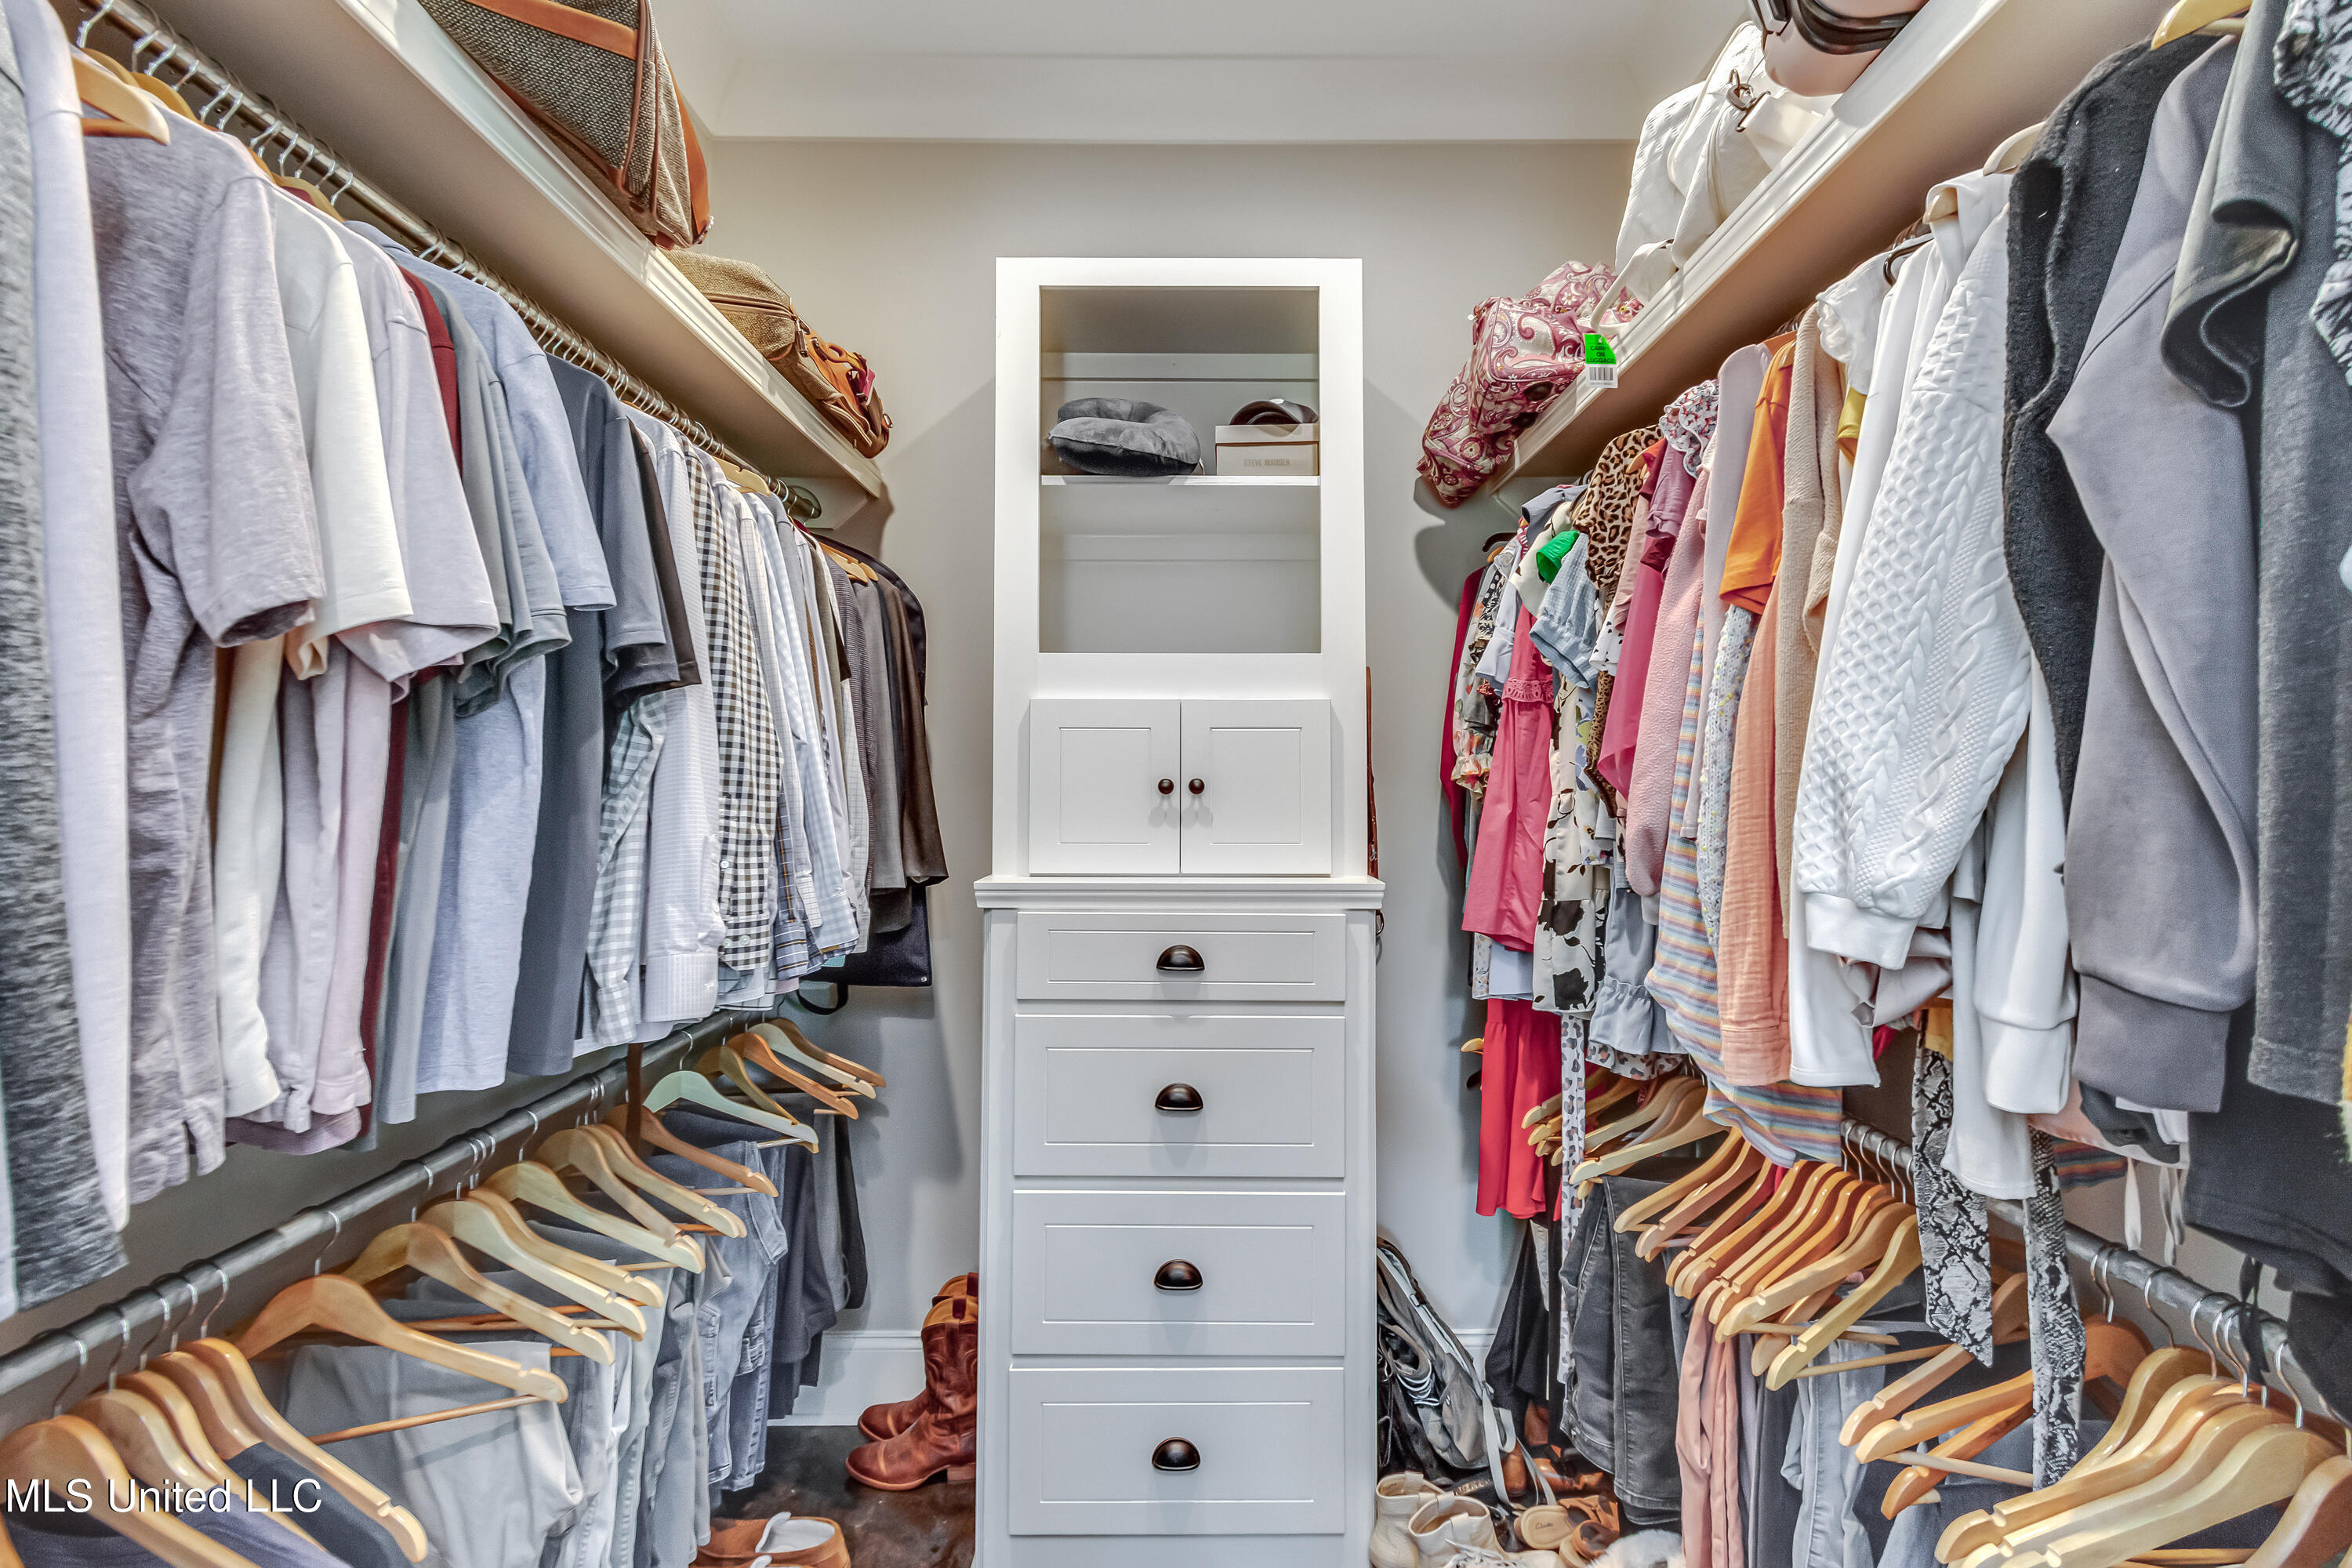
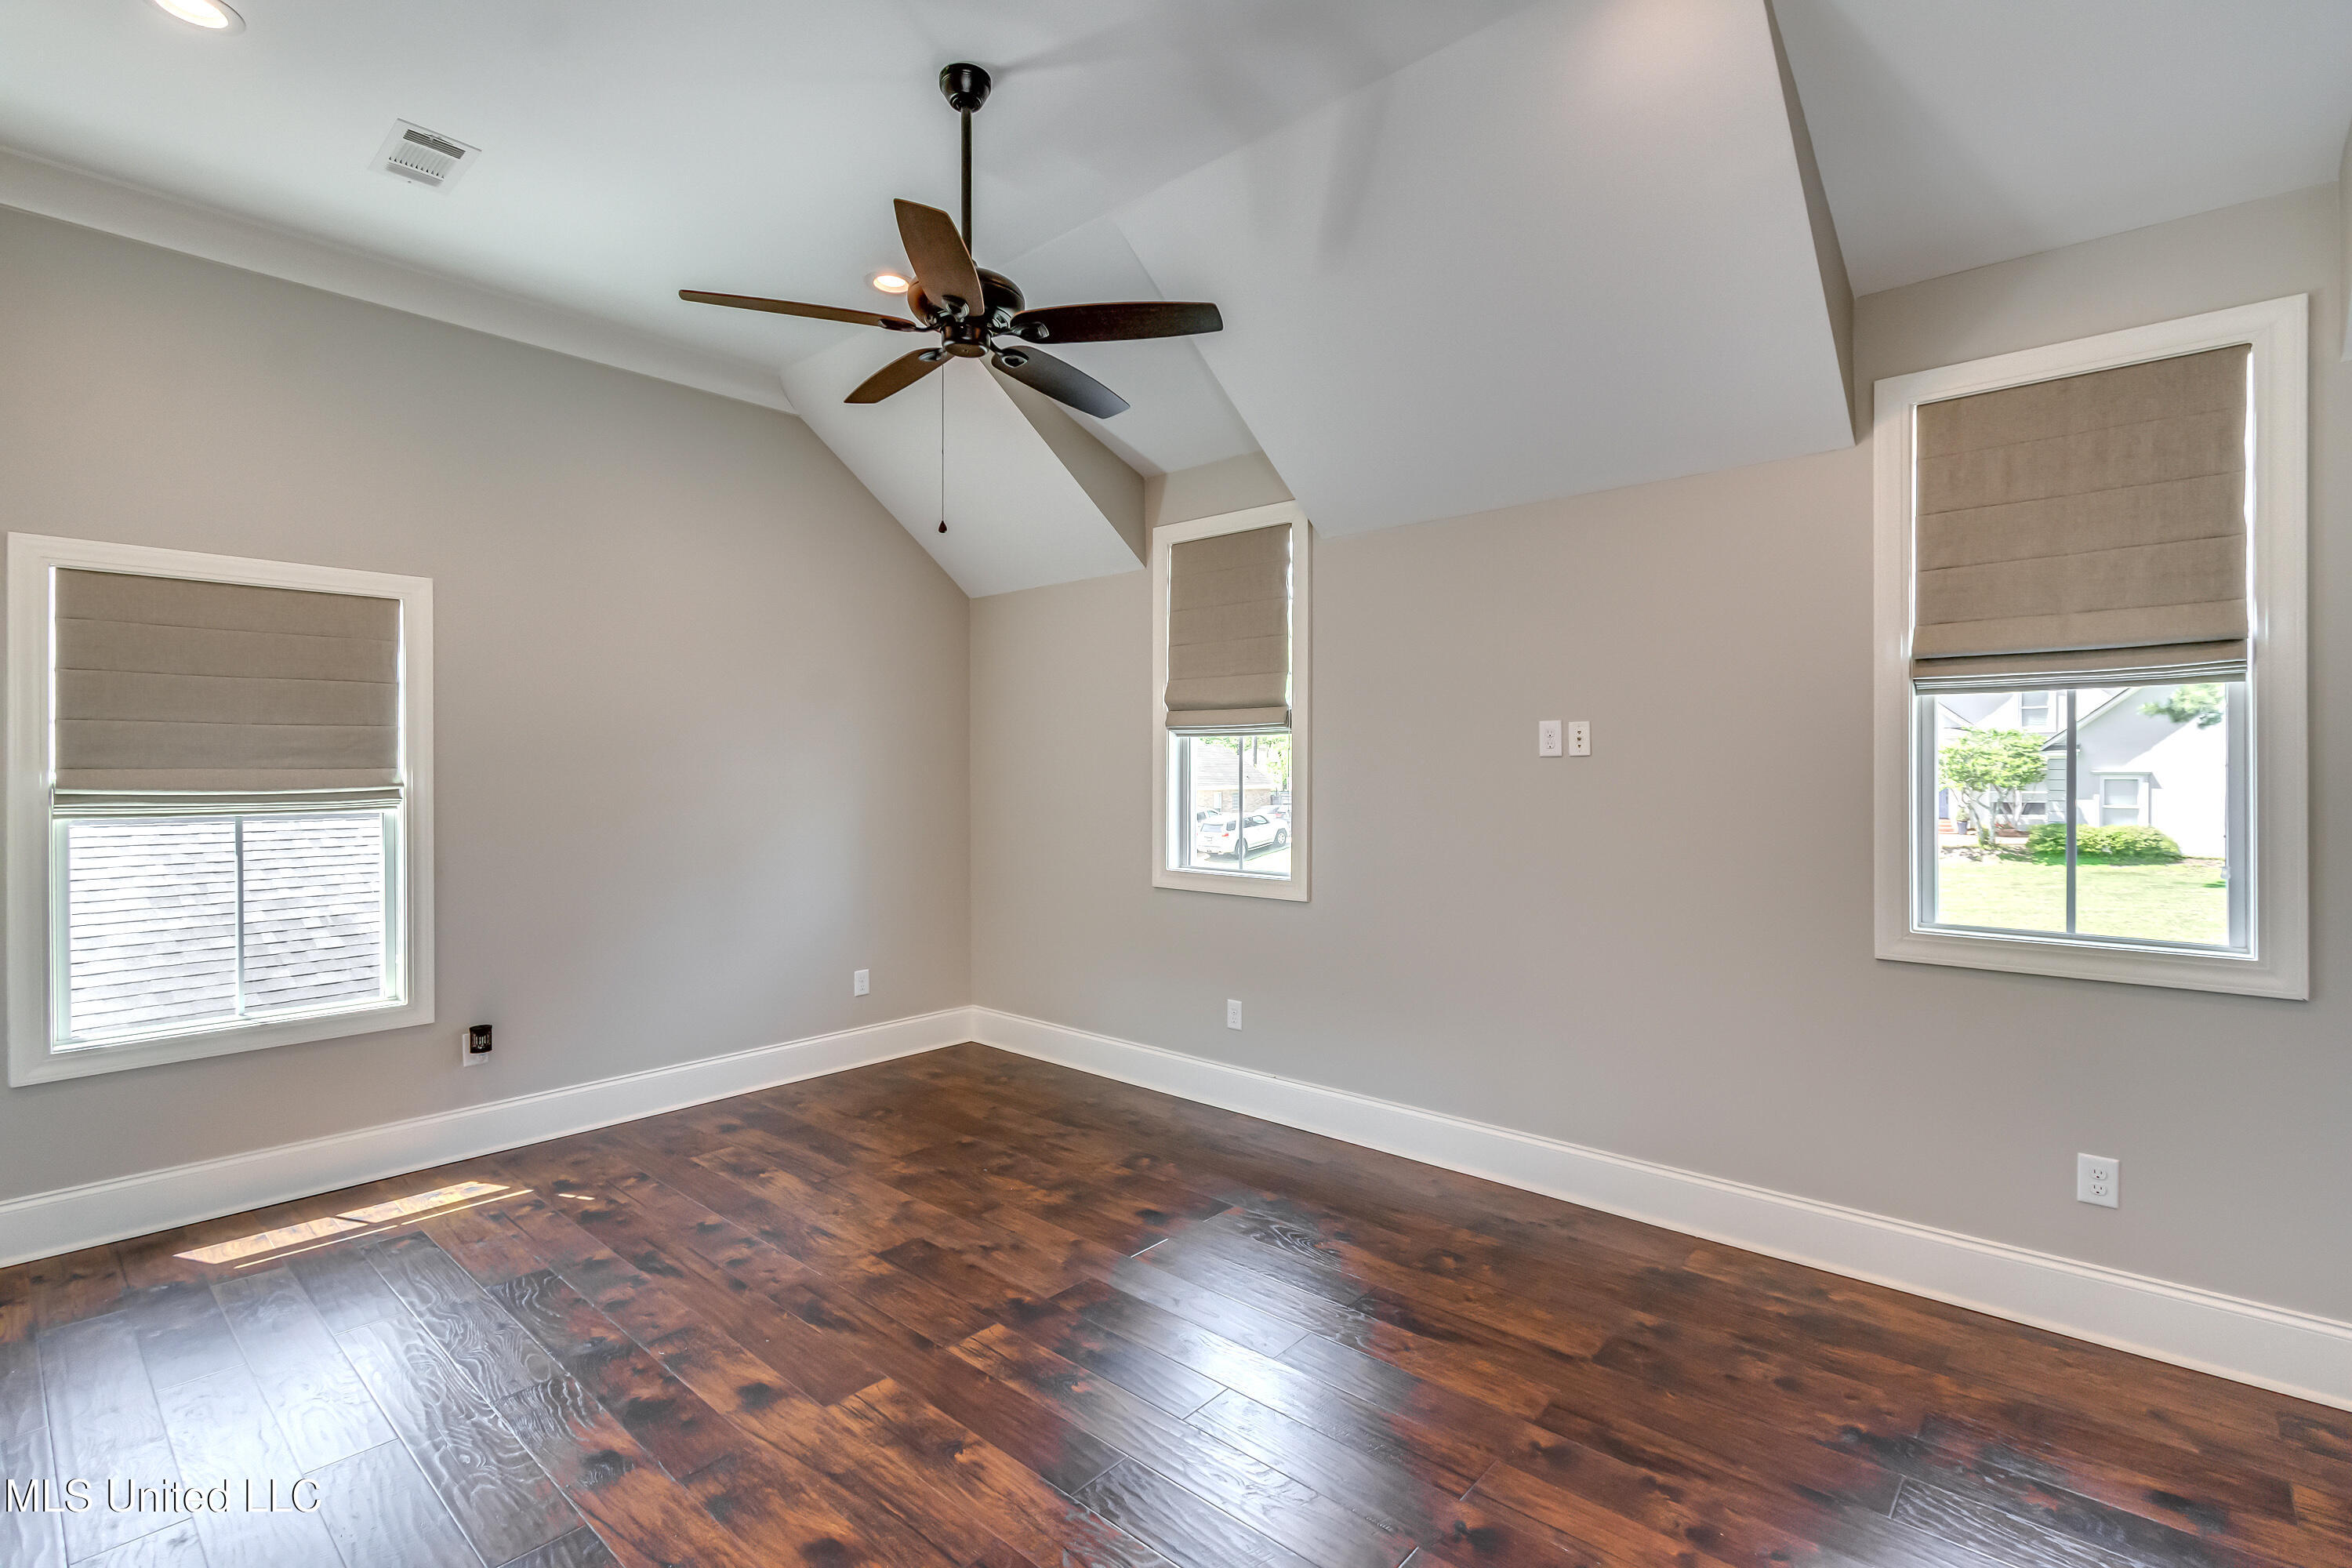
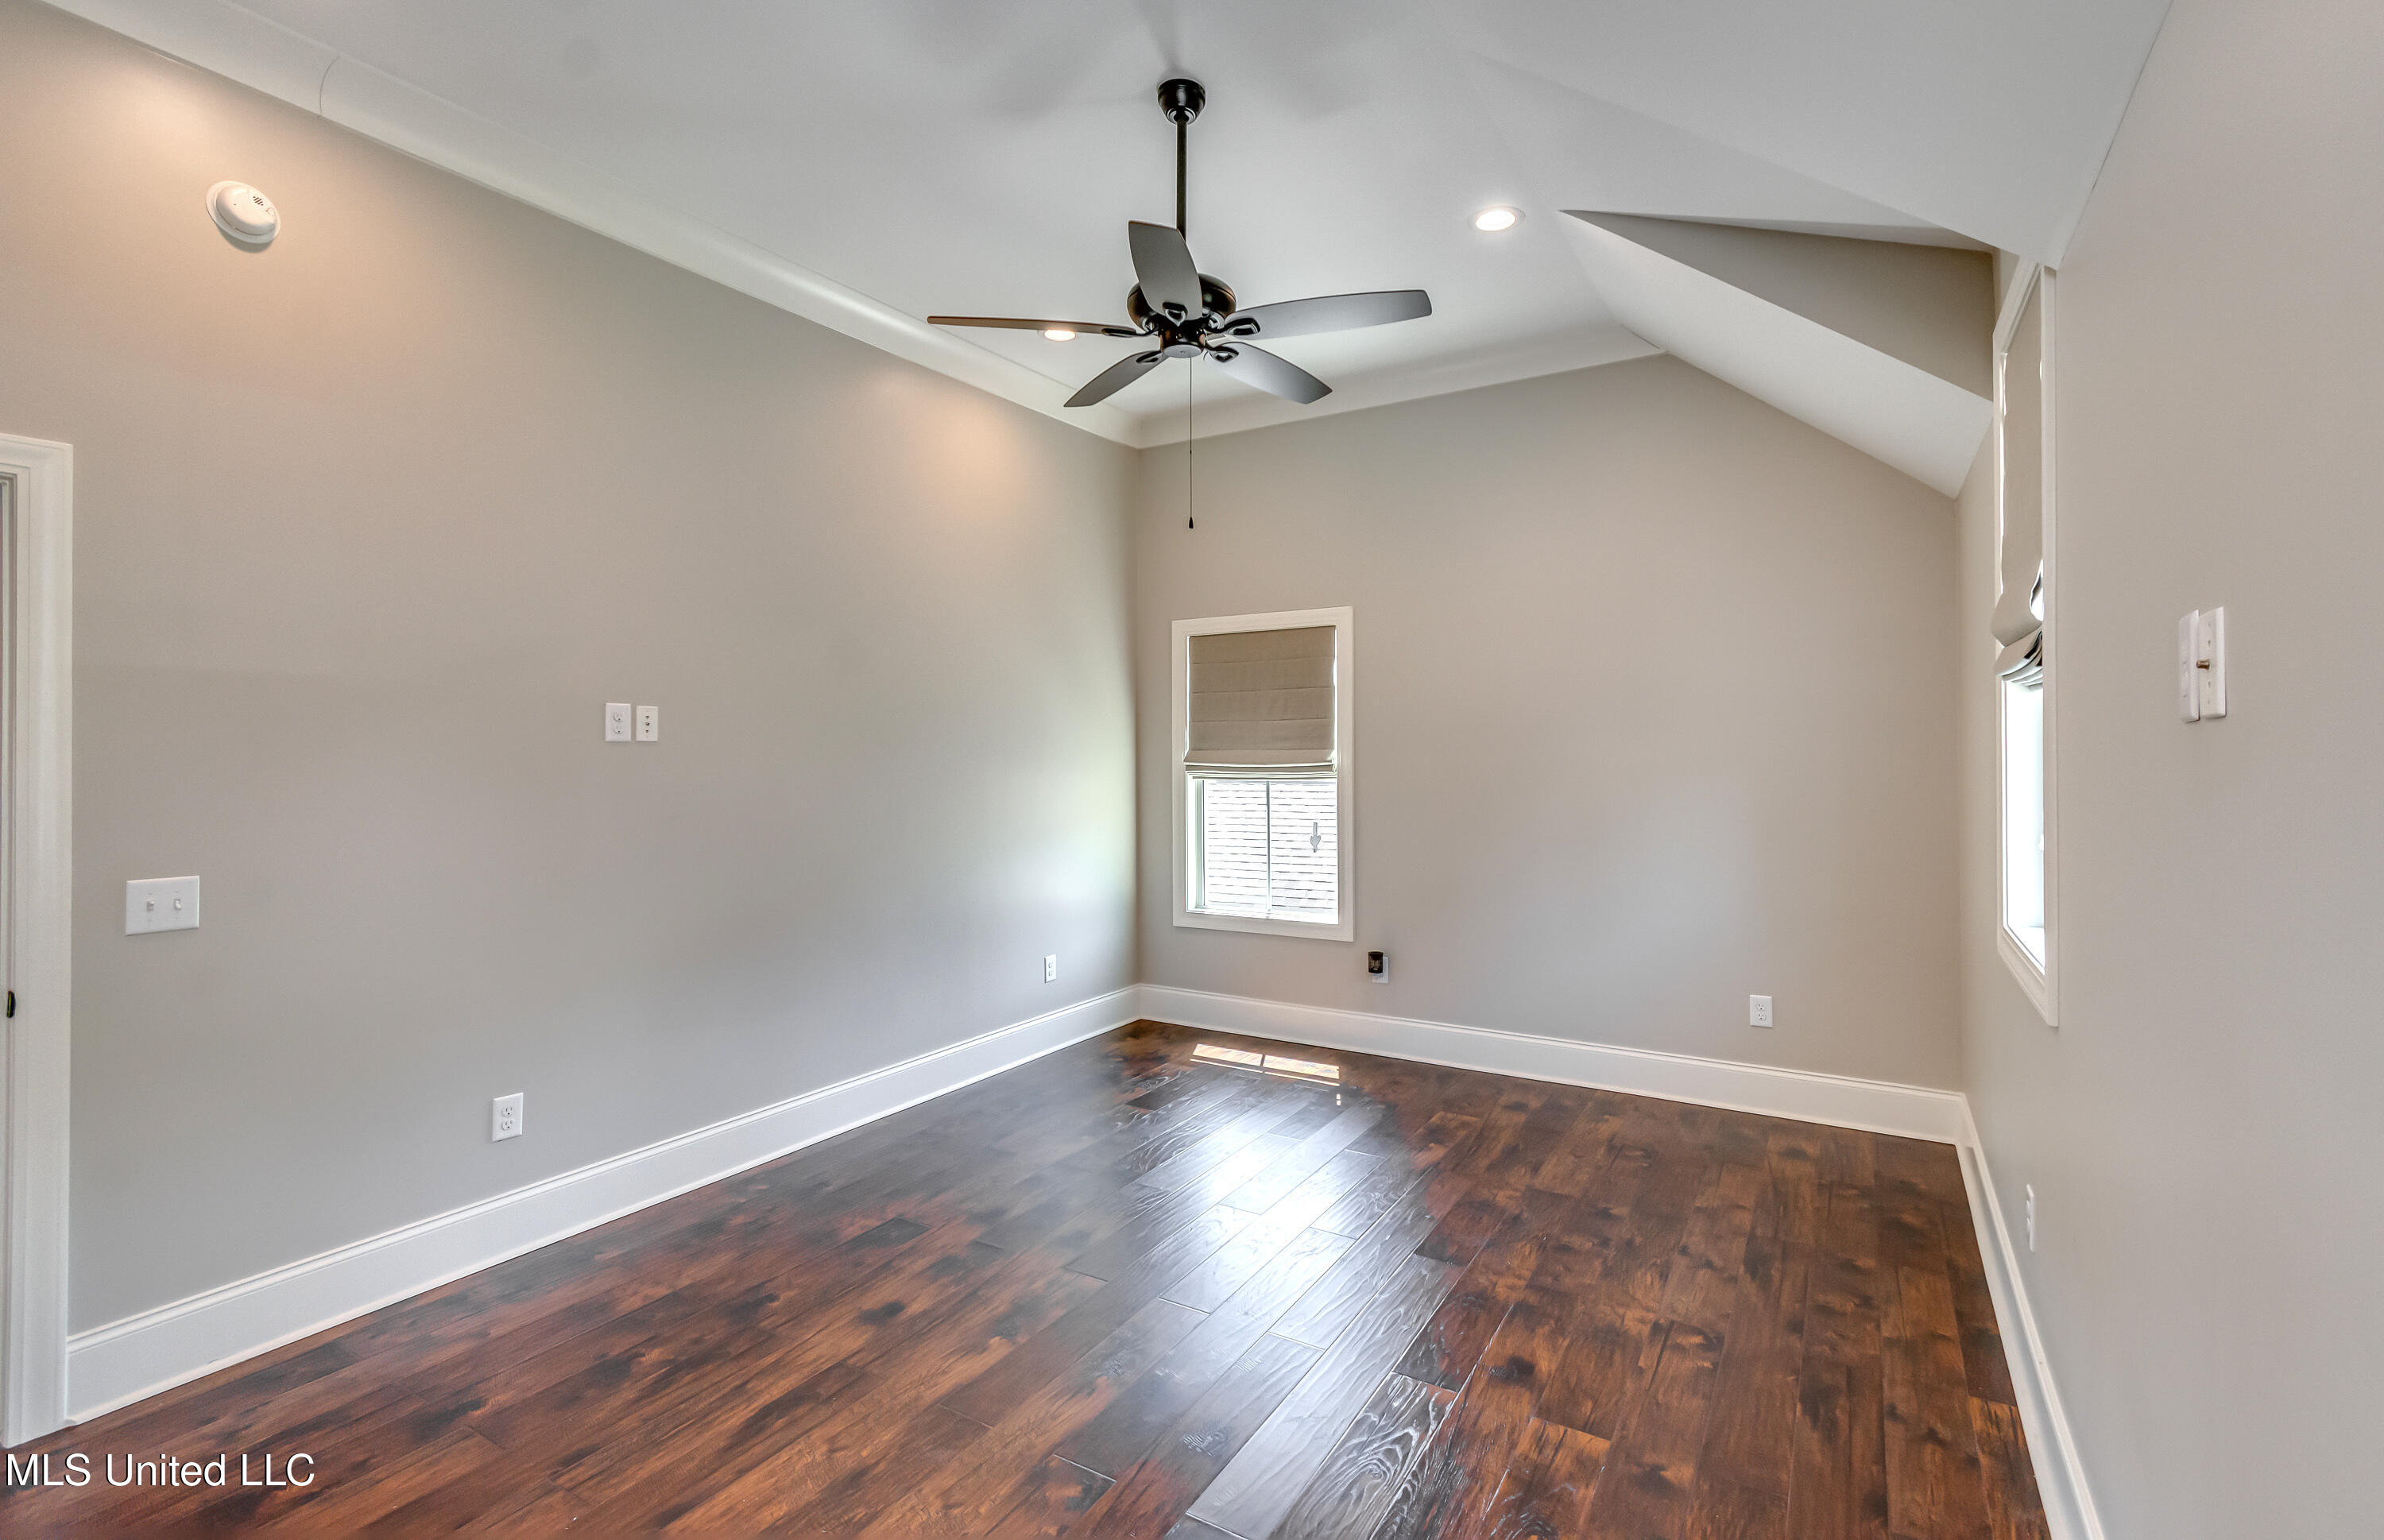
BEST PRICE IN BAY POINTE!!!- Every now and then, you see a listing that absolutely knocks your socks off and has all the right stuff in all the right places. That's what we have here at 150 Pine Ridge Circle. First off—the location. You couldn't ask for better than on the 11th hole at Bay Pointe Golf. Are you kidding me? And it's basically brand new. Then to top it off—it's a deal. Only $159 a foot? That's insane. You start wondering, ''What's the catch? Is this a Jim Walter home or something?'' NOPE. This thing has more options than the Starship Enterprise. It's loaded with top-notch features, and the fit and finish? Absolutely mind-boggling. From the moment you walk in, it's clear this home was built to impress. Tall ceilings, oversized windows, and an open layout that flows like it was designed by someone who actually gets how people live. Just off the foyer, you've got a dedicated home office with custom wood-inlaid ceilings—perfect for knocking out emails or just looking important. The kitchen is the heart of the home and comes fully armed with granite counters, upgraded appliances, a five-burner gas cooktop, and yes—there's a pot filler, because walking to the sink is for rookies. Tons of cabinet space and a pantry big enough to get lost in. The breakfast area overlooks the golf course and gives you morning views better than your last vacation. The living room is wide open, bright, and centered around a the perfect modern fireplace. The master suite is perfectly placed in the back for privacy and also faces the course—because once you live on the 11th hole, you should be able to see it from your bed. The ensuite bath brings the wow factor with a soaking tub, separate shower, double vanities, and dual walk-in closets that'll finally end the ''your side vs. my side'' debate. Upstairs? Oh yeah, we're far from done. Four more bedrooms, two full baths, and a bonus room that works as a second office, a playroom, craft space, gaming zone, 6th bedroom—you name it. Out back is a huge deck with a front-row seat to sunrises and the golf course. It's peaceful, private, and the kind of spot where coffee tastes better and time slows down. Plus, this home sits just steps from Bay Pointe Country Club and the 19th Hole Grill. Dogwood Festival shopping and dining is 10 minutes away, and the Reservoir—complete with boat launches, parks, trails, and endless views—is right around the corner. Smart home features? Check. Top-rated schools? Northshore Elementary and Northwest Rankin. Fit, finish, location, layout—it checks all the boxes and then adds a few more. Long story short: this home isn't just a great deal, it's the kind of deal that makes you text your lender mid-tour. Don't wait. Call today before this one is gone !!!
Build Your Team
Quickly find investor-friendly professionals who can help you succeed in real estate investing at any stage of the investing journey.


Agents
Match with investor-friendly agents who can help you find, analyze, and close your next deal


Lenders
Get the best funding…find investor-friendly lenders who specialize in your deal strategy


Property Managers
Transition to passive investing. Find a trusted property management partnership that lasts.


Tax Pros & Accountants
Taxes and financial reporting made easy—find experts to create tax savings strategies, file taxes, and more
Location
Property Details
Parking
- Description: Attached, Driveway, Circular Driveway
- Details: Deck, Garage Faces Front
- Garage Spaces: 2
- Spaces Total: 2
Bedroom Information
- # of Bedrooms: 5
Bathroom Information
- # of Baths (Full): 4
- # of Baths (Partial): 1
- # of Baths (Total): 5.0
Interior Features
- # of Rooms: 10
- # of Stories: 2
- Fireplace: Yes
Exterior Features
- Exterior Walls Materials: Brick Veneer
- Foundation: Slab
- Roof Type: Hip
- Roof Material: Asphalt
Land Information
- Land Use: Residential
- Land Use Subtype: Single Family Residential
Lot Information
- Parcel ID: J12N00000100260
- Lot Size: 9147 sqft
Property Information
- Property Type: Single Family Residence
- Style: French Acadian
- Year Built: 2019
Tax Information
- Annual Tax: $3,662
Utilities
- Water & Sewer: Public
- Heating: Central, Natural Gas
- Cooling: Central Air, Ceiling Fan(s), Gas
Location
- County: Rankin
Listing Details
Investment Summary
- Monthly Cash Flow
- -$17
- Cap Rate
- 5.6%
- Cash-on-Cash Return
- -0.2%
- Debt Coverage Ratio
- 0.99
- Internal Rate of Return (5 years)
- 3.8%
Cash Flow
Net Operating Income (NOI) minus mortgage payments.
Calculation:
NOI - Mortgage Payments
Cap Rate (Market Value)
Capitalization Rate is a rate of return that compares the yearly Net Operating Income (NOI) to the market value.
Calculation:
NOI / Market Value
Cash-on-Cash Return (CoC)
Annual Cash Flow / Cash Invested
Calculation:
Annual cash flow divided by initial cash invested.
Debt Coverage Ratio (DCR)
Net Operating Income (NOI) divided by total debt payments.
Calculation:
NOI / Total Debt Payments
Internal Rate of Return (IRR)
A metric for assessing profitability over time. IRR is the discount rate at which the net present value (NPV) of all future cash flows (positive and negative) from an investment equals zero — including both periodic cash flow (such as rent) and a projected sale at the end of the holding period. It represents the expected annualized return, accounting for income, expenses, and the recovery of capital through a future sale.
Purchase Details
Purchase PriceThe price paid for the property. Purchase price:
| $507,877 |
|---|---|
Amount FinancedThe amount of the purchase financed through a loan. Amount financed:
| -$406,302 |
Down paymentThe initial payment made towards the purchase. Down payment:
| $101,575 |
Closing CostsFees and expenses associated with purchasing a property, typically ranging from 2% to 5% of the home’s purchase price, paid at the end of a home purchase to cover services like lending, title transfer, and taxes. Closing costs:
| $15,236 |
Rehab CostsCosts incurred to repair or improve the property, including: roof, flooring, exterior siding, kitchen, exterior paint, bathrooms, etc. Rehab costs:
| $0 |
Initial Cash InvestedThe total initial cash invested in the property. Calculation:Down payment + Buying costs + Rehab costs Initial cash invested:
| $116,811 |
Square Feet (SQFT)The total square footage of the property. Square feet:
| 0 |
Cost Per Square FootCost per square foot of the property. Calculation:Purchase Price / Square Feet Cost per square foot:
| n/a |
Monthly Rent Per Square FootMonthly rent divided by the number of square feet. This ratio helps investors compare rental income efficiency across properties, markets, and unit sizes Calculation:Monthly Rent / Square Feet Monthly rent per square foot:
| n/a |
Financing Details
Loan AmountThe total sum of money borrowed from a lender to finance a property purchase. Calculation:Purchase Price - Down Payment
Loan amount:
| $406,302 |
|---|---|
Loan to Value Ratio (LTV)Loan amount divided by the market value of the property. Calculation:Loan Amount / Market Value
Loan to value ratio:
| 80.0% |
Loan TypeThe type of loan (e.g., fixed, adjustable).
Loan type:
| Amortizing |
TermThe loan repayment period in years.
Term:
| 30 years |
Interest RateThe percentage a lender charges on the borrowed amount of a loan, determining the cost of borrowing money.
Interest rate:
| 5.875% |
Principal & Interest (PI)The principal is the portion of the loan payment that reduces the loan balance. The interest is the lender's charge for borrowing money. Calculation:(P * r * (1 + r) ** n) / ((1 + r) ** n - 1) Where:
P = Loan amount (principal)
Principal & interest:
| $2,403 |
Property TaxesAnnual taxes levied by local governments on real estate properties. These taxes fund public services like schools, roads, and emergency services.
Property tax:
| $305 |
InsuranceThe costs for insurance coverage to protect against financial losses due to risks like fire, natural disasters, theft, liability, or tenant-related damages. Calculation:Assumes 7% of gross rental income, unless insurance rates are specified.
Insurance:
| $273 |
Private Mortgage Insurance (PMI)A fee that borrowers pay when they take out a conventional loan with a loan-to-value (LTV) ratio above 80%.
Private mortgage insurance (PMI):
| $0 |
Monthly PaymentThe fixed amount a borrower pays each month to repay a loan. It typically includes principal and interest (P&I) and may also cover property taxes, insurance, HOA fees, and PMI if escrowed. Monthly payment:
| $2,981 |
Operating Income
| % Rent | Monthly | Yearly | |
|---|---|---|---|
Gross RentThe total rental income received from tenants before deducting any expenses. Includes base rent, late fees, pet fees, parking fees, and other recurring charges.
Gross rent:
| $3,900 | $46,800 | |
Vacancy LossExpected loss of rent due to vacancies.
Vacancy loss:
(6%)
| 6% | -$234 | -$2,808 |
Operating IncomeGross rental income minus vacancy loss. Calculation:Gross rent - Vacancy loss
Operating income:
| $3,666 | $43,992 |
Operating Expenses
| % Rent | Monthly | Yearly | |
|---|---|---|---|
Property TaxesAnnual taxes levied by local governments on real estate properties. These taxes fund public services like schools, roads, and emergency services. | 8% | -$305 | -$3,662 |
InsuranceThe costs for insurance coverage to protect against financial losses due to risks like fire, natural disasters, theft, liability, or tenant-related damages. Calculation:Assumes 7% of gross rental income, unless insurance rates are specified. | 7% | -$273 | -$3,276 |
Property ManagementThe costs associated with hiring a property manager to handle the day-to-day operations of a rental property. Includes management fees, leasing fes, eviction fees, etc. Calculation:Assumes 8% of gross rental income. | 8% | -$312 | -$3,744 |
Repairs & MaintenanceOngoing costs for routine upkeep and minor fixes needed to keep a property in good working condition. Calculation:Assumes 5% of gross rental income. Varies by property age and condition. | 5% | -$195 | -$2,340 |
Capital ExpensesLarge, infrequent costs for major improvements or replacements, like a new roof, HVAC system, or appliances. Calculation:Assumes 5% of gross rental income. Varies by property age. | 5% | -$195 | -$2,340 |
HOA FeesRegular dues paid to a Homeowners Association for community maintenance, amenities, and management. Similar fees include: Condo Association Fees, Co-op Maintenance Fees, etc. | n/a | n/a | n/a |
Operating ExpensesRecurring costs required to maintain and manage a rental property, including property taxes, insurance, maintenance, repairs, utilities (if paid by the owner), property management fees, and other day-to-day expenses. Calculation:Insurance + Property Taxes + Property Management + Repairs & Maintenance + Capital Expenditures + HOA Fees | 33% | -$1,280 | -$15,362 |
Cash Flow
| Monthly | Yearly | |
|---|---|---|
Net Operating Income (NOI)The income generated from a property after deducting all operating expenses but before deducting mortgage payments, taxes, and capital expenditures. Calculation:Gross Operating Income - Operating Expenses
Net operating income:
| $2,386 | $28,632 |
Mortgage PaymentThe fixed amount a borrower pays each month to repay a loan. It typically includes principal and interest (P&I) and may also cover property taxes, insurance, HOA fees, and PMI if escrowed. | -$2,403 | -$28,836 |
Cash FlowNet Operating Income (NOI) minus mortgage payments. Calculation:NOI - Mortgage Payments | $17 | $204 |