Brandon, MS Investment Properties for Sale
Browse homes for sale and investment properties in Brandon, MS. Refine your search by price, property type, or more.
Best cash flowing properties in Brandon, MS
Active
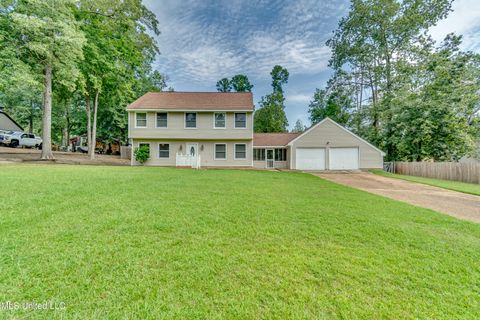
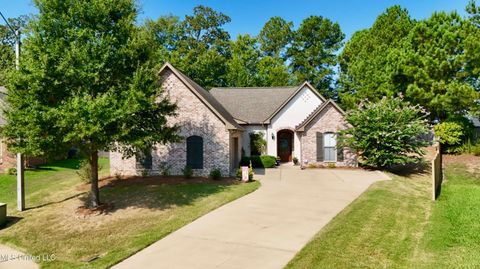
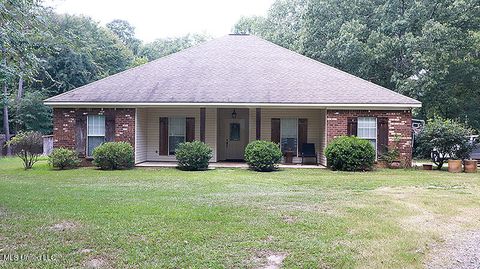
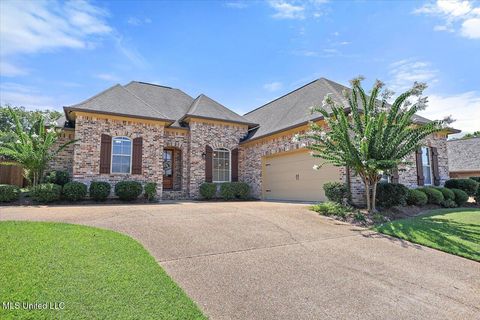
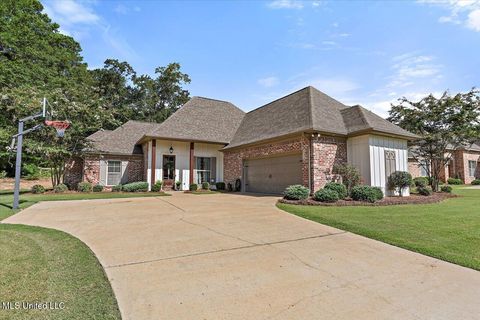
$214,900
4
bds
|
3
ba
|
0
sqft
|
built
1979
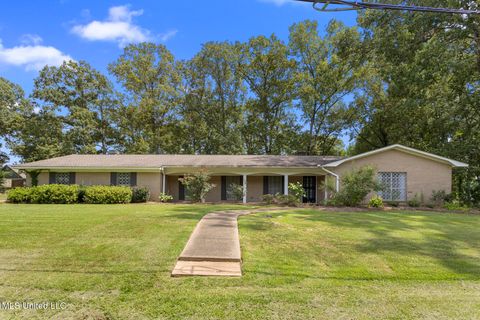
223 Haddon Cir, Brandon, MS 39047
$519
Cash flow
12.6%
Cash-on-Cash Return
8.6%
Cap rate
1.1%
Rent to Value Ratio
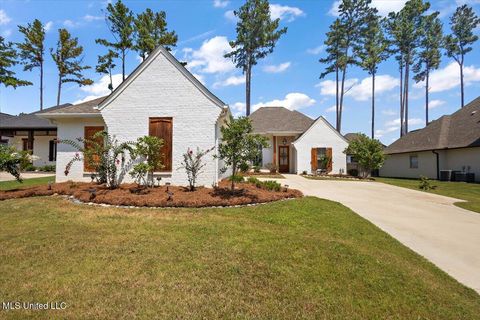
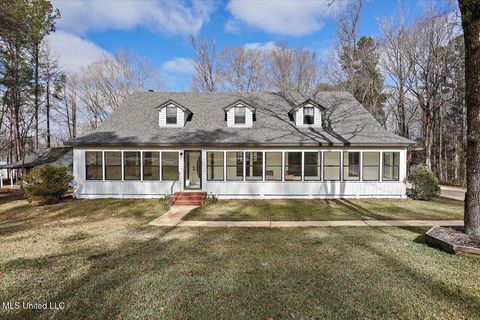
Active
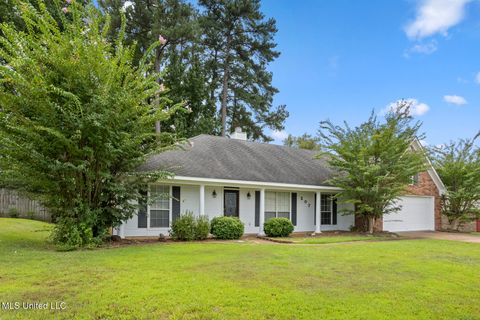
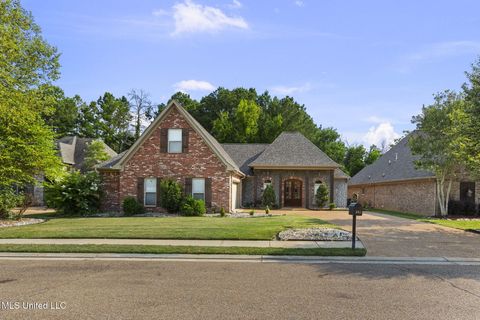
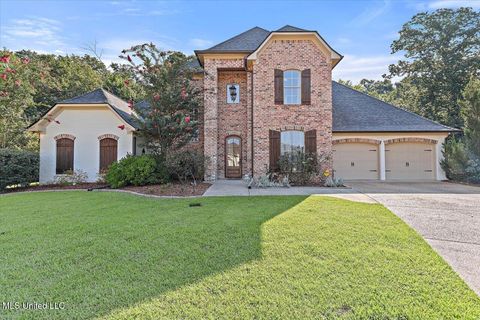
$275,000
4
bds
|
3
ba
|
0
sqft
|
built
1995
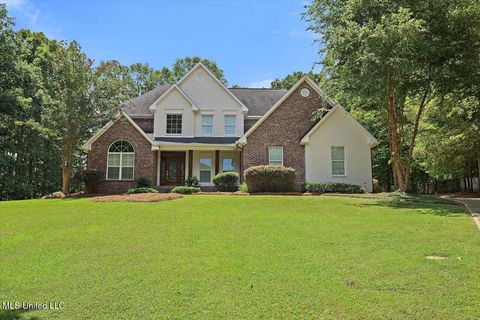
207 Meadowview Ln, Brandon, MS 39047
$383
Cash flow
7.3%
Cash-on-Cash Return
7.3%
Cap rate
0.9%
Rent to Value Ratio
212 out of 221 properties for sale in Brandon, MS
Limited Results Shown
Create a free account, or log in to reveal all property listings and enjoy the complete experience.
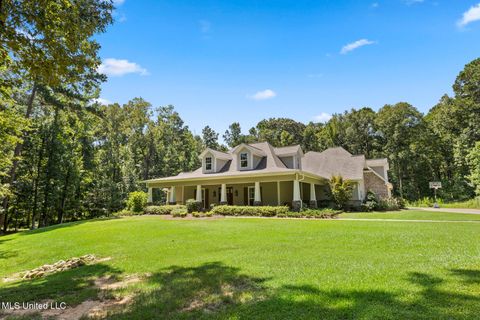
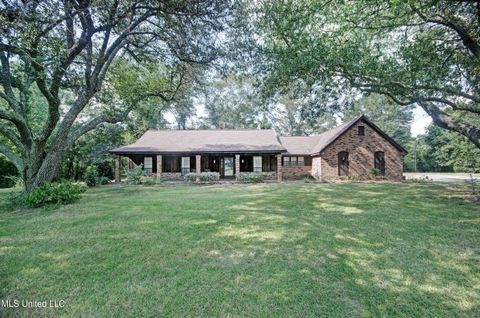
Active
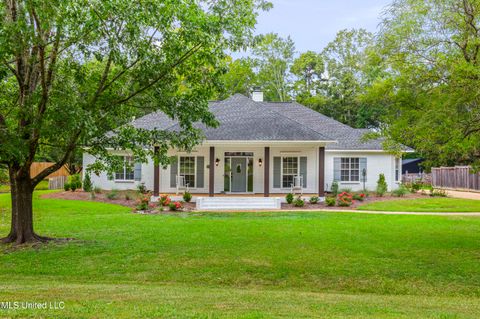
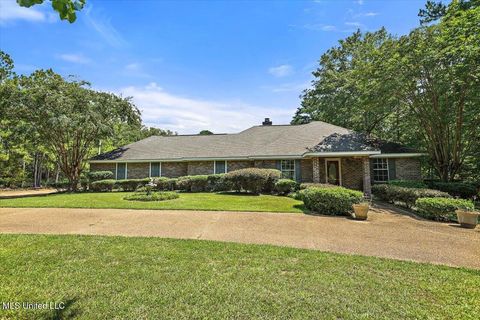
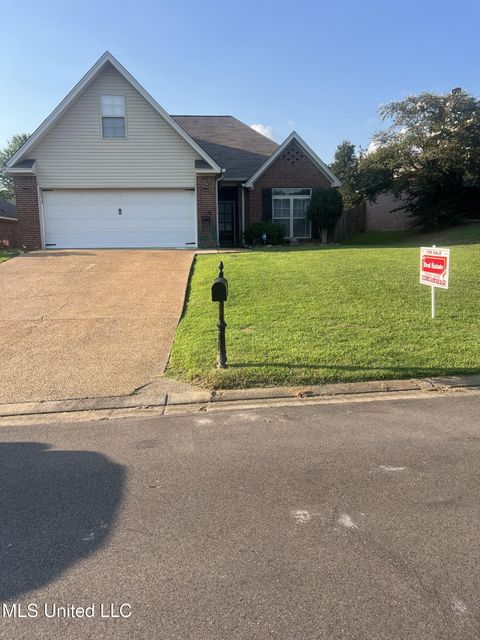
$415,000
5
bds
|
3
ba
|
0
sqft
|
built
1994
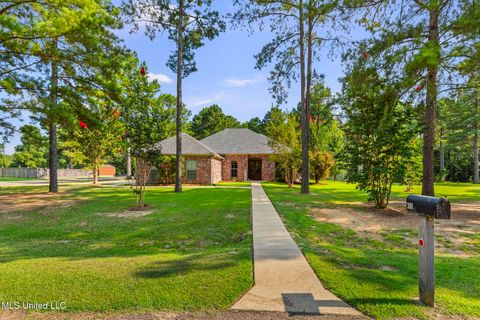
145 Bridlewood Dr, Brandon, MS 39047
$-247
Cash flow
-3.1%
Cash-on-Cash Return
5.0%
Cap rate
0.7%
Rent to Value Ratio
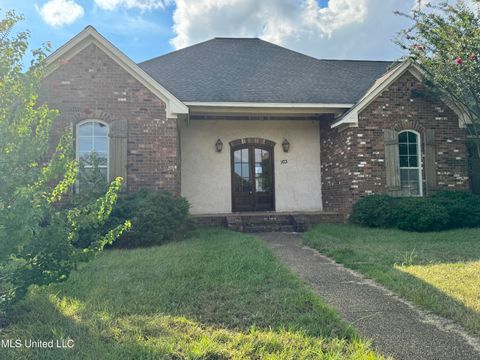
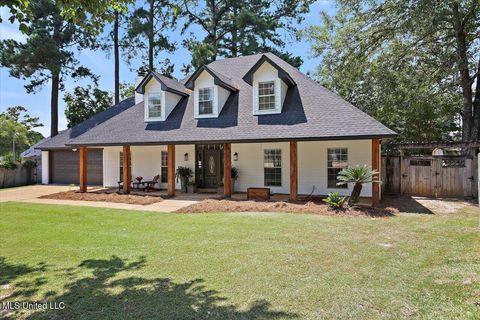
Active
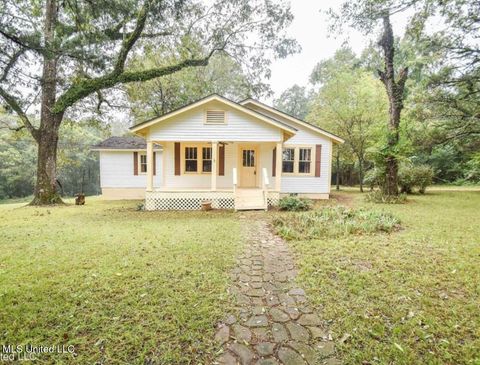
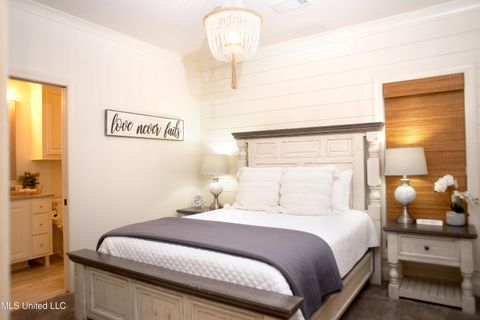
$185,000
3
bds
|
2
ba
|
0
sqft
|
built
1940
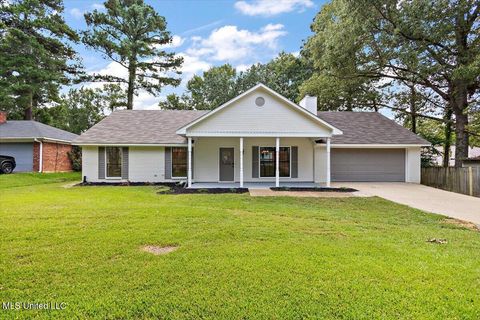
104 Overby St, Brandon, MS 39042
$376
Cash flow
10.6%
Cash-on-Cash Return
8.1%
Cap rate
1.1%
Rent to Value Ratio
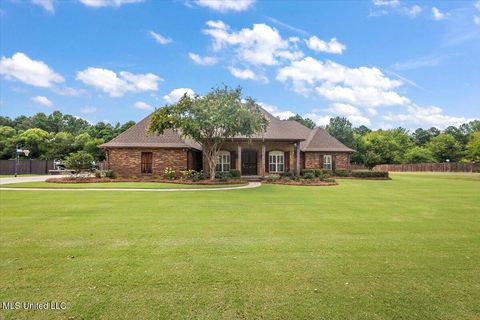
Active
$319,900
3
bds
|
2
ba
|
0
sqft
|
built
2017
349 Emerald Way, Brandon, MS 39047
$145
Cash flow
2.4%
Cash-on-Cash Return
6.2%
Cap rate
0.8%
Rent to Value Ratio
Active
$224,999
3
bds
|
2
ba
|
0
sqft
|
built
1995
232 Mallard Dr, Brandon, MS 39047
$120
Cash flow
2.8%
Cash-on-Cash Return
6.3%
Cap rate
0.9%
Rent to Value Ratio
Active
$215,000
2
bds
|
2
ba
|
0
sqft
|
built
1996
117 Cape Charles, Brandon, MS 39047
$9
Cash flow
0.2%
Cash-on-Cash Return
5.7%
Cap rate
0.8%
Rent to Value Ratio
Active
$225,000
3
bds
|
2
ba
|
0
sqft
|
built
1972
426 Lakebend Pl, Brandon, MS 39042
$81
Cash flow
1.9%
Cash-on-Cash Return
6.1%
Cap rate
0.8%
Rent to Value Ratio

Active
$312,900
3
bds
|
2
ba
|
0
sqft
|
built
2006
537 Turtle Ln, Brandon, MS 39047
$154
Cash flow
2.6%
Cash-on-Cash Return
6.3%
Cap rate
0.9%
Rent to Value Ratio

Active
$499,000
4
bds
|
3
ba
|
0
sqft
|
built
2023
1656 Old Lake Rd, Brandon, MS 39042
$226
Cash flow
2.4%
Cash-on-Cash Return
6.2%
Cap rate
0.8%
Rent to Value Ratio
Active
$296,500
3
bds
|
2
ba
|
0
sqft
|
built
2013
545 Willow Valley Cir, Brandon, MS 39047
$223
Cash flow
3.9%
Cash-on-Cash Return
6.6%
Cap rate
0.9%
Rent to Value Ratio
Active
$385,400
4
bds
|
3
ba
|
0
sqft
|
built
2014
252 Penny Ln, Brandon, MS 39042
$-165
Cash flow
-2.2%
Cash-on-Cash Return
5.2%
Cap rate
0.7%
Rent to Value Ratio
Active
$349,000
3
bds
|
2
ba
|
0
sqft
|
built
1995
354 Lakeway Dr, Brandon, MS 39047
$215
Cash flow
3.2%
Cash-on-Cash Return
6.4%
Cap rate
0.8%
Rent to Value Ratio

Active
$550,000
5
bds
|
5
ba
|
0
sqft
|
built
2002
716 Highway 468, Brandon, MS 39042
$-993
Cash flow
-9.4%
Cash-on-Cash Return
3.5%
Cap rate
0.5%
Rent to Value Ratio

Active
$244,500
3
bds
|
2
ba
|
0
sqft
|
built
1997
561 Acorn Ln, Brandon, MS 39047
$132
Cash flow
2.8%
Cash-on-Cash Return
6.3%
Cap rate
0.8%
Rent to Value Ratio
Active
$1,250,000
5
bds
|
8
ba
|
0
sqft
|
built
2020
189 Stump Ridge Rd, Brandon, MS 39047
$-2,532
Cash flow
-10.6%
Cash-on-Cash Return
3.2%
Cap rate
0.4%
Rent to Value Ratio
Active
$325,000
3
bds
|
2
ba
|
0
sqft
|
built
2006
138 Cody Ln, Brandon, MS 39042
$-51
Cash flow
-0.8%
Cash-on-Cash Return
5.5%
Cap rate
0.7%
Rent to Value Ratio
Active
$415,000
3
bds
|
3
ba
|
0
sqft
|
built
2021
1310 Ballast Way, Brandon, MS 39047
$-226
Cash flow
-2.8%
Cash-on-Cash Return
5.0%
Cap rate
0.8%
Rent to Value Ratio
Active
$829,900
5
bds
|
5
ba
|
0
sqft
|
built
2018
5095 Warner Dr, Brandon, MS 39042
$-1,770
Cash flow
-11.1%
Cash-on-Cash Return
3.1%
Cap rate
0.5%
Rent to Value Ratio
Active
$379,000
5
bds
|
5
ba
|
0
sqft
|
built
2005
103 Rosemont Dr, Brandon, MS 39042
$354
Cash flow
4.9%
Cash-on-Cash Return
6.8%
Cap rate
0.9%
Rent to Value Ratio
Active
$389,900
4
bds
|
3
ba
|
0
sqft
|
built
2014
146 Grandeur Dr, Brandon, MS 39042
$-223
Cash flow
-3.0%
Cash-on-Cash Return
5.0%
Cap rate
0.7%
Rent to Value Ratio
Active
$545,000
5
bds
|
5
ba
|
0
sqft
|
built
2002
313 Le Bourgeois Ln, Brandon, MS 39047
$-157
Cash flow
-1.5%
Cash-on-Cash Return
5.3%
Cap rate
0.7%
Rent to Value Ratio
Active
$675,000
3
bds
|
2
ba
|
0
sqft
|
built
1977
1229 Holly Bush Rd, Brandon, MS 39047
$-1,246
Cash flow
-9.6%
Cash-on-Cash Return
3.5%
Cap rate
0.5%
Rent to Value Ratio
Active
$377,000
3
bds
|
3
ba
|
0
sqft
|
built
1993
430 Bay Pointe Cir, Brandon, MS 39047
$-178
Cash flow
-2.5%
Cash-on-Cash Return
5.1%
Cap rate
0.7%
Rent to Value Ratio
Active
$278,000
3
bds
|
3
ba
|
0
sqft
|
built
1972
11 Terrapin Hill Rd S, Brandon, MS 39042
$331
Cash flow
6.2%
Cash-on-Cash Return
7.1%
Cap rate
0.9%
Rent to Value Ratio
Active
$774,900
5
bds
|
4
ba
|
0
sqft
|
built
2005
1106 Pointe Cv, Brandon, MS 39042
$-1,237
Cash flow
-8.3%
Cash-on-Cash Return
3.8%
Cap rate
0.5%
Rent to Value Ratio
Active
$399,900
4
bds
|
2
ba
|
0
sqft
|
built
2008
301 Kitty Hawk Cir, Brandon, MS 39047
$-106
Cash flow
-1.4%
Cash-on-Cash Return
5.4%
Cap rate
0.7%
Rent to Value Ratio

Active
$255,000
3
bds
|
2
ba
|
0
sqft
|
built
2006
809 Jason Cv, Brandon, MS 39047
$44
Cash flow
0.9%
Cash-on-Cash Return
5.9%
Cap rate
0.8%
Rent to Value Ratio
Active
$245,000
3
bds
|
2
ba
|
0
sqft
|
built
1986
102 Live Oak Cv, Brandon, MS 39047
$-142
Cash flow
-3.0%
Cash-on-Cash Return
5.0%
Cap rate
0.7%
Rent to Value Ratio
Active
$449,900
5
bds
|
4
ba
|
0
sqft
|
built
2017
202 Evelyn Ln, Brandon, MS 39042
$-295
Cash flow
-3.4%
Cash-on-Cash Return
4.9%
Cap rate
0.7%
Rent to Value Ratio
Active
$449,900
4
bds
|
4
ba
|
0
sqft
|
built
2013
316 Woodlands Green Pl, Brandon, MS 39047
$67
Cash flow
0.8%
Cash-on-Cash Return
5.9%
Cap rate
0.8%
Rent to Value Ratio
Active
$265,000
4
bds
|
2
ba
|
0
sqft
|
built
2005
555 Lincolns Dr, Brandon, MS 39042
$188
Cash flow
3.7%
Cash-on-Cash Return
6.5%
Cap rate
0.9%
Rent to Value Ratio
Active
$650,000
4
bds
|
4
ba
|
0
sqft
|
built
2005
216 Meadowlands Dr, Brandon, MS 39047
$-991
Cash flow
-8.0%
Cash-on-Cash Return
3.8%
Cap rate
0.5%
Rent to Value Ratio
Active
$272,500
3
bds
|
2
ba
|
0
sqft
|
built
2012
624 Westhill Rd, Brandon, MS 39042
$-44
Cash flow
-0.8%
Cash-on-Cash Return
5.5%
Cap rate
0.8%
Rent to Value Ratio
Active
$235,000
2
bds
|
2
ba
|
0
sqft
|
built
1999
532 Mockingbird Cir, Brandon, MS 39047
$4
Cash flow
0.1%
Cash-on-Cash Return
5.7%
Cap rate
0.7%
Rent to Value Ratio
Active
$99,000
1
bds
|
1
ba
|
0
sqft
|
built
1990
218 Applewood Ln, Brandon, MS 39042
$353
Cash flow
18.6%
Cash-on-Cash Return
10.0%
Cap rate
1.3%
Rent to Value Ratio
Active
$259,500
3
bds
|
2
ba
|
0
sqft
|
built
2014
439 Greenfield Ridge Cir, Brandon, MS 39042
$41
Cash flow
0.8%
Cash-on-Cash Return
5.9%
Cap rate
0.8%
Rent to Value Ratio
Active
$785,000
5
bds
|
5
ba
|
0
sqft
|
built
1958
100 City Limits Rd, Brandon, MS 39042
$-1,955
Cash flow
-13.0%
Cash-on-Cash Return
2.7%
Cap rate
0.4%
Rent to Value Ratio
Active
$999,999
4
bds
|
4
ba
|
0
sqft
|
built
2020
543 Clark Stables Rd, Brandon, MS 39047
$-1,282
Cash flow
-6.7%
Cash-on-Cash Return
4.1%
Cap rate
0.5%
Rent to Value Ratio
Active
$379,900
4
bds
|
3
ba
|
0
sqft
|
built
1994
3087 Louis Wilson Dr, Brandon, MS 39042
$173
Cash flow
2.4%
Cash-on-Cash Return
6.2%
Cap rate
0.8%
Rent to Value Ratio