Covington, LA Investment Properties for Sale
Browse homes for sale and investment properties in Covington, LA. Refine your search by price, property type, or more.
Best cash flowing properties in Covington, LA
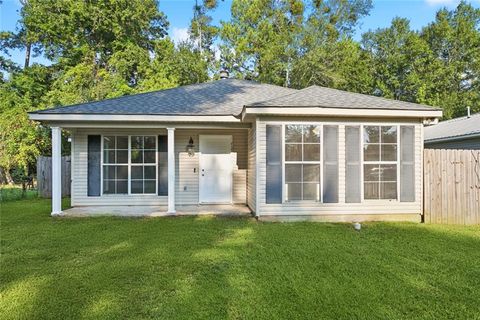
Active
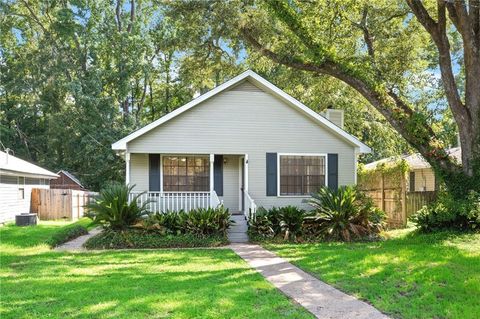
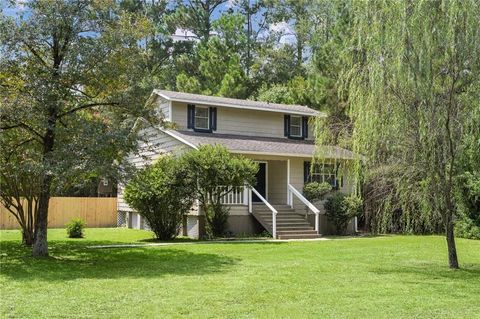
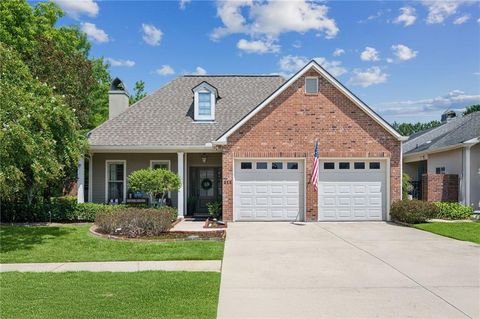
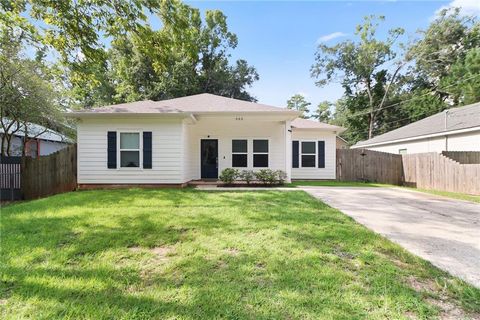
$199,000
3
bds
|
2
ba
|
1,399
sqft
|
built
1988
1012 W 16th Ave, Covington, LA 70433
$438
Cash flow
11.5%
Cash-on-Cash Return
8.3%
Cap rate
1.0%
Rent to Value Ratio
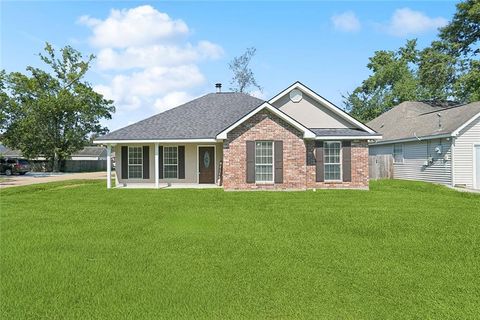
Active
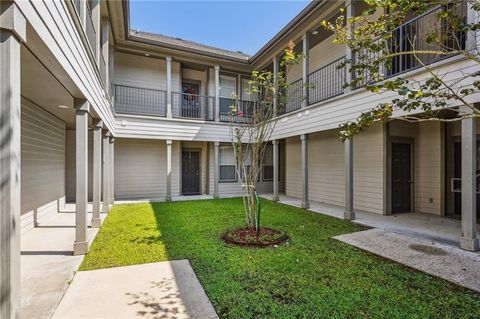
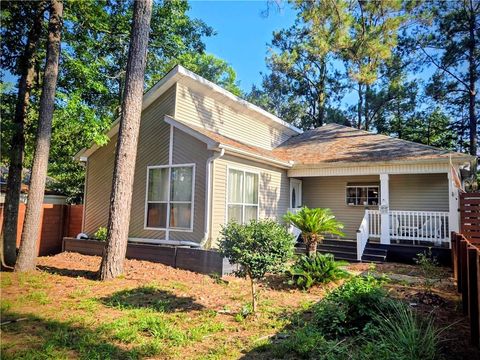
$154,900
2
bds
|
2
ba
|
1,201
sqft
|
built
2007
350 Emerald Forest Blvd, Covington, LA 70433
$302
Cash flow
10.2%
Cash-on-Cash Return
8.0%
Cap rate
1.0%
Rent to Value Ratio
273 out of 317 properties for sale in Covington, LA
Limited Results Shown
Create a free account, or log in to reveal all property listings and enjoy the complete experience.
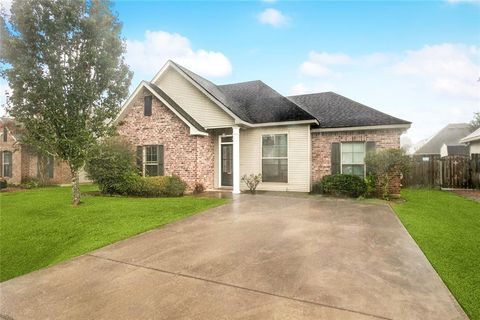
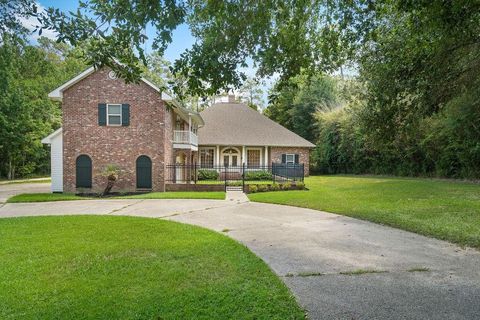
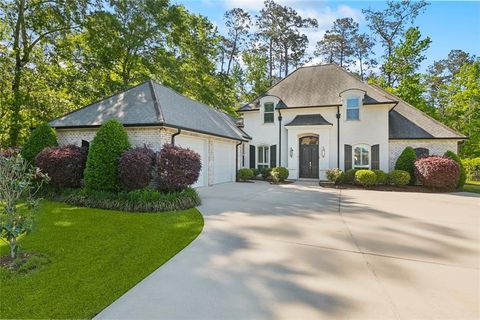
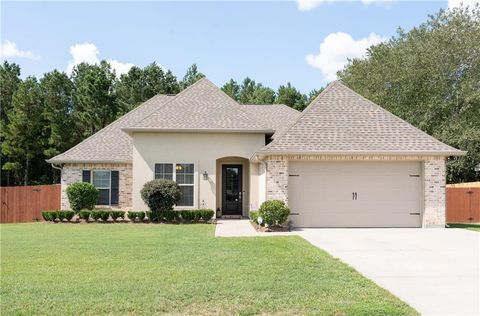
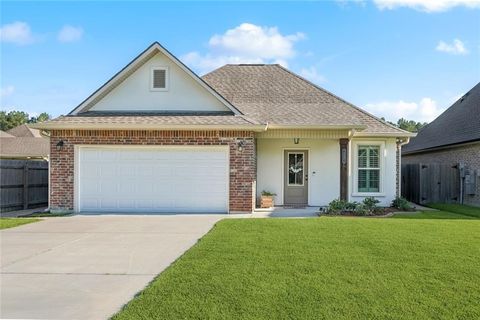
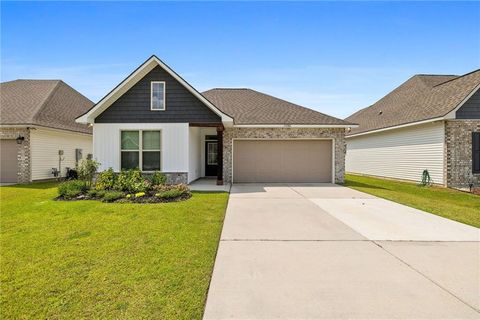
Active
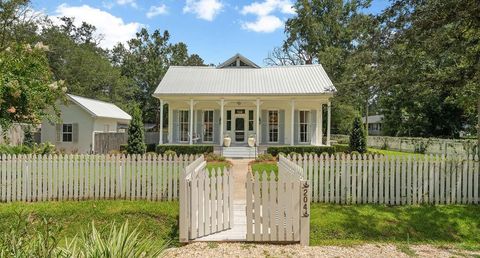
$239,000
3
bds
|
2
ba
|
1,272
sqft
|
built
2007
70076 3rd St, Covington, LA 70433
$42
Cash flow
0.9%
Cash-on-Cash Return
5.9%
Cap rate
0.7%
Rent to Value Ratio
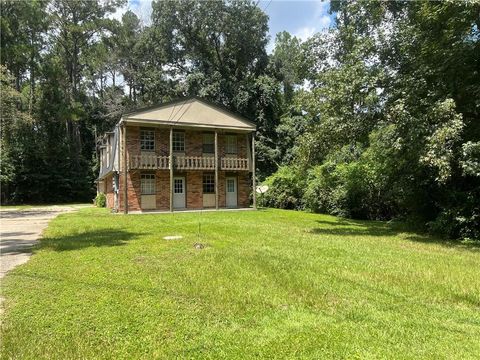
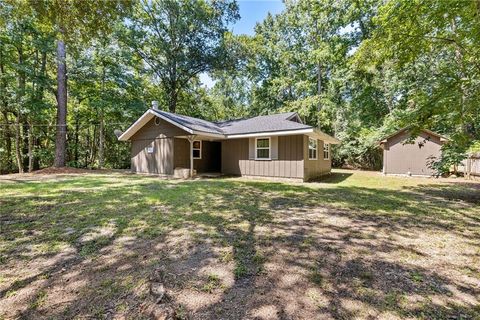
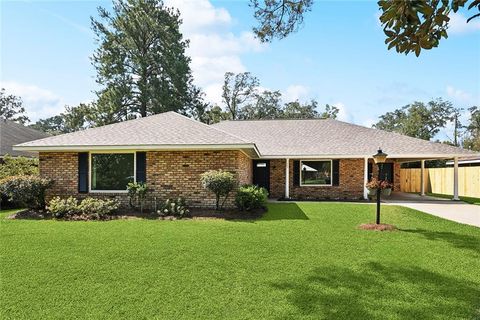
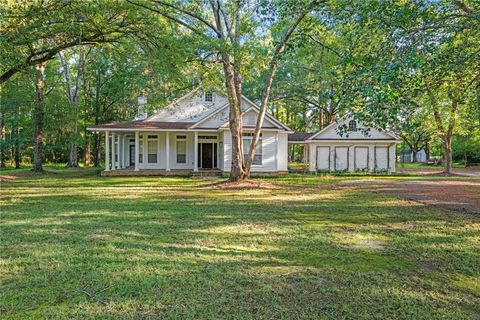
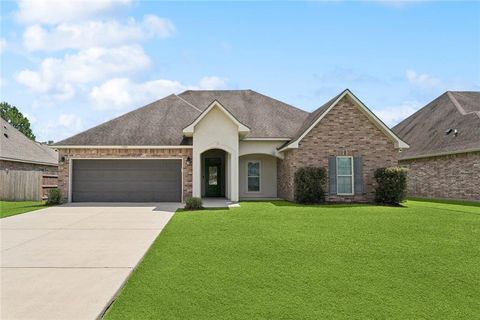
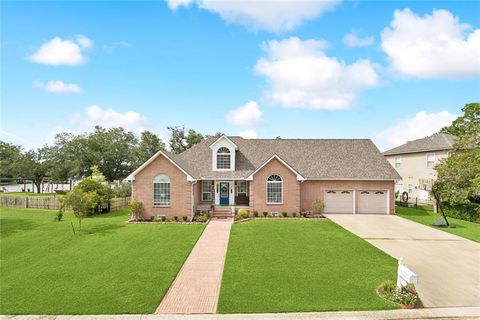
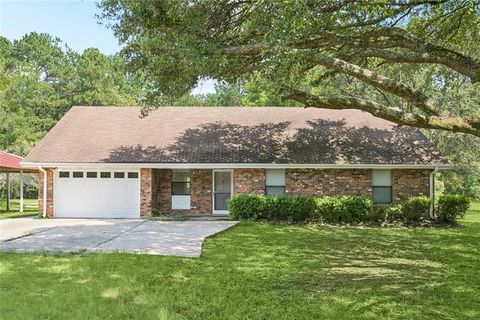
Active
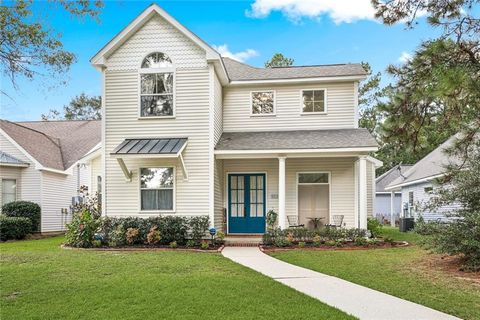
$285,000
4
bds
|
3
ba
|
2,200
sqft
|
built
1987
20121 Helenbirg Rd, Covington, LA 70433
$31
Cash flow
0.6%
Cash-on-Cash Return
5.8%
Cap rate
0.7%
Rent to Value Ratio
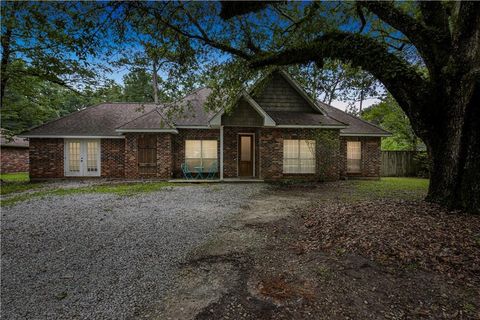
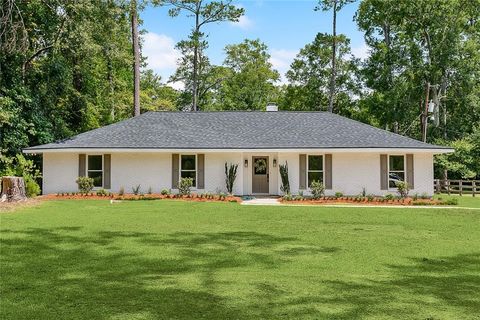
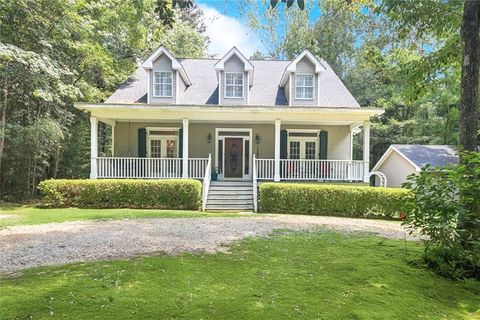
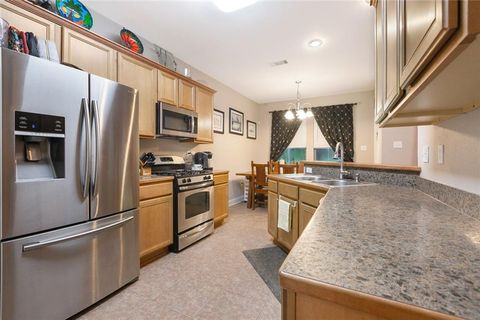
Active
$245,000
3
bds
|
3
ba
|
1,454
sqft
|
built
1986
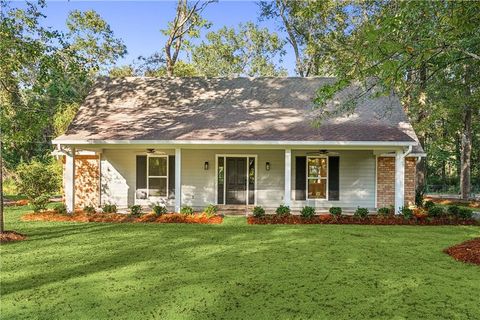
22040 Nolan Rd, Covington, LA 70435
$221
Cash flow
4.7%
Cash-on-Cash Return
6.8%
Cap rate
0.8%
Rent to Value Ratio
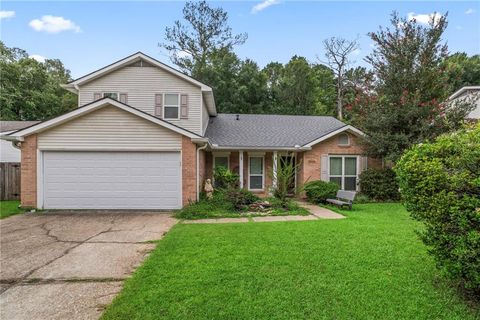
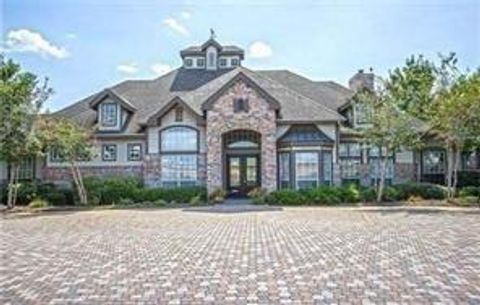
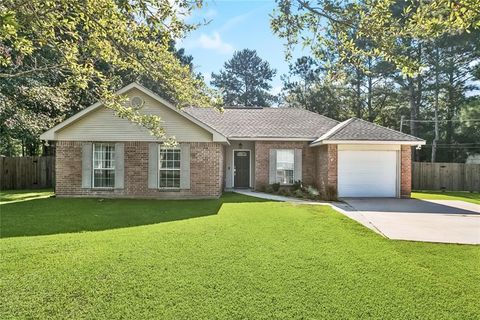
Active
$225,000
3
bds
|
2
ba
|
1,435
sqft
|
built
2001
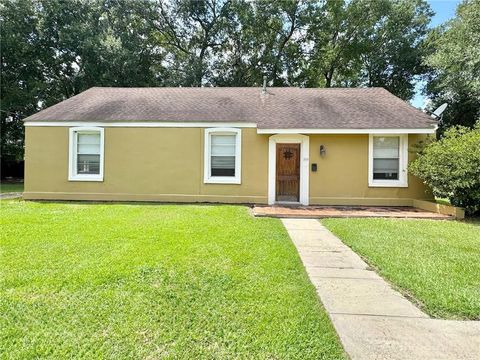
70393 8th St, Covington, LA 70433
$177
Cash flow
4.1%
Cash-on-Cash Return
6.6%
Cap rate
0.8%
Rent to Value Ratio
Active
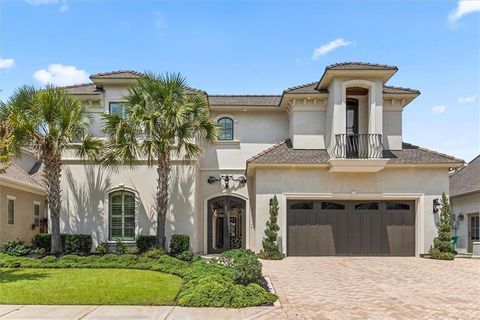
$835,000
5
bds
|
5
ba
|
3,998
sqft
|
built
1999
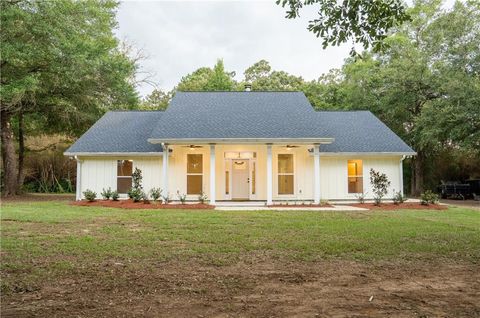
605 Old Landing Rd, Covington, LA 70433
$-432
Cash flow
-2.7%
Cash-on-Cash Return
5.1%
Cap rate
0.6%
Rent to Value Ratio
Active
$208,000
2
bds
|
1
ba
|
1,100
sqft
|
built
1978
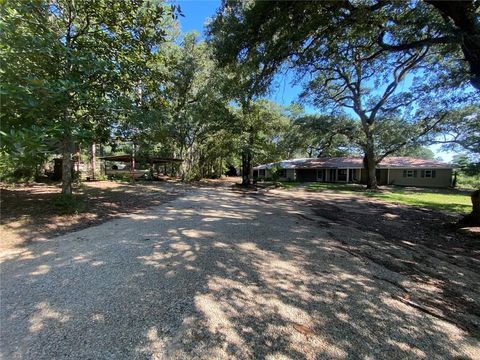
74413 Delta Ave, Covington, LA 70435
$120
Cash flow
3.0%
Cash-on-Cash Return
6.4%
Cap rate
0.8%
Rent to Value Ratio
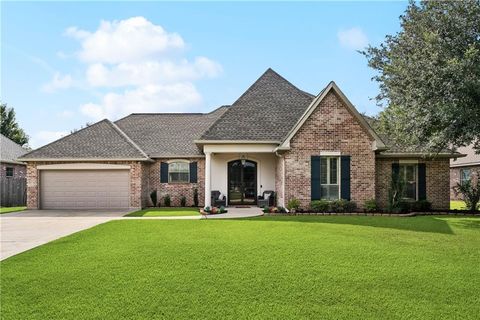
Active
$434,900
3
bds
|
2
ba
|
1,968
sqft
|
built
2007
211 S Orchard Ln, Covington, LA 70433
$-147
Cash flow
-1.8%
Cash-on-Cash Return
5.3%
Cap rate
0.7%
Rent to Value Ratio
Active
$365,000
3
bds
|
2
ba
|
1,858
sqft
|
built
1994
18312 Cusachs Dr, Covington, LA 70433
$-485
Cash flow
-6.9%
Cash-on-Cash Return
4.1%
Cap rate
0.5%
Rent to Value Ratio
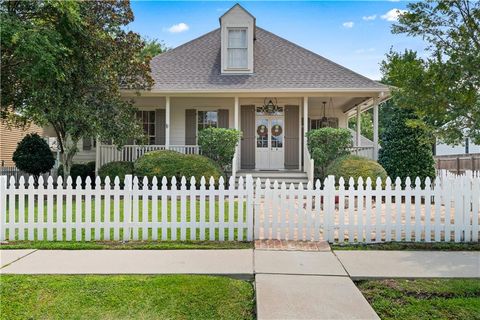
Active
$1,050,000
3
bds
|
3
ba
|
3,032
sqft
|
built
1898
204 W 15th Ave, Covington, LA 70433
$-1,450
Cash flow
-7.2%
Cash-on-Cash Return
4.0%
Cap rate
0.5%
Rent to Value Ratio
Active
$310,000
3
bds
|
3
ba
|
1,825
sqft
|
built
2004
501 Branch Crossing Dr, Covington, LA 70435
$88
Cash flow
1.5%
Cash-on-Cash Return
6.0%
Cap rate
0.7%
Rent to Value Ratio
Active
$1,089,000
5
bds
|
4
ba
|
3,928
sqft
|
built
2015
786 S Corniche Du Lac, Covington, LA 70433
$-2,588
Cash flow
-12.4%
Cash-on-Cash Return
2.8%
Cap rate
0.4%
Rent to Value Ratio
Active
$339,900
3
bds
|
3
ba
|
2,205
sqft
|
built
1998
12145 Jones Rd, Covington, LA 70435
$116
Cash flow
1.8%
Cash-on-Cash Return
6.1%
Cap rate
0.7%
Rent to Value Ratio
Active
$187,500
3
bds
|
2
ba
|
1,150
sqft
|
built
2001
70344 4th St, Covington, LA 70433
$217
Cash flow
6.0%
Cash-on-Cash Return
7.1%
Cap rate
0.9%
Rent to Value Ratio
Active
$315,000
3
bds
|
2
ba
|
1,825
sqft
|
built
2018
653 Terrace Lake Dr, Covington, LA 70435
$-63
Cash flow
-1.0%
Cash-on-Cash Return
5.4%
Cap rate
0.7%
Rent to Value Ratio
Active
$180,000
3
bds
|
2
ba
|
1,309
sqft
|
built
2006
72433 Dahlia St, Covington, LA 70435
$45
Cash flow
1.3%
Cash-on-Cash Return
6.0%
Cap rate
0.7%
Rent to Value Ratio
Active
$885,000
5
bds
|
4
ba
|
4,824
sqft
|
built
2013
680 Millikens Bnd, Covington, LA 70433
$-1,597
Cash flow
-9.4%
Cash-on-Cash Return
3.5%
Cap rate
0.4%
Rent to Value Ratio
Active
$338,000
3
bds
|
2
ba
|
2,164
sqft
|
built
1960
105 Robinhood Dr, Covington, LA 70433
$-87
Cash flow
-1.3%
Cash-on-Cash Return
5.4%
Cap rate
0.7%
Rent to Value Ratio
Active
$399,000
4
bds
|
2
ba
|
2,166
sqft
|
built
2003
171 Egret St, Covington, LA 70433
$-163
Cash flow
-2.1%
Cash-on-Cash Return
5.2%
Cap rate
0.6%
Rent to Value Ratio
Active
$329,900
3
bds
|
2
ba
|
1,638
sqft
|
built
2019
20111 Walden St, Covington, LA 70435
$164
Cash flow
2.6%
Cash-on-Cash Return
6.3%
Cap rate
0.8%
Rent to Value Ratio
Active
$428,000
4
bds
|
2
ba
|
2,208
sqft
|
built
1999
18063 Pheasant Ln, Covington, LA 70435
$-93
Cash flow
-1.1%
Cash-on-Cash Return
5.4%
Cap rate
0.7%
Rent to Value Ratio
Active
$549,900
4
bds
|
3
ba
|
2,953
sqft
|
built
1975
103 Zinnia Dr, Covington, LA 70433
$-394
Cash flow
-3.7%
Cash-on-Cash Return
4.8%
Cap rate
0.6%
Rent to Value Ratio
Active
$300,000
4
bds
|
3
ba
|
2,340
sqft
|
built
2016
120 Wharton St, Covington, LA 70433
$270
Cash flow
4.7%
Cash-on-Cash Return
6.8%
Cap rate
0.8%
Rent to Value Ratio
Active
$310,000
4
bds
|
3
ba
|
1,953
sqft
|
built
2020
12521 Parma Cir, Covington, LA 70435
$65
Cash flow
1.1%
Cash-on-Cash Return
5.9%
Cap rate
0.7%
Rent to Value Ratio
Active
$370,000
4
bds
|
2
ba
|
2,239
sqft
|
built
2013
1504 Dominic Dr, Covington, LA 70435
$-55
Cash flow
-0.8%
Cash-on-Cash Return
5.5%
Cap rate
0.7%
Rent to Value Ratio
Active
$399,999
3
bds
|
7
ba
|
2,686
sqft
|
built
1996
9 Glen Loop, Covington, LA 70435
$-168
Cash flow
-2.2%
Cash-on-Cash Return
5.2%
Cap rate
0.6%
Rent to Value Ratio
Active
$148,500
2
bds
|
2
ba
|
1,200
sqft
|
built
2006
350 Emerald Forest Blvd, Covington, LA 70433
$263
Cash flow
9.2%
Cash-on-Cash Return
7.8%
Cap rate
0.9%
Rent to Value Ratio
Active
$255,000
3
bds
|
2
ba
|
1,401
sqft
|
built
2021
502 E Magee St, Covington, LA 70433
$173
Cash flow
3.5%
Cash-on-Cash Return
6.5%
Cap rate
0.8%
Rent to Value Ratio
Active
$429,000
4
bds
|
3
ba
|
1,951
sqft
|
built
2003
1405 Natchez Loop, Covington, LA 70433
$-123
Cash flow
-1.5%
Cash-on-Cash Return
5.3%
Cap rate
0.7%
Rent to Value Ratio
Active
$479,000
3
bds
|
3
ba
|
2,016
sqft
|
built
2007
649 Place Saint Etienne, Covington, LA 70433
$-382
Cash flow
-4.2%
Cash-on-Cash Return
4.7%
Cap rate
0.6%
Rent to Value Ratio
Active
$535,000
4
bds
|
3
ba
|
2,775
sqft
|
built
1995
14253 S Lakeshore Dr, Covington, LA 70435
$-162
Cash flow
-1.6%
Cash-on-Cash Return
5.3%
Cap rate
0.7%
Rent to Value Ratio
Active
$359,900
3
bds
|
3
ba
|
2,093
sqft
|
built
1982
34 Glen Loop, Covington, LA 70435
$91
Cash flow
1.3%
Cash-on-Cash Return
6.0%
Cap rate
0.7%
Rent to Value Ratio
Active
$350,000
3
bds
|
1
ba
|
1,235
sqft
|
built
1959
333 N Tyler St, Covington, LA 70433
$-828
Cash flow
-12.3%
Cash-on-Cash Return
2.8%
Cap rate
0.3%
Rent to Value Ratio
Active
$368,900
3
bds
|
3
ba
|
2,236
sqft
|
built
2001
76333 Highway 1083, Covington, LA 70435
$-21
Cash flow
-0.3%
Cash-on-Cash Return
5.6%
Cap rate
0.7%
Rent to Value Ratio
Active
$358,000
3
bds
|
3
ba
|
2,773
sqft
|
built
1976
20213 Narrow Rd, Covington, LA 70435
$-314
Cash flow
-4.6%
Cash-on-Cash Return
4.6%
Cap rate
0.6%
Rent to Value Ratio
Active
$299,000
4
bds
|
3
ba
|
1,782
sqft
|
built
2022
11340 Clover Knoll Dr, Covington, LA 70433
$122
Cash flow
2.1%
Cash-on-Cash Return
6.2%
Cap rate
0.8%
Rent to Value Ratio
Active
$245,000
3
bds
|
2
ba
|
1,648
sqft
|
built
1994
18165 Pheasant Ln, Covington, LA 70435
$-124
Cash flow
-2.6%
Cash-on-Cash Return
5.1%
Cap rate
0.6%
Rent to Value Ratio
Active
$269,900
3
bds
|
2
ba
|
1,352
sqft
|
built
2009
132 Eagle Landing Dr, Covington, LA 70435
$78
Cash flow
1.5%
Cash-on-Cash Return
6.0%
Cap rate
0.7%
Rent to Value Ratio
Active
$260,000
3
bds
|
2
ba
|
1,487
sqft
|
built
2001
75522 Beverly Dr, Covington, LA 70435
$12
Cash flow
0.2%
Cash-on-Cash Return
5.7%
Cap rate
0.7%
Rent to Value Ratio