Gulfport, MS Investment Properties for Sale
Browse homes for sale and investment properties in Gulfport, MS. Refine your search by price, property type, or more.
Best cash flowing properties in Gulfport, MS
Active
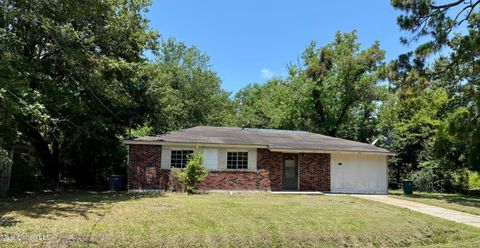
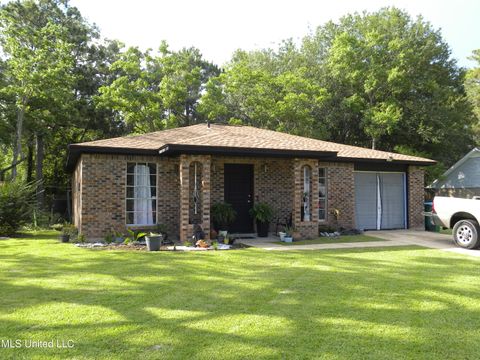
$79,900
3
bds
|
1
ba
|
0
sqft
|
built
1963
3511 Bonita Dr, Gulfport, MS 39501
$409
Cash flow
26.7%
Cash-on-Cash Return
12.4%
Cap rate
1.6%
Rent to Value Ratio
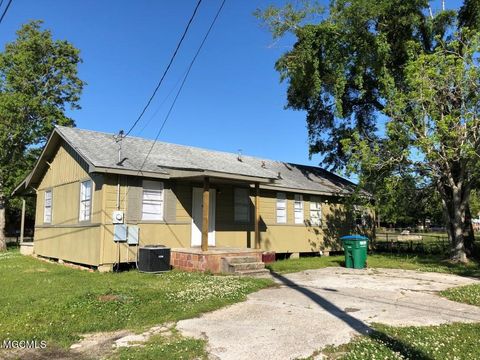
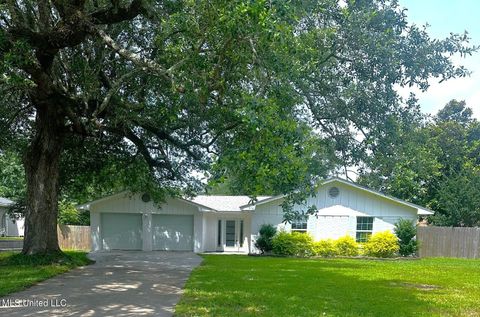
Active
$83,000
3
bds
|
2
ba
|
0
sqft
|
built
1965
1412 Jo Ellen Cir, Gulfport, MS 39501
$391
Cash flow
24.6%
Cash-on-Cash Return
11.9%
Cap rate
1.6%
Rent to Value Ratio
269 out of 292 properties for sale in Gulfport, MS
Limited Results Shown
Create a free account, or log in to reveal all property listings and enjoy the complete experience.
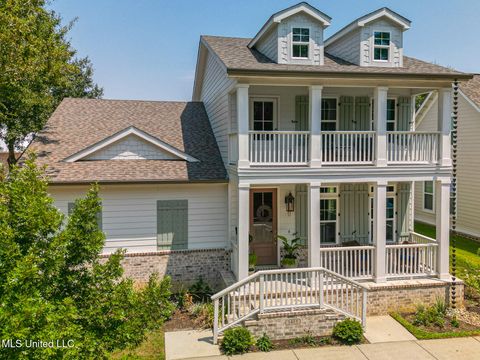
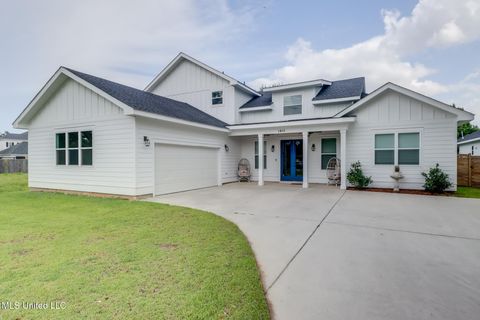
Active
$480,000
4
bds
|
3
ba
|
0
sqft
|
built
2022
1415 Alphabet Rd, Gulfport, MS 39503
$-732
Cash flow
-8.0%
Cash-on-Cash Return
3.9%
Cap rate
0.6%
Rent to Value Ratio
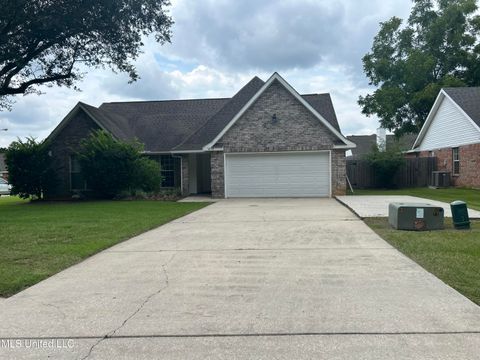
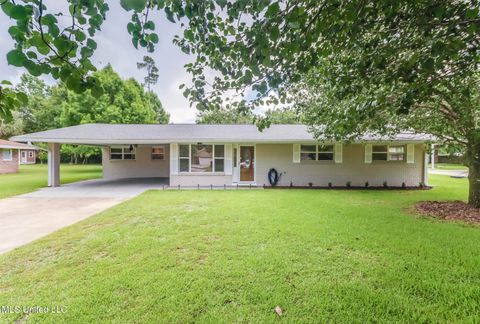
Active
$235,000
4
bds
|
2
ba
|
0
sqft
|
built
2007
14130 Mays Rd, Gulfport, MS 39503
$218
Cash flow
4.8%
Cash-on-Cash Return
6.8%
Cap rate
0.9%
Rent to Value Ratio
Active
$322,000
3
bds
|
2
ba
|
0
sqft
|
built
2001
2252 Beach Dr, Gulfport, MS 39507
$-875
Cash flow
-14.2%
Cash-on-Cash Return
2.4%
Cap rate
0.8%
Rent to Value Ratio
Active
$309,900
4
bds
|
2
ba
|
0
sqft
|
built
1980
69 Bayou Cir, Gulfport, MS 39507
$-67
Cash flow
-1.1%
Cash-on-Cash Return
5.4%
Cap rate
0.8%
Rent to Value Ratio
Active
$150,000
3
bds
|
2
ba
|
0
sqft
|
built
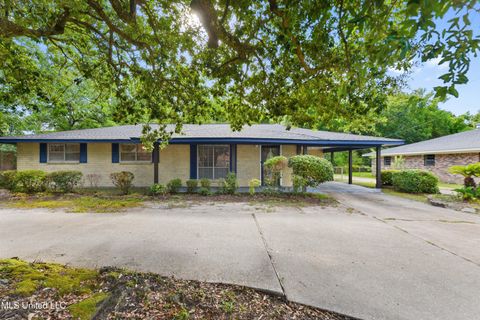
1955
3205 F Ave, Gulfport, MS 39507
$45
Cash flow
1.6%
Cash-on-Cash Return
6.0%
Cap rate
0.8%
Rent to Value Ratio
Active
$275,000
4
bds
|
2
ba
|
0
sqft
|
built
2017
16243 Tougaloo Ln, Gulfport, MS 39503
$140
Cash flow
2.7%
Cash-on-Cash Return
6.3%
Cap rate
0.8%
Rent to Value Ratio
Active
$310,000
4
bds
|
2
ba
|
0
sqft
|
built
2014
15011 Waterside Pl, Gulfport, MS 39503
$136
Cash flow
2.3%
Cash-on-Cash Return
6.2%
Cap rate
0.8%
Rent to Value Ratio
Active
$200,000
2
bds
|
2
ba
|
0
sqft
|
built
1968
14160 John Clark Rd, Gulfport, MS 39503
$125
Cash flow
3.3%
Cash-on-Cash Return
6.4%
Cap rate
0.8%
Rent to Value Ratio
Active
$179,500
4
bds
|
2
ba
|
0
sqft
|
built
1969
2126 31st St, Gulfport, MS 39501
$153
Cash flow
4.4%
Cash-on-Cash Return
6.7%
Cap rate
0.9%
Rent to Value Ratio
Active
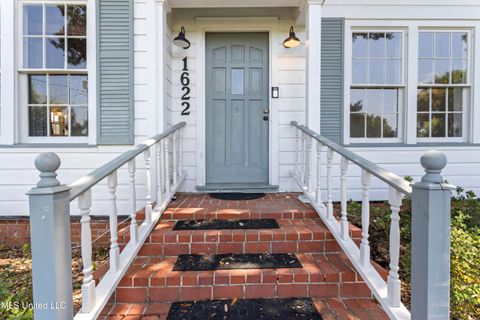
$535,000
3
bds
|
4
ba
|
0
sqft
|
built
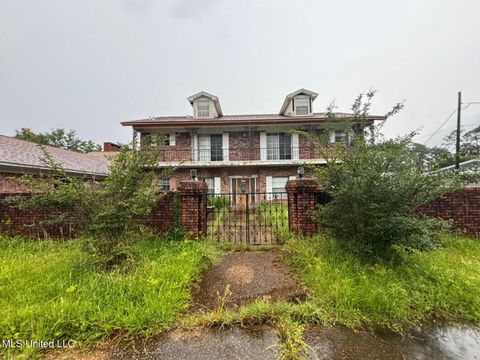
1931
1622 Henderson Ave, Gulfport, MS 39501
$-577
Cash flow
-5.6%
Cash-on-Cash Return
4.4%
Cap rate
0.6%
Rent to Value Ratio
Active
$239,000
3
bds
|
2
ba
|
0
sqft
|
built
2007
11501 Barrone St, Gulfport, MS 39503
$7
Cash flow
0.2%
Cash-on-Cash Return
5.7%
Cap rate
0.8%
Rent to Value Ratio

Active
$239,000
2
bds
|
2
ba
|
0
sqft
|
built
1965
808 Mills Ave, Gulfport, MS 39501
$-106
Cash flow
-2.3%
Cash-on-Cash Return
5.7%
Cap rate
0.8%
Rent to Value Ratio

Active
$525,000
4
bds
|
5
ba
|
0
sqft
|
built
1965
40 54th St, Gulfport, MS 39507
$-592
Cash flow
-5.9%
Cash-on-Cash Return
4.3%
Cap rate
0.6%
Rent to Value Ratio
Active
$385,000
3
bds
|
2
ba
|
0
sqft
|
built
2010
11541 Briarstone Pl, Gulfport, MS 39503
$-472
Cash flow
-6.4%
Cash-on-Cash Return
4.8%
Cap rate
0.6%
Rent to Value Ratio
Active
$235,000
3
bds
|
2
ba
|
0
sqft
|
built
1995
12247 Charwood Ave, Gulfport, MS 39503
$95
Cash flow
2.1%
Cash-on-Cash Return
6.2%
Cap rate
0.8%
Rent to Value Ratio
Active
$184,900
3
bds
|
2
ba
|
0
sqft
|
built
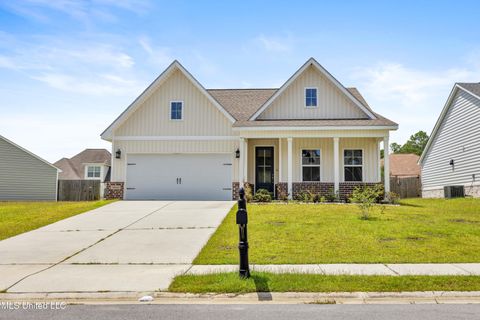
2023
13227 Willow Oak Cir, Gulfport, MS 39503
$207
Cash flow
5.8%
Cash-on-Cash Return
7.0%
Cap rate
1.0%
Rent to Value Ratio
Active
$196,000
6
bds
|
4
ba
|
0
sqft
|
built
2012
12051 Highland Ave, Gulfport, MS 39503
$-253
Cash flow
-6.7%
Cash-on-Cash Return
4.7%
Cap rate
0.7%
Rent to Value Ratio
Active
$399,500
5
bds
|
3
ba
|
0
sqft
|
built
2023
13324 Hawk Pl, Gulfport, MS 39503
$-805
Cash flow
-10.5%
Cash-on-Cash Return
3.8%
Cap rate
0.6%
Rent to Value Ratio
Active
$365,000
4
bds
|
2
ba
|
0
sqft
|
built
1969
56 53rd St, Gulfport, MS 39507
$-341
Cash flow
-4.9%
Cash-on-Cash Return
5.1%
Cap rate
0.7%
Rent to Value Ratio
Active
$119,000
3
bds
|
2
ba
|
0
sqft
|
built
1971
504 Harvey Ave, Gulfport, MS 39503
$257
Cash flow
11.3%
Cash-on-Cash Return
8.9%
Cap rate
1.2%
Rent to Value Ratio
Active
$119,000
3
bds
|
2
ba
|
0
sqft
|
built
1980
921 Sweetgum Dr, Gulfport, MS 39503
$234
Cash flow
10.3%
Cash-on-Cash Return
8.6%
Cap rate
1.2%
Rent to Value Ratio
Active
$259,000
3
bds
|
2
ba
|
0
sqft
|
built
1969
7 Villa Cove Dr, Gulfport, MS 39507
$26
Cash flow
0.5%
Cash-on-Cash Return
5.8%
Cap rate
0.8%
Rent to Value Ratio
Active
$825,000
4
bds
|
3
ba
|
0
sqft
|
built
2022
1411 2nd St, Gulfport, MS 39501
$-1,641
Cash flow
-10.4%
Cash-on-Cash Return
3.3%
Cap rate
0.5%
Rent to Value Ratio

Active
$185,000
3
bds
|
2
ba
|
0
sqft
|
built
2000
14174 N Country Hills Dr, Gulfport, MS 39503
$73
Cash flow
2.1%
Cash-on-Cash Return
6.1%
Cap rate
0.9%
Rent to Value Ratio
Active
$375,000
5
bds
|
3
ba
|
0
sqft
|
built
1960
31 55th St, Gulfport, MS 39507
$-359
Cash flow
-5.0%
Cash-on-Cash Return
5.1%
Cap rate
0.7%
Rent to Value Ratio
Active
$259,900
4
bds
|
3
ba
|
0
sqft
|
built
2004
10510 Steeplechase Dr, Gulfport, MS 39503
$164
Cash flow
3.3%
Cash-on-Cash Return
6.4%
Cap rate
0.8%
Rent to Value Ratio
Active
$279,900
2
bds
|
2
ba
|
0
sqft
|
built
2001
2252 Beach Dr, Gulfport, MS 39507
$-881
Cash flow
-16.4%
Cash-on-Cash Return
1.9%
Cap rate
0.7%
Rent to Value Ratio
Active
$253,500
3
bds
|
2
ba
|
0
sqft
|
built
2021
16918 Alcorn Ave, Gulfport, MS 39503
$-19
Cash flow
-0.4%
Cash-on-Cash Return
5.6%
Cap rate
0.8%
Rent to Value Ratio
Active
$575,000
3
bds
|
2
ba
|
0
sqft
|
built
1935
1338 2nd St, Gulfport, MS 39501
$-1,356
Cash flow
-12.3%
Cash-on-Cash Return
2.8%
Cap rate
0.4%
Rent to Value Ratio
Active
$255,000
5
bds
|
6
ba
|
0
sqft
|
built
1970
4805 Washington Ave, Gulfport, MS 39507
$-70
Cash flow
-1.4%
Cash-on-Cash Return
5.9%
Cap rate
1.0%
Rent to Value Ratio

Active
$245,000
3
bds
|
2
ba
|
0
sqft
|
built
1969
12336 Magnolia Ct, Gulfport, MS 39503
$21
Cash flow
0.4%
Cash-on-Cash Return
5.8%
Cap rate
0.8%
Rent to Value Ratio

Active
$457,000
3
bds
|
3
ba
|
0
sqft
|
built
1977
12 Bayou View Dr, Gulfport, MS 39507
$-1,004
Cash flow
-11.5%
Cash-on-Cash Return
3.6%
Cap rate
0.5%
Rent to Value Ratio
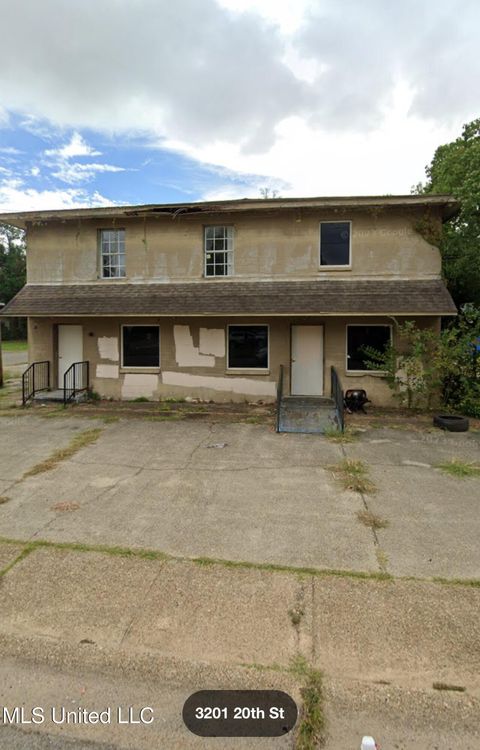
Active
$134,999
4
bds
|
3
ba
|
0
sqft
|
built
1948
3201 20th St, Gulfport, MS 39501
$207
Cash flow
8.0%
Cash-on-Cash Return
7.5%
Cap rate
1.0%
Rent to Value Ratio
Active
$144,000
3
bds
|
2
ba
|
0
sqft
|
built
1974
8022 34th Ave, Gulfport, MS 39501
$179
Cash flow
6.5%
Cash-on-Cash Return
7.2%
Cap rate
1.0%
Rent to Value Ratio

Active
$230,265
4
bds
|
2
ba
|
0
sqft
|
built
2018
13262 Turtle Creek Pkwy, Gulfport, MS 39503
$-52
Cash flow
-1.2%
Cash-on-Cash Return
5.4%
Cap rate
0.8%
Rent to Value Ratio
Active
$282,500
3
bds
|
2
ba
|
0
sqft
|
built
2021
14864 Audubon Lake Blvd, Gulfport, MS 39503
$-152
Cash flow
-2.8%
Cash-on-Cash Return
5.0%
Cap rate
0.7%
Rent to Value Ratio
Active
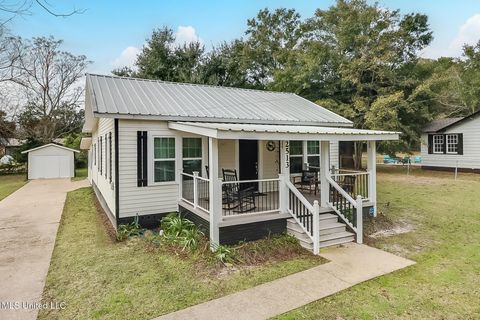
$227,900
3
bds
|
2
ba
|
0
sqft
|
built
1931
2513 Joan Ave, Gulfport, MS 39501
$212
Cash flow
4.9%
Cash-on-Cash Return
6.8%
Cap rate
0.9%
Rent to Value Ratio

Active
$287,500
3
bds
|
2
ba
|
0
sqft
|
built
2022
18109 Evergreen Dr, Gulfport, MS 39503
$-29
Cash flow
-0.5%
Cash-on-Cash Return
6.1%
Cap rate
0.8%
Rent to Value Ratio