
$349,900
Investment Summary
- Monthly Cash Flow
- -$506
- Cap Rate
- 4.4%
- Cash-on-Cash Return
- -7.5%
- Debt Coverage Ratio
- 0.72
- Internal Rate of Return (5 years)
- -3.3%
Cash Flow
Net Operating Income (NOI) minus mortgage payments.
Calculation:
NOI - Mortgage Payments
Cap Rate (Market Value)
Capitalization Rate is a rate of return that compares the yearly Net Operating Income (NOI) to the market value.
Calculation:
NOI / Market Value
Cash-on-Cash Return (CoC)
Annual Cash Flow / Cash Invested
Calculation:
Annual cash flow divided by initial cash invested.
Debt Coverage Ratio (DCR)
Net Operating Income (NOI) divided by total debt payments.
Calculation:
NOI / Total Debt Payments
Internal Rate of Return (IRR)
A metric for assessing profitability over time. IRR is the discount rate at which the net present value (NPV) of all future cash flows (positive and negative) from an investment equals zero — including both periodic cash flow (such as rent) and a projected sale at the end of the holding period. It represents the expected annualized return, accounting for income, expenses, and the recovery of capital through a future sale.
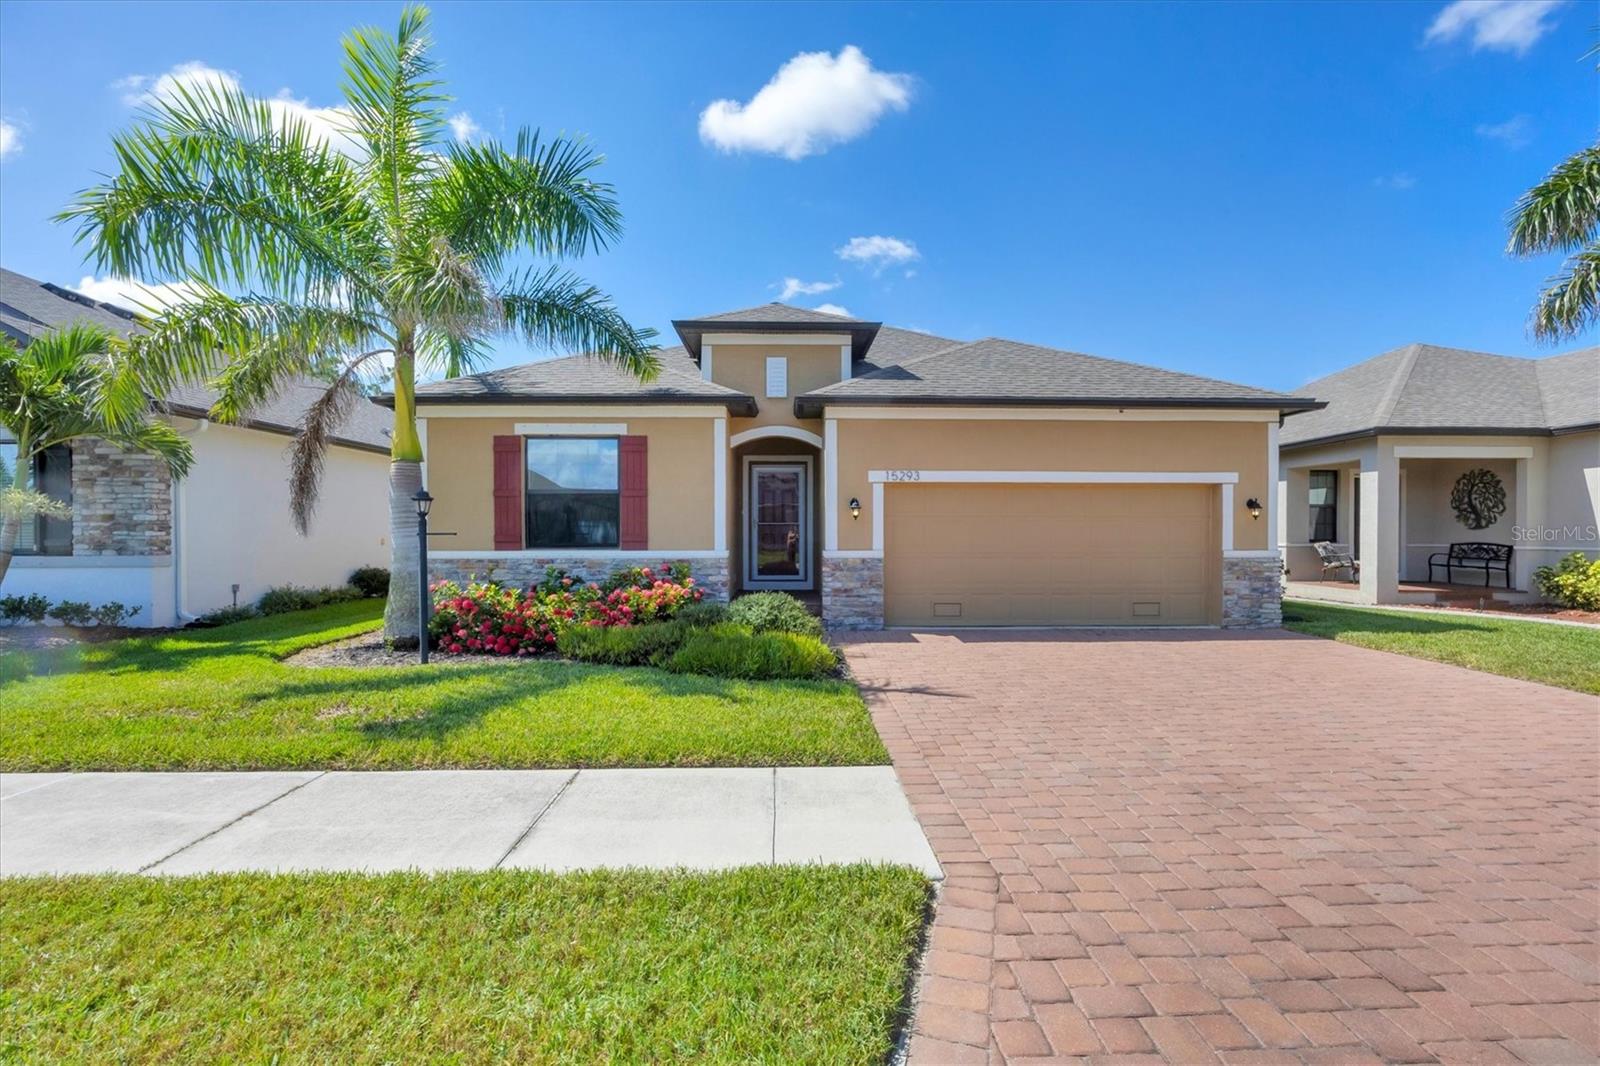
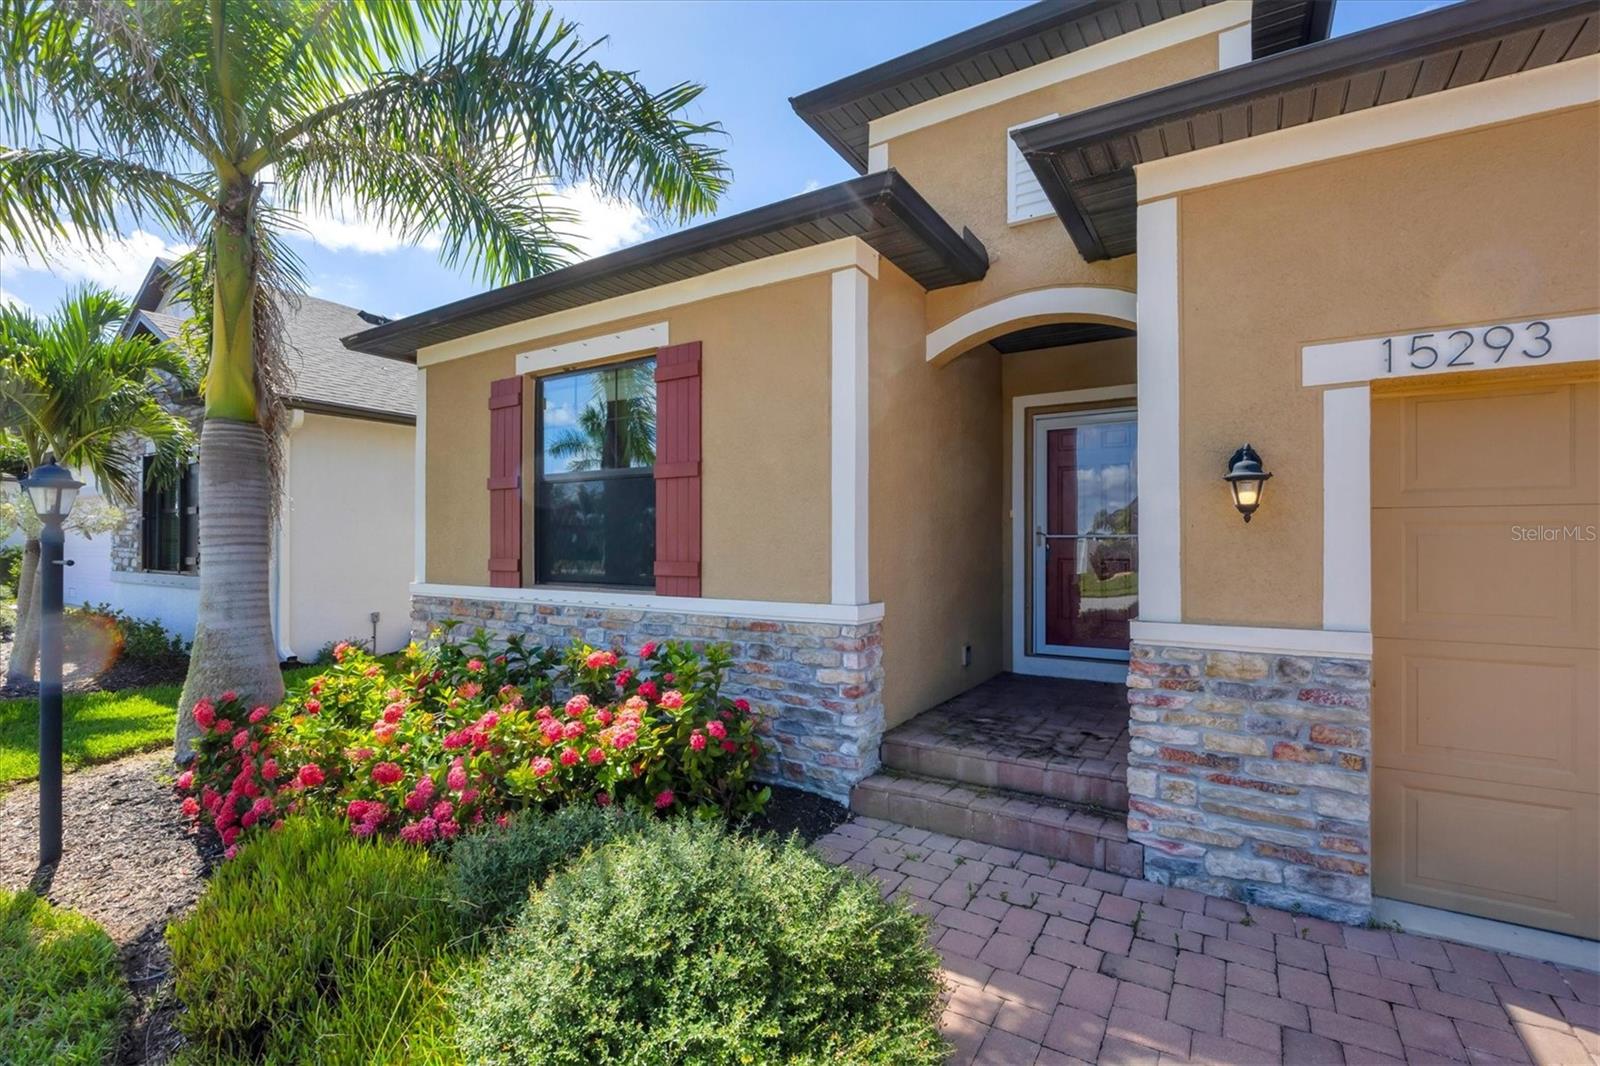
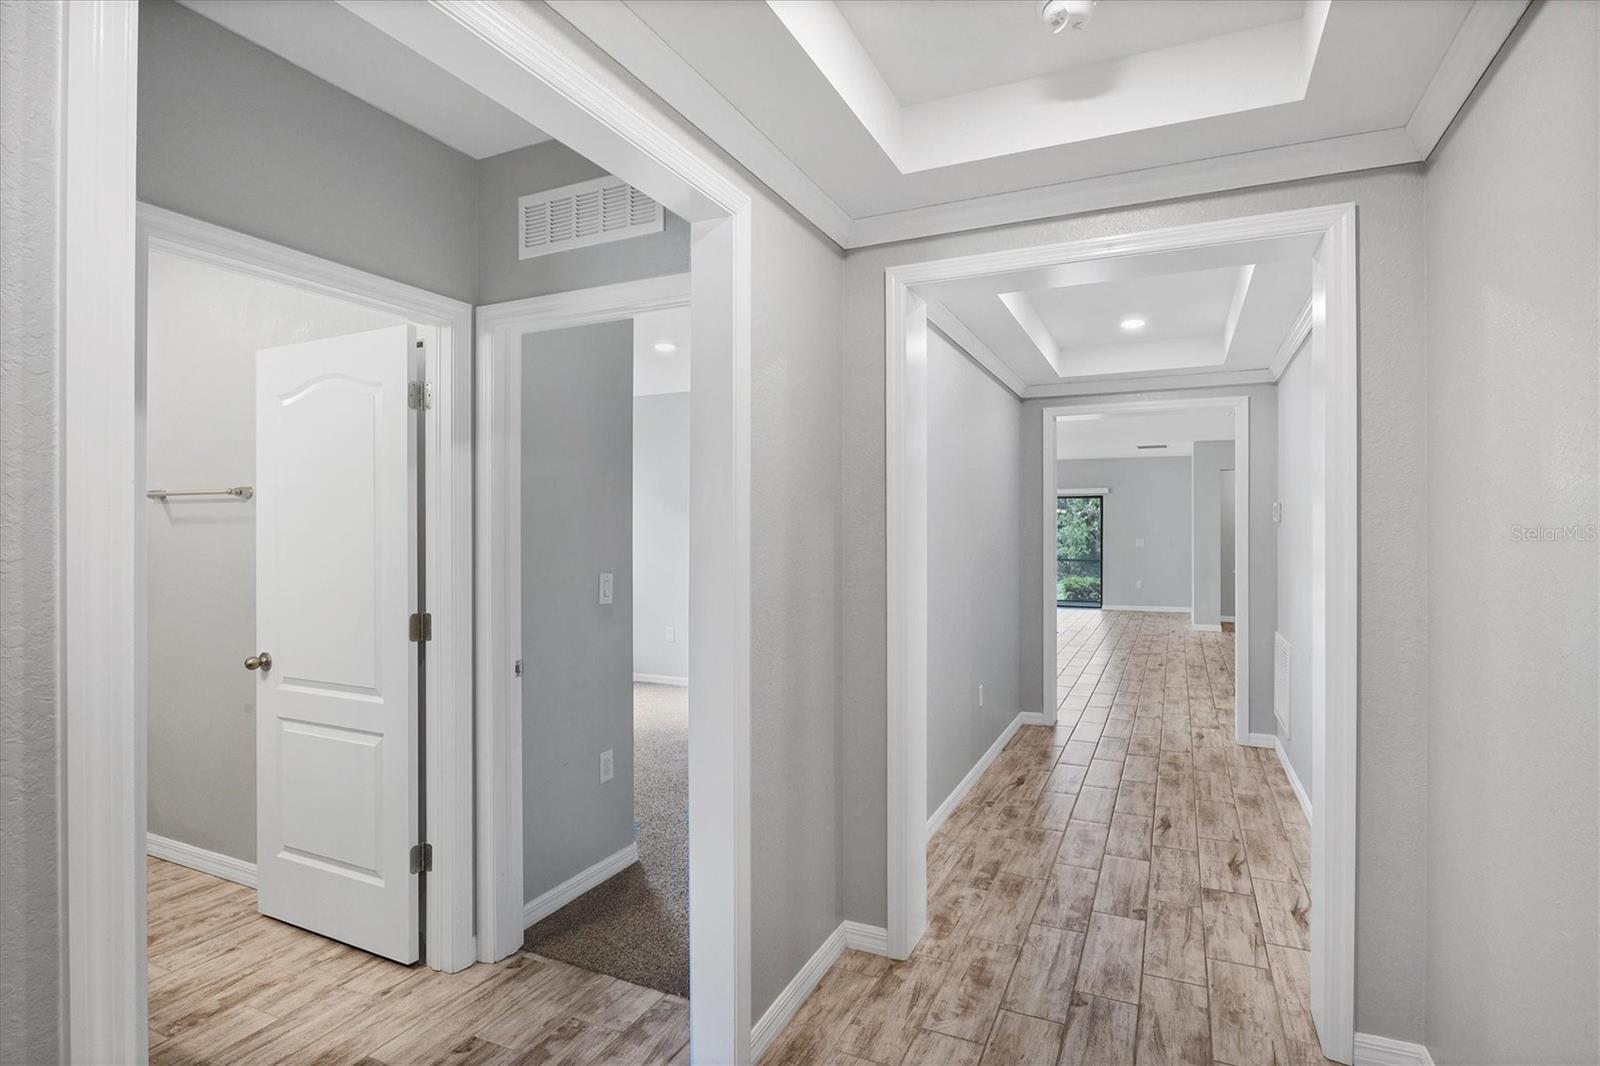
Property Description
4 BEDROOMS/2 baths/2 car garage!!! SOUTHERN LANAI EXPOSURE!!! LOW HOA fees!!! City water and city sewer!!! This VERY POPULAR, gated community is a gem-of-a-find!!! From the moment you drive up to the manicured security gate, enter onto the private streets lined with sidewalks, palm trees, and landscaping, you will feel the warmth of this wonderful community known as VILLA MILANO! As you walk up your paver sidewalk and step into your new WELL-MAINTAINED home, you are set to be impressed! ***Be sure to watch the 3D WALKTHROUGH VIDEO by clicking on the 'Tour 1' button at the top left of this MLS page*** This 2018-built, LIKE-BRAND NEW home is in IMPECCABLE condition WITH NO WORK to do!!! This free-flowing floor plan will have you impressed!!! The quality and attention-to-detail in this particular home is noticeable!!! LARGE OPEN floor plan with 2,161 sq. ft. AC space!!! SUPER-WELL MAINTAINED!!! HUGE GOURMET kitchen and countertop space!!! Your new kitchen offers WOOD CABINETRY with 42" uppers!!! STAINLESS APPLIANCES!!! 2022 refrigerator!!! 2022 dishwasher!!! STONE COUNTERTOPS!!! LAZY SUSAN!!! LUXURIOUS PLANK tile flooring throughout the main living areas!!! 2022 upgraded carpeting in the bedrooms!!! CUSTOM TRIM woodwork with CROWN MOLDING in the entry and primary bedroom!!! Primary suite offers large (MASSIVE) WALK-IN closet, soaking tub, ENCLOSED GLASS SHOWER and DUAL VANITY TOPS! Bedrooms 2 is separate from the large living space and other bedrooms; your guests will enjoy this privacy when the family comes to visit. Guest bedrooms offer CUSTOM CLOSET SHELVING systems for even more storage! HURRICANE SHUTTER PROTECTION for all glass openings! FULLY INSULATED GARAGE ATTIC space to keep the garage cool when you want to play with the toys! Upgraded WIDER DRIVEWAY for ease of parking 2 cars side-by-side! Irrigation system to feed your St. Augustine sod and mature landscaping! LUXURY, SERENITY, SOLITUDE and COMFORT are a few words to describe this home! With our incredible Florida weather, you will want to spend as much time on your SCREENED, private lanai, surrounded by landscaping for additional privacy, relaxing and enjoying the solitude, sights and sounds of your new Florida lifestyle. When it's pool time, take a short walk to the community pool and gather for social time or relaxation. This SMALL, QUAINT, private GATED community nestled in a very private part of town will have you feel like country living but offers all the local amenities just minutes away! The NEW WELLEN PARK is just north alongside the ATLANTA BRAVES COOL TODAY PARK! TAMPA BAY RAYS SPRING TRAINING is almost within WALKING DISTANCE! HISTORIC DOWNTOWN PUNTA GORDA and the NEW SUNSEEKER RESORT are just a few miles to the south! And BOCA GRANDE BEACH, ENGLEWOOD BEACH and VENICE BEACH are a short 20-30 minute drive away!
Build Your Team
Quickly find investor-friendly professionals who can help you succeed in real estate investing at any stage of the investing journey.


Agents
Match with investor-friendly agents who can help you find, analyze, and close your next deal


Lenders
Get the best funding…find investor-friendly lenders who specialize in your deal strategy


Property Managers
Transition to passive investing. Find a trusted property management partnership that lasts.


Tax Pros & Accountants
Taxes and financial reporting made easy—find experts to create tax savings strategies, file taxes, and more
Location
Property Details
Parking
- Description: Garage
- Details: Attached
- Garage Spaces: 2
- Spaces Total: 0
Bedroom Information
- # of Bedrooms: 4
Bathroom Information
- # of Baths (Full): 2
- # of Baths (Total): 2.0
Interior Features
- # of Rooms: 8
- # of Stories: 1
Exterior Features
- Exterior Walls Materials: Composition/Composite
- Foundation: Slab
- Roof Material: Shingle
HOA
- Has HOA: Yes
- Association: CHRIS MCCLUSKEY
- HOA Fee: $340/quarterly
Land Information
- Land Use: Residential
- Land Use Subtype: Single Family Residential
Lot Information
- Parcel ID: 402115138002
- Lot Size: 6500 sqft
Property Information
- Property Type: Single Family Residence
- Style: Florida
- Year Built: 2018
Tax Information
- Annual Tax: $3,911
Utilities
- Water & Sewer: Public
- Heating: Electric
- Cooling: Central Air
Location
- County: Charlotte
Listing Details
Investment Summary
- Monthly Cash Flow
- -$506
- Cap Rate
- 4.4%
- Cash-on-Cash Return
- -7.5%
- Debt Coverage Ratio
- 0.72
- Internal Rate of Return (5 years)
- -3.3%
Cash Flow
Net Operating Income (NOI) minus mortgage payments.
Calculation:
NOI - Mortgage Payments
Cap Rate (Market Value)
Capitalization Rate is a rate of return that compares the yearly Net Operating Income (NOI) to the market value.
Calculation:
NOI / Market Value
Cash-on-Cash Return (CoC)
Annual Cash Flow / Cash Invested
Calculation:
Annual cash flow divided by initial cash invested.
Debt Coverage Ratio (DCR)
Net Operating Income (NOI) divided by total debt payments.
Calculation:
NOI / Total Debt Payments
Internal Rate of Return (IRR)
A metric for assessing profitability over time. IRR is the discount rate at which the net present value (NPV) of all future cash flows (positive and negative) from an investment equals zero — including both periodic cash flow (such as rent) and a projected sale at the end of the holding period. It represents the expected annualized return, accounting for income, expenses, and the recovery of capital through a future sale.
Purchase Details
Purchase PriceThe price paid for the property. Purchase price:
| $349,900 |
|---|---|
Amount FinancedThe amount of the purchase financed through a loan. Amount financed:
| -$279,920 |
Down paymentThe initial payment made towards the purchase. Down payment:
| $69,980 |
Closing CostsFees and expenses associated with purchasing a property, typically ranging from 2% to 5% of the home’s purchase price, paid at the end of a home purchase to cover services like lending, title transfer, and taxes. Closing costs:
| $10,497 |
Rehab CostsCosts incurred to repair or improve the property, including: roof, flooring, exterior siding, kitchen, exterior paint, bathrooms, etc. Rehab costs:
| $0 |
Initial Cash InvestedThe total initial cash invested in the property. Calculation:Down payment + Buying costs + Rehab costs Initial cash invested:
| $80,477 |
Square Feet (SQFT)The total square footage of the property. Square feet:
| 2,161 |
Cost Per Square FootCost per square foot of the property. Calculation:Purchase Price / Square Feet Cost per square foot:
| $162 |
Monthly Rent Per Square FootMonthly rent divided by the number of square feet. This ratio helps investors compare rental income efficiency across properties, markets, and unit sizes Calculation:Monthly Rent / Square Feet Monthly rent per square foot:
| $1.16 |
Financing Details
Loan AmountThe total sum of money borrowed from a lender to finance a property purchase. Calculation:Purchase Price - Down Payment
Loan amount:
| $279,920 |
|---|---|
Loan to Value Ratio (LTV)Loan amount divided by the market value of the property. Calculation:Loan Amount / Market Value
Loan to value ratio:
| 80.0% |
Loan TypeThe type of loan (e.g., fixed, adjustable).
Loan type:
| Amortizing |
TermThe loan repayment period in years.
Term:
| 30 years |
Interest RateThe percentage a lender charges on the borrowed amount of a loan, determining the cost of borrowing money.
Interest rate:
| 6.625% |
Principal & Interest (PI)The principal is the portion of the loan payment that reduces the loan balance. The interest is the lender's charge for borrowing money. Calculation:(P * r * (1 + r) ** n) / ((1 + r) ** n - 1) Where:
P = Loan amount (principal)
Principal & interest:
| $1,792 |
Property TaxesAnnual taxes levied by local governments on real estate properties. These taxes fund public services like schools, roads, and emergency services.
Property tax:
| $326 |
InsuranceThe costs for insurance coverage to protect against financial losses due to risks like fire, natural disasters, theft, liability, or tenant-related damages. Calculation:Assumes 7% of gross rental income, unless insurance rates are specified.
Insurance:
| $175 |
Private Mortgage Insurance (PMI)A fee that borrowers pay when they take out a conventional loan with a loan-to-value (LTV) ratio above 80%.
Private mortgage insurance (PMI):
| $0 |
Monthly PaymentThe fixed amount a borrower pays each month to repay a loan. It typically includes principal and interest (P&I) and may also cover property taxes, insurance, HOA fees, and PMI if escrowed. Monthly payment:
| $2,293 |
Operating Income
| % Rent | Monthly | Yearly | |
|---|---|---|---|
Gross RentThe total rental income received from tenants before deducting any expenses. Includes base rent, late fees, pet fees, parking fees, and other recurring charges.
Gross rent:
| $2,500 | $30,000 | |
Vacancy LossExpected loss of rent due to vacancies.
Vacancy loss:
(6%)
| 6% | -$150 | -$1,800 |
Operating IncomeGross rental income minus vacancy loss. Calculation:Gross rent - Vacancy loss
Operating income:
| $2,350 | $28,200 |
Operating Expenses
| % Rent | Monthly | Yearly | |
|---|---|---|---|
Property TaxesAnnual taxes levied by local governments on real estate properties. These taxes fund public services like schools, roads, and emergency services. | 13% | -$326 | -$3,912 |
InsuranceThe costs for insurance coverage to protect against financial losses due to risks like fire, natural disasters, theft, liability, or tenant-related damages. Calculation:Assumes 7% of gross rental income, unless insurance rates are specified. | 7% | -$175 | -$2,100 |
Property ManagementThe costs associated with hiring a property manager to handle the day-to-day operations of a rental property. Includes management fees, leasing fes, eviction fees, etc. Calculation:Assumes 8% of gross rental income. | 8% | -$200 | -$2,400 |
Repairs & MaintenanceOngoing costs for routine upkeep and minor fixes needed to keep a property in good working condition. Calculation:Assumes 5% of gross rental income. Varies by property age and condition. | 5% | -$125 | -$1,500 |
Capital ExpensesLarge, infrequent costs for major improvements or replacements, like a new roof, HVAC system, or appliances. Calculation:Assumes 5% of gross rental income. Varies by property age. | 5% | -$125 | -$1,500 |
HOA FeesRegular dues paid to a Homeowners Association for community maintenance, amenities, and management. Similar fees include: Condo Association Fees, Co-op Maintenance Fees, etc. | 5% | -$113 | -$1,356 |
Operating ExpensesRecurring costs required to maintain and manage a rental property, including property taxes, insurance, maintenance, repairs, utilities (if paid by the owner), property management fees, and other day-to-day expenses. Calculation:Insurance + Property Taxes + Property Management + Repairs & Maintenance + Capital Expenditures + HOA Fees | 43% | -$1,064 | -$12,768 |
Cash Flow
| Monthly | Yearly | |
|---|---|---|
Net Operating Income (NOI)The income generated from a property after deducting all operating expenses but before deducting mortgage payments, taxes, and capital expenditures. Calculation:Gross Operating Income - Operating Expenses
Net operating income:
| $1,286 | $15,432 |
Mortgage PaymentThe fixed amount a borrower pays each month to repay a loan. It typically includes principal and interest (P&I) and may also cover property taxes, insurance, HOA fees, and PMI if escrowed. | -$1,792 | -$21,504 |
Cash FlowNet Operating Income (NOI) minus mortgage payments. Calculation:NOI - Mortgage Payments | $506 | $6,072 |