$589,900
Investment Summary
- Monthly Cash Flow
- -$1,411
- Cap Rate
- 3.3%
- Cash-on-Cash Return
- -12.5%
- Debt Coverage Ratio
- 0.53
- Internal Rate of Return (5 years)
- -8.1%
Cash Flow
Net Operating Income (NOI) minus mortgage payments.
Calculation:
NOI - Mortgage Payments
Cap Rate (Market Value)
Capitalization Rate is a rate of return that compares the yearly Net Operating Income (NOI) to the market value.
Calculation:
NOI / Market Value
Cash-on-Cash Return (CoC)
Annual Cash Flow / Cash Invested
Calculation:
Annual cash flow divided by initial cash invested.
Debt Coverage Ratio (DCR)
Net Operating Income (NOI) divided by total debt payments.
Calculation:
NOI / Total Debt Payments
Internal Rate of Return (IRR)
A metric for assessing profitability over time. IRR is the discount rate at which the net present value (NPV) of all future cash flows (positive and negative) from an investment equals zero — including both periodic cash flow (such as rent) and a projected sale at the end of the holding period. It represents the expected annualized return, accounting for income, expenses, and the recovery of capital through a future sale.
Property Description
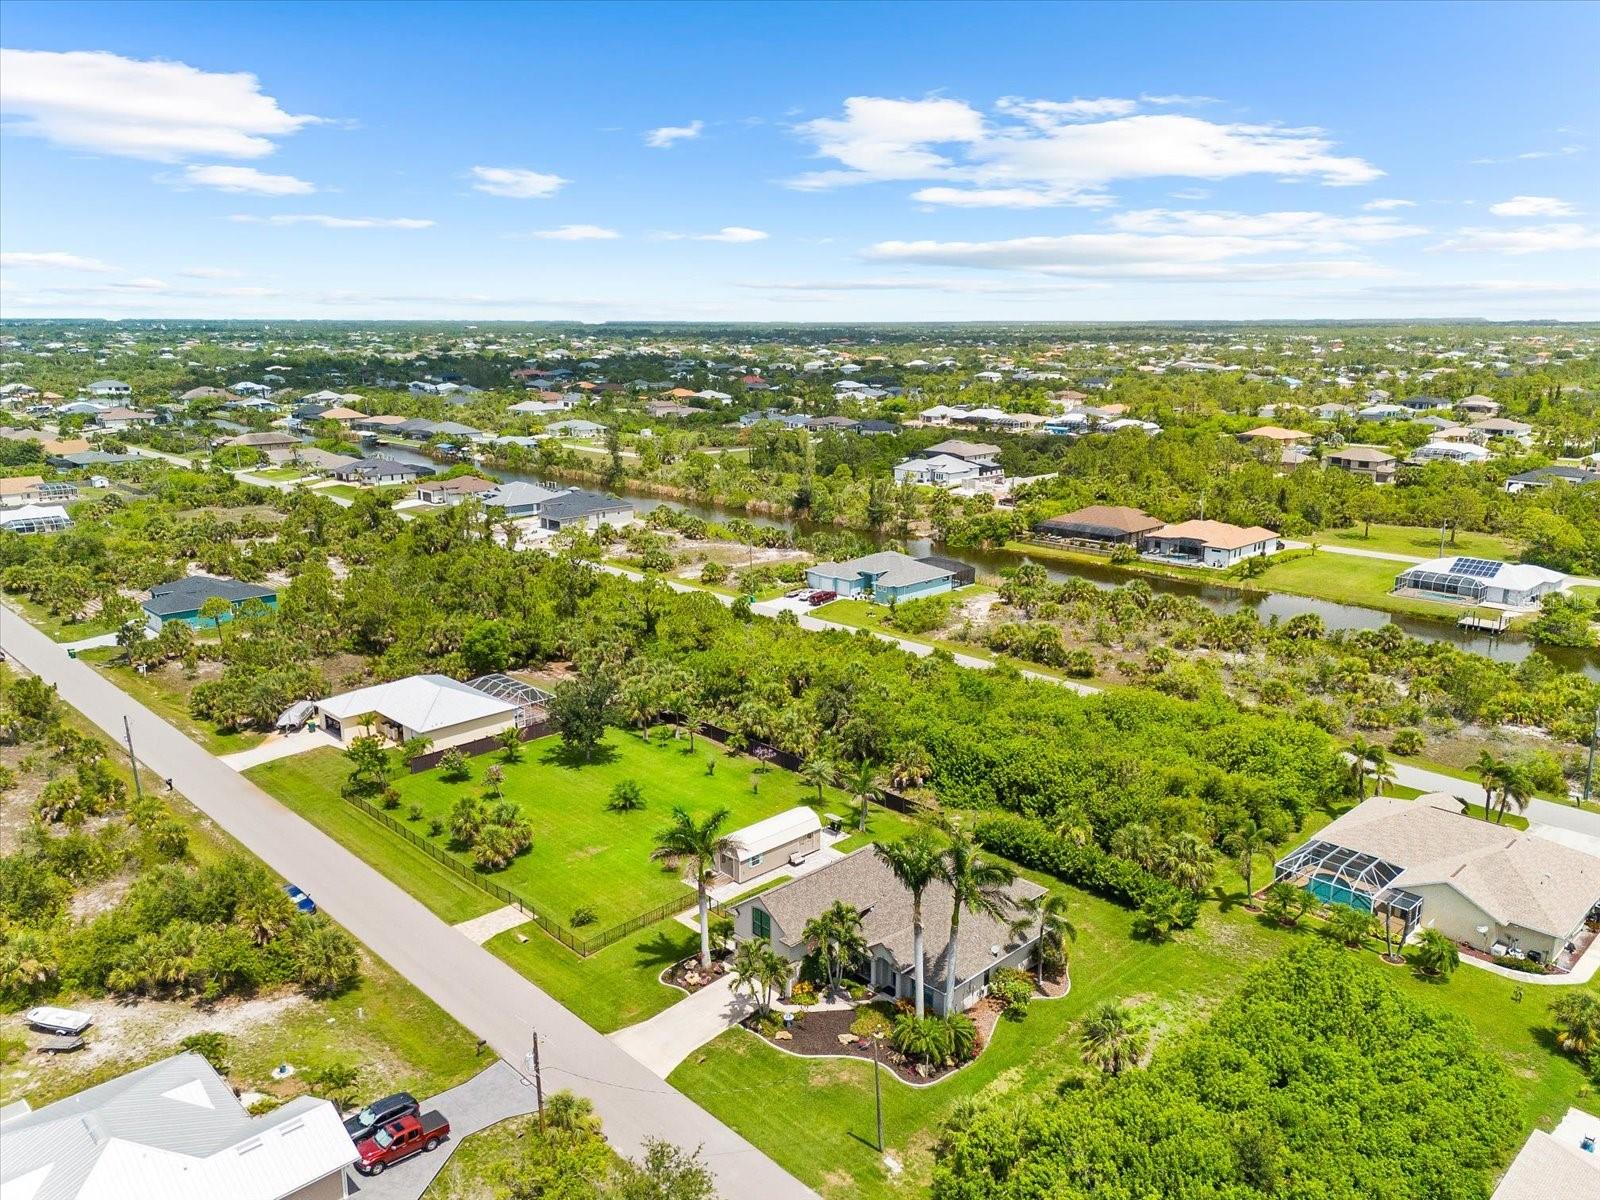
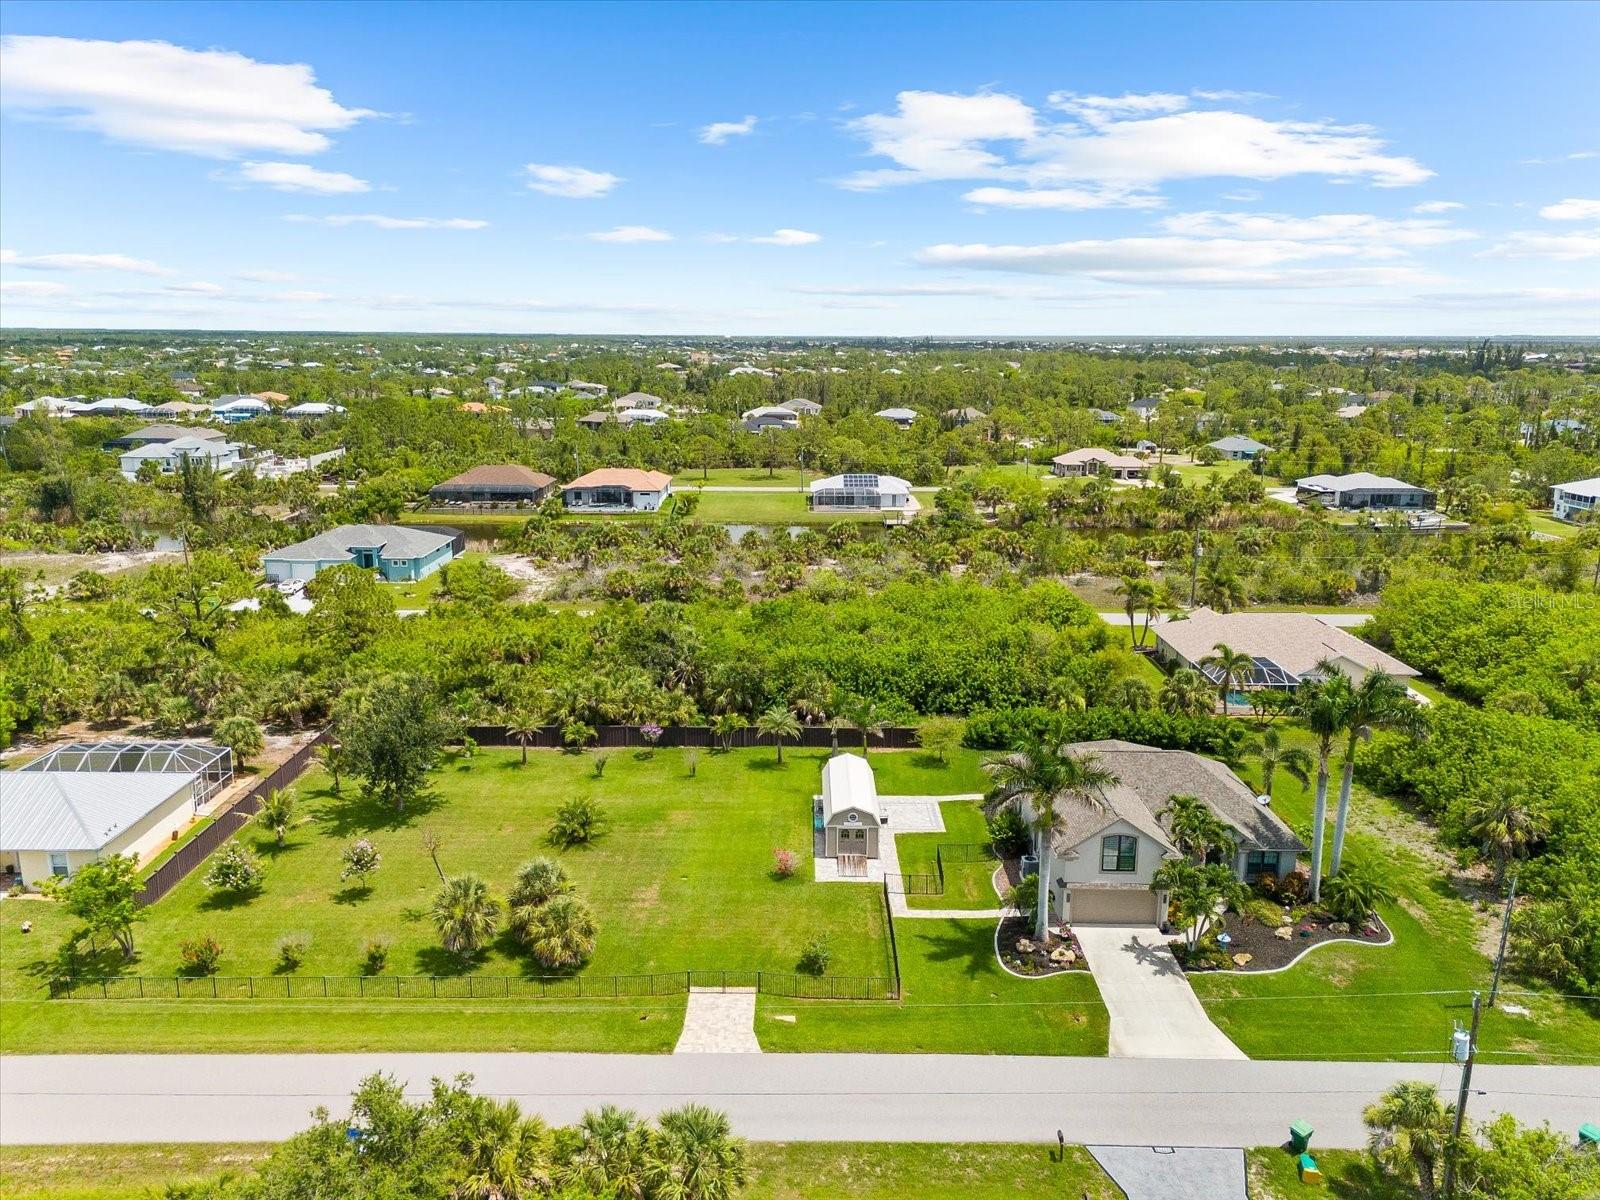
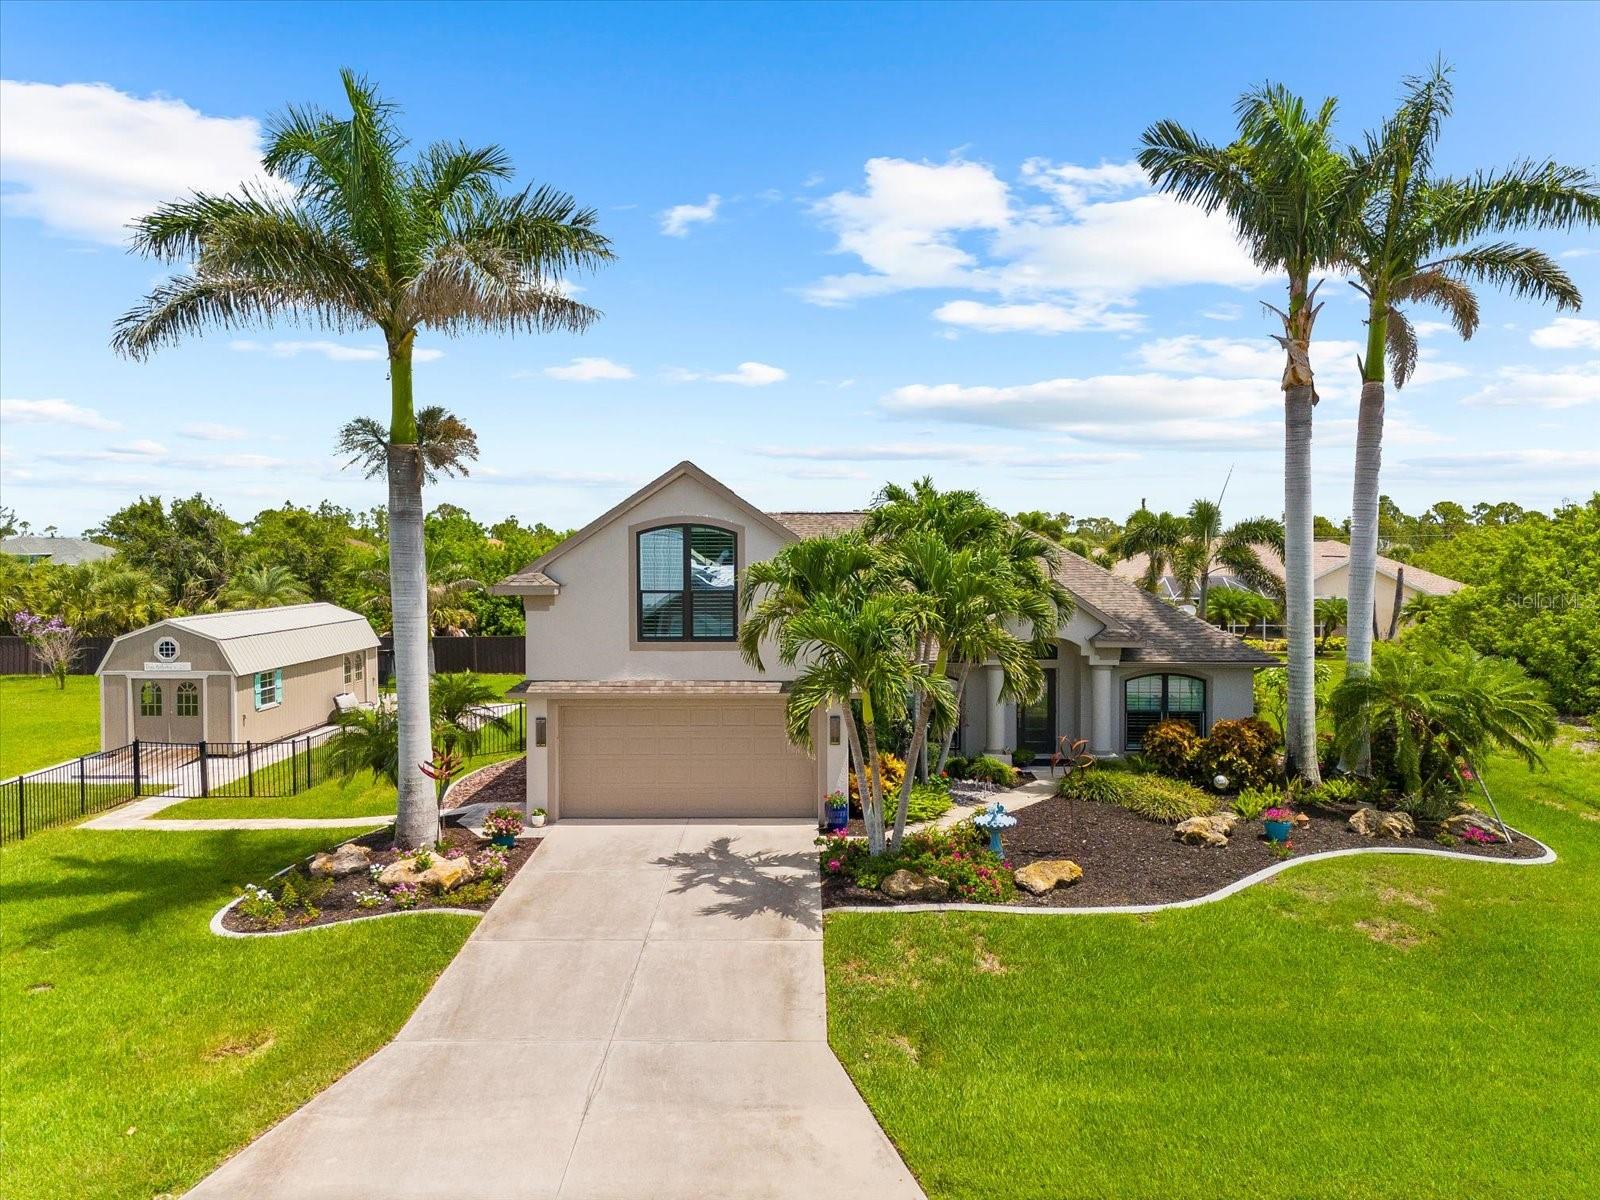
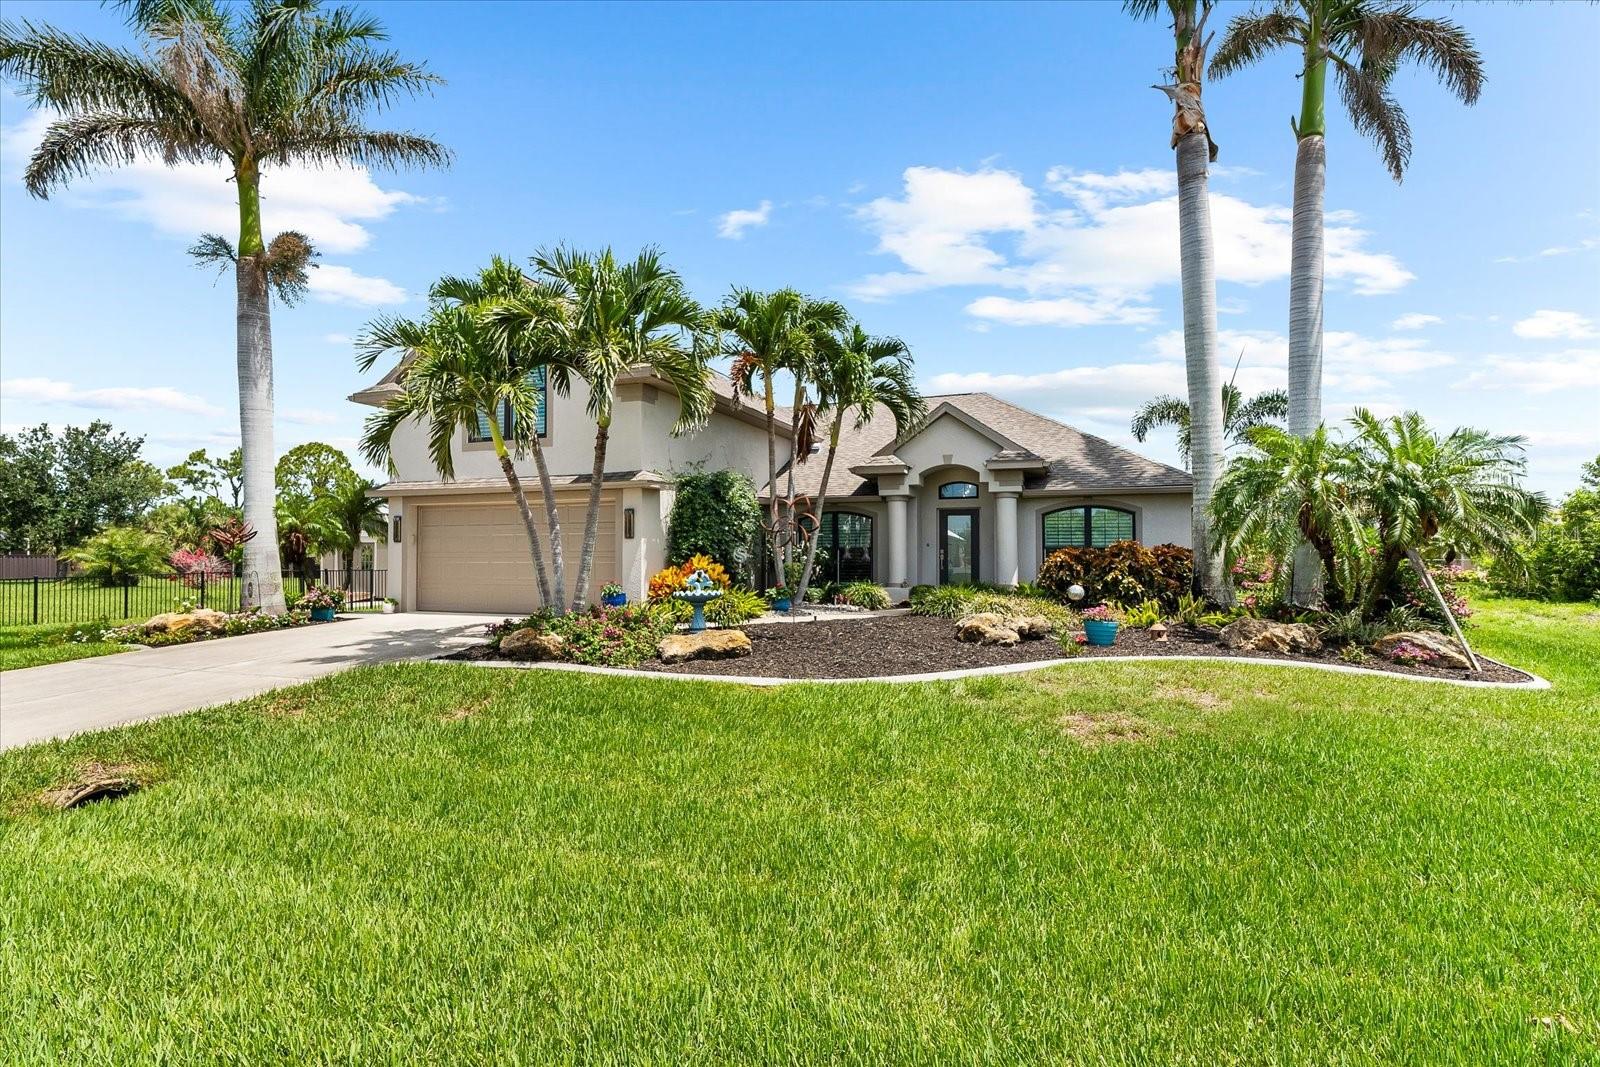
Under contract-accepting backup offers. Welcome to a one-of-a-kind coastal estate in the heart of a premier waterfront boating community. Situated on three fully irrigated, lushly landscaped lots, this exquisite 5-bedroom, 3-bath home redefines luxury living with its curated, high-end custom finishes and expansive estate feel—just 10 miles from the world-renowned beaches of Boca Grande. From the moment you arrive, the home’s mature tropical landscaping and elegant fencing provide both privacy and a grand sense of arrival. The Trex privacy fence and black aluminum accents frame the property beautifully, while a second driveway and culvert offer added convenience for guests, RVs, or future enhancements. Inside, no detail has been overlooked. Plantation shutters and porcelain tile flooring flow throughout light-filled spaces, complemented by brand-new designer lighting and fans. The open-concept floor plan is elevated by custom cabinetry at every turn—including built-ins, wall units, and thoughtfully designed storage that blends functionality with style. The chef’s kitchen is a true showstopper—anchored by a massive 10-foot island wrapped in high-end Cambria quartz. Thoughtfully designed for both entertaining and everyday living, this space features top-of-the-line appliances, sleek fixtures, and extensive custom cabinetry. Retreat to the first-floor primary suite, where you’ll find luxurious touches like more custom cabinetry, two oversized custom closets, and a spa-like en suite bath with dual vanities and a walk-in shower. A second upstairs primary suite—with its own private en suite and walk-in closet—offers flexible space ideal for in-laws, extended family, or older children. Guest bedrooms are privately situated on the opposite side of the home for maximum comfort. This estate was designed for both beauty and peace of mind, featuring impact-rated windows and doors, hurricane shutters, and premium finishes throughout. Recent updates include a new roof (2022), along with new A/C ductwork, upgraded insulation, and impact windows and doors, ensuring energy efficiency and long-term comfort. These thoughtful enhancements provide lasting value and security. On the side of the property sits a 12x 32 fully powered outbuilding—your future she-shed, cabana, workshop, home office, gym, or creative retreat. With three oversized lots, the possibilities are endless: build your dream swimming pool and outdoor entertaining space, add a toy garage for your RV or boat, create the cabana you’ve always imagined, or simply enjoy the luxury of space and privacy. Want water access without the maintenance? You can park your boat at the nearby marina for easy, secure storage and enjoy the waterfront lifestyle with convenience. This is not just a remodeled home—it’s a finely crafted, custom coastal estate offering rare luxury, space, and flexibility just minutes from the beach.
Build Your Team
Quickly find investor-friendly professionals who can help you succeed in real estate investing at any stage of the investing journey.


Agents
Match with investor-friendly agents who can help you find, analyze, and close your next deal


Lenders
Get the best funding…find investor-friendly lenders who specialize in your deal strategy


Property Managers
Transition to passive investing. Find a trusted property management partnership that lasts.


Tax Pros & Accountants
Taxes and financial reporting made easy—find experts to create tax savings strategies, file taxes, and more
Location
Property Details
Parking
- Description: Driveway, Guest, Open, Parking Pad
- Details: Attached
- Garage Spaces: 2
- Spaces Total: 0
Bedroom Information
- # of Bedrooms: 5
Bathroom Information
- # of Baths (Full): 3
- # of Baths (Total): 3.0
Interior Features
- # of Rooms: 14
- # of Stories: 2
Exterior Features
- Exterior Walls Materials: Composition/Composite
- Foundation: Block
- Roof Material: Shingle
HOA
- Has HOA: Yes
- Association: Sheryl Blocklin
- HOA Fee: $120/annually
Land Information
- Land Use: Residential
- Land Use Subtype: Single Family Residential
Lot Information
- Parcel ID: 412127186023
- Lot Size: 30000 sqft
Property Information
- Property Type: Single Family Residence
- Year Built: 2006
Tax Information
- Annual Tax: $4,563
Utilities
- Water & Sewer: Private, Public, Well
- Heating: Central
- Cooling: Central Air
Location
- County: Charlotte
Listing Details
Investment Summary
- Monthly Cash Flow
- -$1,411
- Cap Rate
- 3.3%
- Cash-on-Cash Return
- -12.5%
- Debt Coverage Ratio
- 0.53
- Internal Rate of Return (5 years)
- -8.1%
Cash Flow
Net Operating Income (NOI) minus mortgage payments.
Calculation:
NOI - Mortgage Payments
Cap Rate (Market Value)
Capitalization Rate is a rate of return that compares the yearly Net Operating Income (NOI) to the market value.
Calculation:
NOI / Market Value
Cash-on-Cash Return (CoC)
Annual Cash Flow / Cash Invested
Calculation:
Annual cash flow divided by initial cash invested.
Debt Coverage Ratio (DCR)
Net Operating Income (NOI) divided by total debt payments.
Calculation:
NOI / Total Debt Payments
Internal Rate of Return (IRR)
A metric for assessing profitability over time. IRR is the discount rate at which the net present value (NPV) of all future cash flows (positive and negative) from an investment equals zero — including both periodic cash flow (such as rent) and a projected sale at the end of the holding period. It represents the expected annualized return, accounting for income, expenses, and the recovery of capital through a future sale.
Purchase Details
Purchase PriceThe price paid for the property. Purchase price:
| $589,900 |
|---|---|
Amount FinancedThe amount of the purchase financed through a loan. Amount financed:
| -$471,920 |
Down paymentThe initial payment made towards the purchase. Down payment:
| $117,980 |
Closing CostsFees and expenses associated with purchasing a property, typically ranging from 2% to 5% of the home’s purchase price, paid at the end of a home purchase to cover services like lending, title transfer, and taxes. Closing costs:
| $17,697 |
Rehab CostsCosts incurred to repair or improve the property, including: roof, flooring, exterior siding, kitchen, exterior paint, bathrooms, etc. Rehab costs:
| $0 |
Initial Cash InvestedThe total initial cash invested in the property. Calculation:Down payment + Buying costs + Rehab costs Initial cash invested:
| $135,677 |
Square Feet (SQFT)The total square footage of the property. Square feet:
| 2,853 |
Cost Per Square FootCost per square foot of the property. Calculation:Purchase Price / Square Feet Cost per square foot:
| $207 |
Monthly Rent Per Square FootMonthly rent divided by the number of square feet. This ratio helps investors compare rental income efficiency across properties, markets, and unit sizes Calculation:Monthly Rent / Square Feet Monthly rent per square foot:
| $1.02 |
Financing Details
Loan AmountThe total sum of money borrowed from a lender to finance a property purchase. Calculation:Purchase Price - Down Payment
Loan amount:
| $471,920 |
|---|---|
Loan to Value Ratio (LTV)Loan amount divided by the market value of the property. Calculation:Loan Amount / Market Value
Loan to value ratio:
| 80.0% |
Loan TypeThe type of loan (e.g., fixed, adjustable).
Loan type:
| Amortizing |
TermThe loan repayment period in years.
Term:
| 30 years |
Interest RateThe percentage a lender charges on the borrowed amount of a loan, determining the cost of borrowing money.
Interest rate:
| 6.625% |
Principal & Interest (PI)The principal is the portion of the loan payment that reduces the loan balance. The interest is the lender's charge for borrowing money. Calculation:(P * r * (1 + r) ** n) / ((1 + r) ** n - 1) Where:
P = Loan amount (principal)
Principal & interest:
| $3,022 |
Property TaxesAnnual taxes levied by local governments on real estate properties. These taxes fund public services like schools, roads, and emergency services.
Property tax:
| $380 |
InsuranceThe costs for insurance coverage to protect against financial losses due to risks like fire, natural disasters, theft, liability, or tenant-related damages. Calculation:Assumes 7% of gross rental income, unless insurance rates are specified.
Insurance:
| $203 |
Private Mortgage Insurance (PMI)A fee that borrowers pay when they take out a conventional loan with a loan-to-value (LTV) ratio above 80%.
Private mortgage insurance (PMI):
| $0 |
Monthly PaymentThe fixed amount a borrower pays each month to repay a loan. It typically includes principal and interest (P&I) and may also cover property taxes, insurance, HOA fees, and PMI if escrowed. Monthly payment:
| $3,605 |
Operating Income
| % Rent | Monthly | Yearly | |
|---|---|---|---|
Gross RentThe total rental income received from tenants before deducting any expenses. Includes base rent, late fees, pet fees, parking fees, and other recurring charges.
Gross rent:
| $2,900 | $34,800 | |
Vacancy LossExpected loss of rent due to vacancies.
Vacancy loss:
(6%)
| 6% | -$174 | -$2,088 |
Operating IncomeGross rental income minus vacancy loss. Calculation:Gross rent - Vacancy loss
Operating income:
| $2,726 | $32,712 |
Operating Expenses
| % Rent | Monthly | Yearly | |
|---|---|---|---|
Property TaxesAnnual taxes levied by local governments on real estate properties. These taxes fund public services like schools, roads, and emergency services. | 13% | -$380 | -$4,564 |
InsuranceThe costs for insurance coverage to protect against financial losses due to risks like fire, natural disasters, theft, liability, or tenant-related damages. Calculation:Assumes 7% of gross rental income, unless insurance rates are specified. | 7% | -$203 | -$2,436 |
Property ManagementThe costs associated with hiring a property manager to handle the day-to-day operations of a rental property. Includes management fees, leasing fes, eviction fees, etc. Calculation:Assumes 8% of gross rental income. | 8% | -$232 | -$2,784 |
Repairs & MaintenanceOngoing costs for routine upkeep and minor fixes needed to keep a property in good working condition. Calculation:Assumes 5% of gross rental income. Varies by property age and condition. | 5% | -$145 | -$1,740 |
Capital ExpensesLarge, infrequent costs for major improvements or replacements, like a new roof, HVAC system, or appliances. Calculation:Assumes 5% of gross rental income. Varies by property age. | 5% | -$145 | -$1,740 |
HOA FeesRegular dues paid to a Homeowners Association for community maintenance, amenities, and management. Similar fees include: Condo Association Fees, Co-op Maintenance Fees, etc. | 0% | -$10 | -$120 |
Operating ExpensesRecurring costs required to maintain and manage a rental property, including property taxes, insurance, maintenance, repairs, utilities (if paid by the owner), property management fees, and other day-to-day expenses. Calculation:Insurance + Property Taxes + Property Management + Repairs & Maintenance + Capital Expenditures + HOA Fees | 38% | -$1,115 | -$13,384 |
Cash Flow
| Monthly | Yearly | |
|---|---|---|
Net Operating Income (NOI)The income generated from a property after deducting all operating expenses but before deducting mortgage payments, taxes, and capital expenditures. Calculation:Gross Operating Income - Operating Expenses
Net operating income:
| $1,611 | $19,332 |
Mortgage PaymentThe fixed amount a borrower pays each month to repay a loan. It typically includes principal and interest (P&I) and may also cover property taxes, insurance, HOA fees, and PMI if escrowed. | -$3,022 | -$36,264 |
Cash FlowNet Operating Income (NOI) minus mortgage payments. Calculation:NOI - Mortgage Payments | -$1,411 | -$16,932 |