$469,900
Investment Summary
- Monthly Cash Flow
- -$1,613
- Cap Rate
- 2.0%
- Cash-on-Cash Return
- -17.9%
- Debt Coverage Ratio
- 0.33
- Internal Rate of Return (5 years)
- -13.3%
Cash Flow
Net Operating Income (NOI) minus mortgage payments.
Calculation:
NOI - Mortgage Payments
Cap Rate (Market Value)
Capitalization Rate is a rate of return that compares the yearly Net Operating Income (NOI) to the market value.
Calculation:
NOI / Market Value
Cash-on-Cash Return (CoC)
Annual Cash Flow / Cash Invested
Calculation:
Annual cash flow divided by initial cash invested.
Debt Coverage Ratio (DCR)
Net Operating Income (NOI) divided by total debt payments.
Calculation:
NOI / Total Debt Payments
Internal Rate of Return (IRR)
A metric for assessing profitability over time. IRR is the discount rate at which the net present value (NPV) of all future cash flows (positive and negative) from an investment equals zero — including both periodic cash flow (such as rent) and a projected sale at the end of the holding period. It represents the expected annualized return, accounting for income, expenses, and the recovery of capital through a future sale.
Property Description
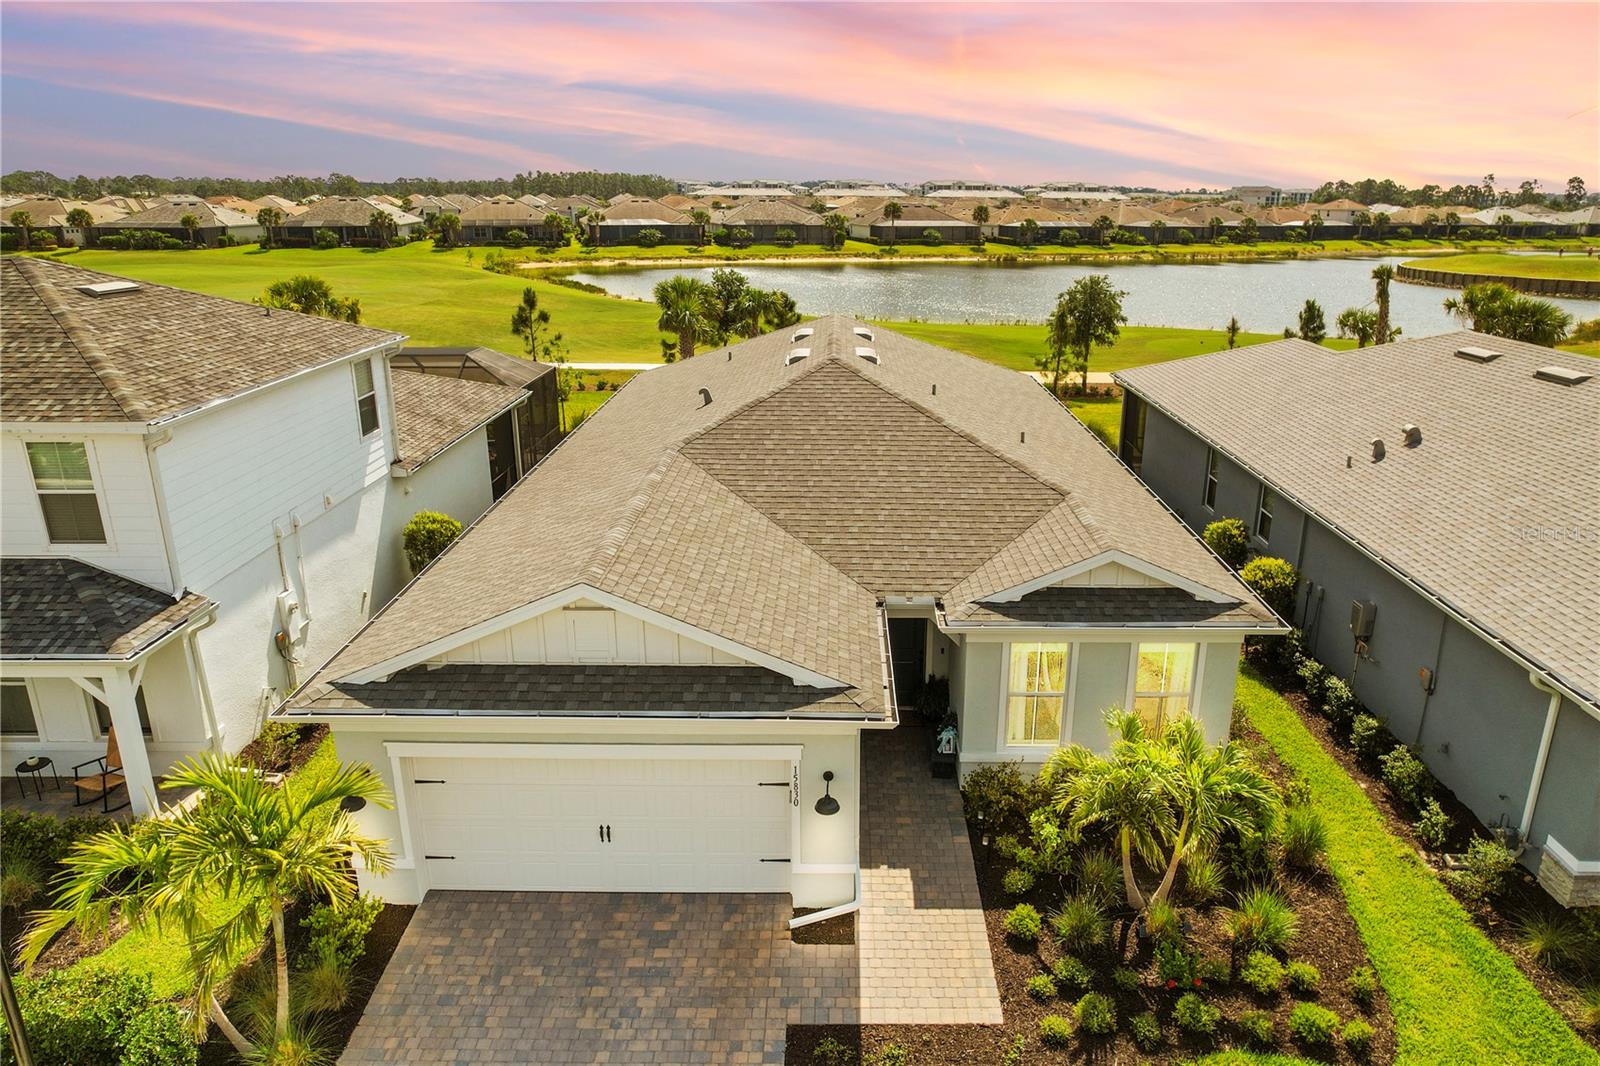
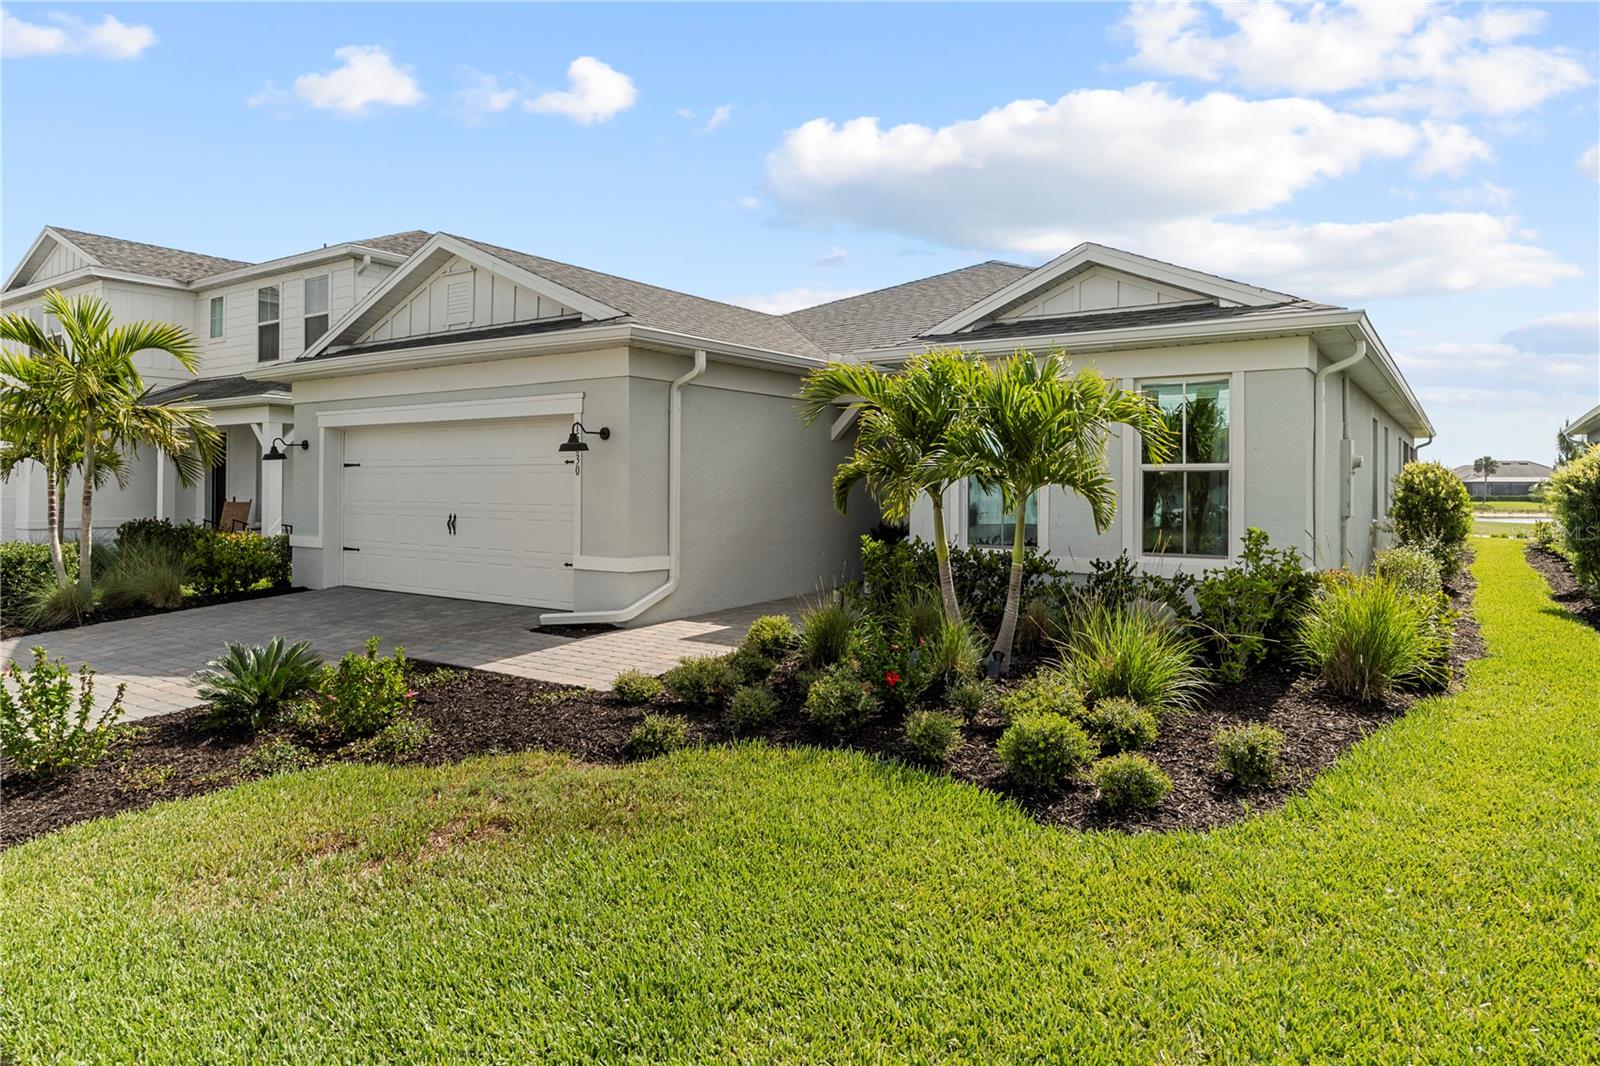
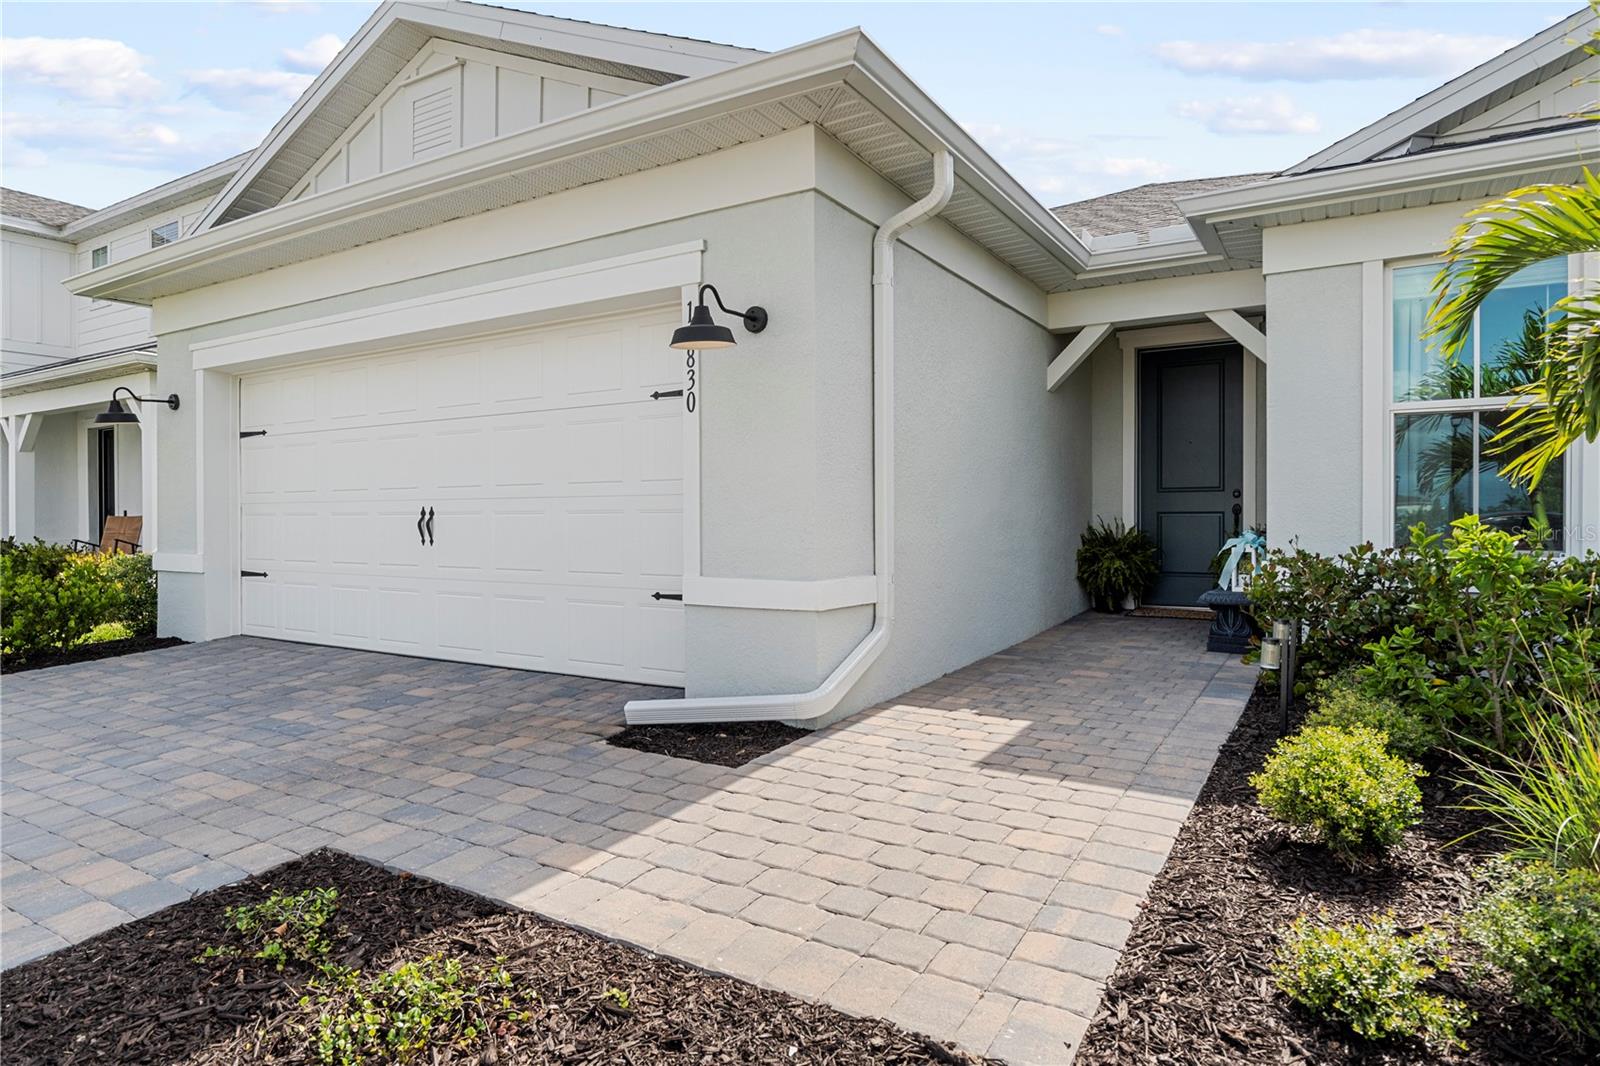
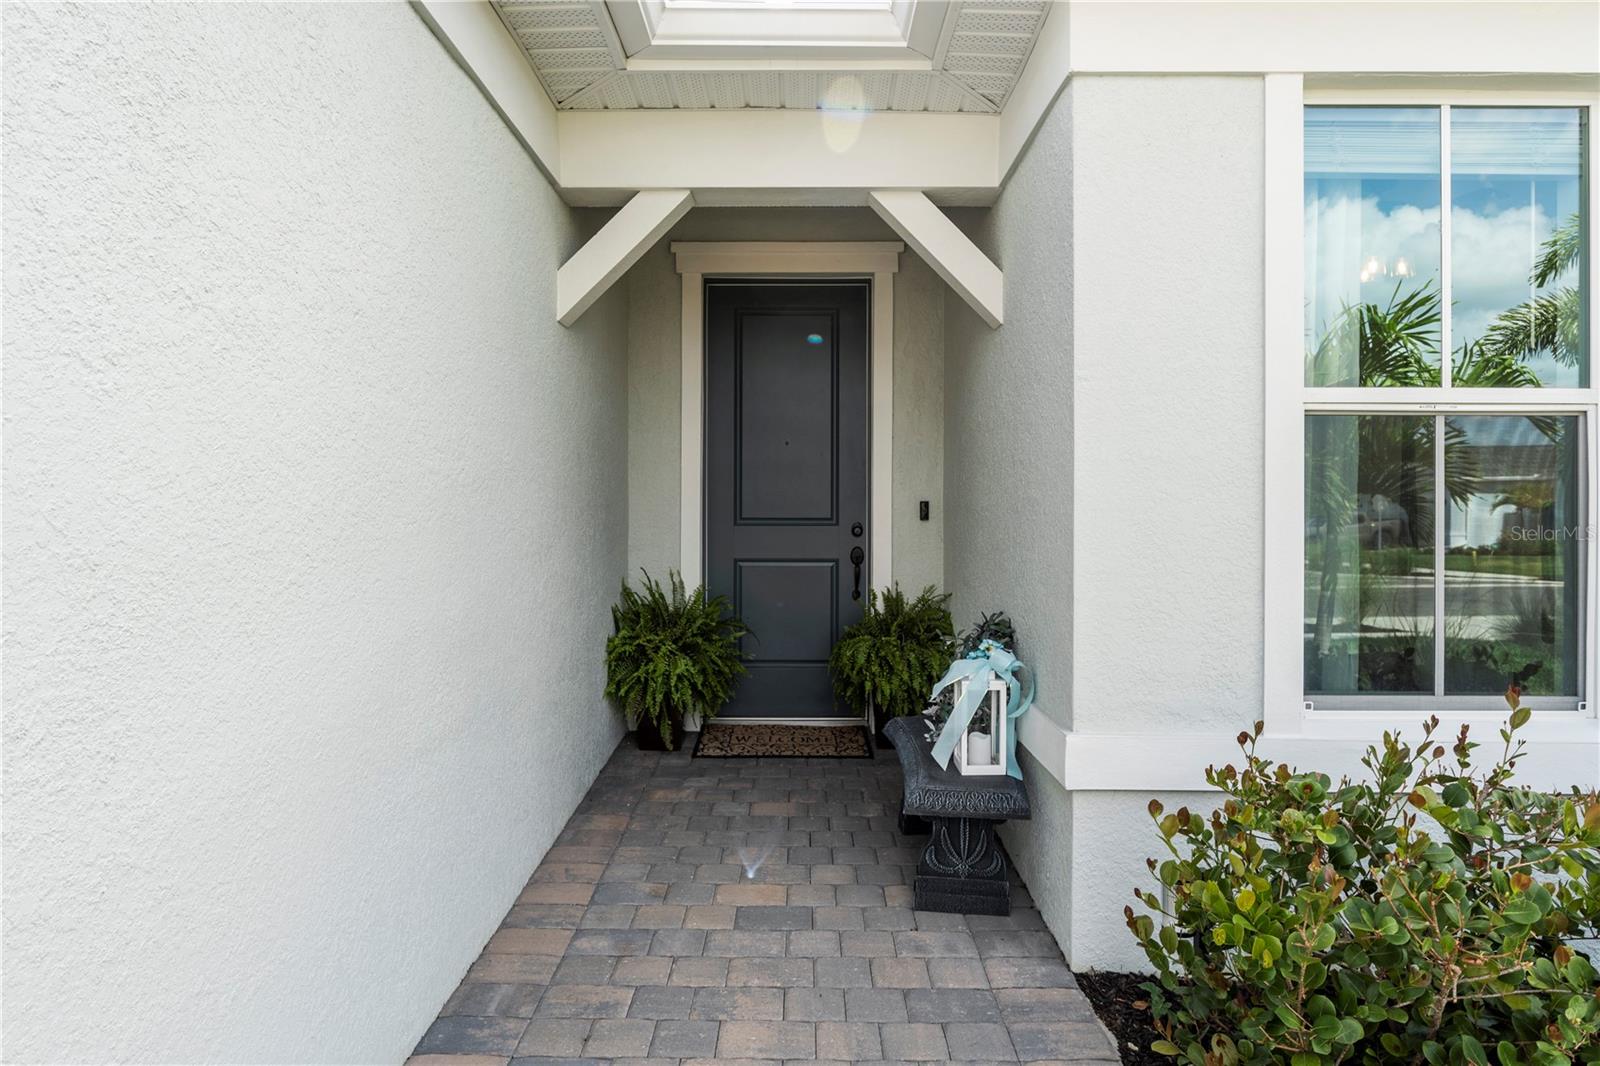
FREE GOLF CART comes with this AMAZING Upgraded Home with Stunning Golf & Lake Views in Northridge! Welcome to this spectacular 3-bedroom plus den home perfectly situated on the 14th hole, offering breathtaking golf course and lake views — WITHOUT high HOA fees! This home is NOT IN BABCOCK NATIONAL but you still get the amazing National VIEW!!! Mystic model built by Pulte Homes, this residence is packed with upgrades and designed for luxurious, low-maintenance living. Inside, you’ll find HURRICANE-IMPACT GLASS throughout, large plank tile flooring, crown molding, tray ceilings and Hunter ceiling fans in every room, and stylish blinds and curtains on every window. The kitchen is a true showstopper with a spacious quartz island, soft-close cabinets and drawers (with convenient pull-outs), a large Blanco basin sink, gas stove, and a custom-built pantry with beautiful shelving. The master suite is a true retreat, featuring tray ceilings with crown molding, an oversized custom walk-in closet, a spa-like bathroom with dual sinks, a soaking tub, and a frameless glass walk-in shower. The den is enhanced with custom built-in shelves, making it perfect for a home office or reading room. Throughout the home, you'll find sleek, upgraded black hardware on doors, faucets, and knobs for a modern, cohesive feel. Even the laundry room is thoughtfully designed with a woodblock folding table, cabinets, a sink, and a hanging bar. The garage is extended by 4 feet and includes epoxy floors, a pull-down attic ladder, and heavy-duty shelving — offering plenty of storage and functionality. Step outside to the extended lanai, complete with a mounted TV — perfect for relaxing while enjoying your peaceful golf and lake views. Additional features: Furniture available is available, Brand new 9K Golf Cart only 1 year old comes with the house as a BONUS!! Don’t miss the opportunity to own this incredible, move-in-ready home full of high-end upgrades in beautiful Northridge!Enjoy living in Babcock Ranch, America's first entirely solar-powered town, with access to multiple community pools, nature trails, with shopping and dining. Come enjoy the convenience of Babcock Ranch living with festivals, farmer's markets, Concerts, Health gym & just a golf cart ride to the grocery store. There is so much to do with hundreds of clubs and activities planned every month. There is a K-12 neighborhood school with a brand new sports complex, including football, soccer and baseball fields. There are many playgrounds and parks, including multiple dog parks and a brand new skate park and six new parks along the nature trails. Babcock Ranch is a top master planned community and was featured on CNN and 60 Min for not losing any power or internet after hurricane Ian made a direct hit and Milton came very close. Beautiful parks and amenities let you experience SW Florida at its finest! Schedule your private tour today and make your dream home a reality! Come live a better life at Babcock Ranch!
Build Your Team
Quickly find investor-friendly professionals who can help you succeed in real estate investing at any stage of the investing journey.


Agents
Match with investor-friendly agents who can help you find, analyze, and close your next deal


Lenders
Get the best funding…find investor-friendly lenders who specialize in your deal strategy


Property Managers
Transition to passive investing. Find a trusted property management partnership that lasts.


Tax Pros & Accountants
Taxes and financial reporting made easy—find experts to create tax savings strategies, file taxes, and more
Location
Property Details
Parking
- Details: Attached
- Garage Spaces: 2
- Spaces Total: 0
Bedroom Information
- # of Bedrooms: 3
Bathroom Information
- # of Baths (Full): 2
- # of Baths (Total): 2.0
Interior Features
- # of Rooms: 6
- # of Stories: 1
Exterior Features
- Exterior Walls Materials: Composition/Composite
- Foundation: Block
- Roof Material: Shingle
HOA
- Has HOA: Yes
- Association: Northridge at Babcock Ranch - Access Management
- HOA Fee: $732/quarterly
- Additional Association: Babcock Ranch Residential Association
- Additional HOA Fee: $423/quarterly
Land Information
- Land Use: Residential
- Land Use Subtype: Single Family Residential
Lot Information
- Parcel ID: 422619302105
- Lot Size: 7307 sqft
Property Information
- Property Type: Single Family Residence
- Style: Florida
- Year Built: 2023
Tax Information
- Annual Tax: $6,548
Utilities
- Water & Sewer: Public
- Heating: Central
- Cooling: Central Air
Location
- County: Charlotte
Listing Details
Investment Summary
- Monthly Cash Flow
- -$1,613
- Cap Rate
- 2.0%
- Cash-on-Cash Return
- -17.9%
- Debt Coverage Ratio
- 0.33
- Internal Rate of Return (5 years)
- -13.3%
Cash Flow
Net Operating Income (NOI) minus mortgage payments.
Calculation:
NOI - Mortgage Payments
Cap Rate (Market Value)
Capitalization Rate is a rate of return that compares the yearly Net Operating Income (NOI) to the market value.
Calculation:
NOI / Market Value
Cash-on-Cash Return (CoC)
Annual Cash Flow / Cash Invested
Calculation:
Annual cash flow divided by initial cash invested.
Debt Coverage Ratio (DCR)
Net Operating Income (NOI) divided by total debt payments.
Calculation:
NOI / Total Debt Payments
Internal Rate of Return (IRR)
A metric for assessing profitability over time. IRR is the discount rate at which the net present value (NPV) of all future cash flows (positive and negative) from an investment equals zero — including both periodic cash flow (such as rent) and a projected sale at the end of the holding period. It represents the expected annualized return, accounting for income, expenses, and the recovery of capital through a future sale.
Purchase Details
Purchase PriceThe price paid for the property. Purchase price:
| $469,900 |
|---|---|
Amount FinancedThe amount of the purchase financed through a loan. Amount financed:
| -$375,920 |
Down paymentThe initial payment made towards the purchase. Down payment:
| $93,980 |
Closing CostsFees and expenses associated with purchasing a property, typically ranging from 2% to 5% of the home’s purchase price, paid at the end of a home purchase to cover services like lending, title transfer, and taxes. Closing costs:
| $14,097 |
Rehab CostsCosts incurred to repair or improve the property, including: roof, flooring, exterior siding, kitchen, exterior paint, bathrooms, etc. Rehab costs:
| $0 |
Initial Cash InvestedThe total initial cash invested in the property. Calculation:Down payment + Buying costs + Rehab costs Initial cash invested:
| $108,077 |
Square Feet (SQFT)The total square footage of the property. Square feet:
| 2,055 |
Cost Per Square FootCost per square foot of the property. Calculation:Purchase Price / Square Feet Cost per square foot:
| $229 |
Monthly Rent Per Square FootMonthly rent divided by the number of square feet. This ratio helps investors compare rental income efficiency across properties, markets, and unit sizes Calculation:Monthly Rent / Square Feet Monthly rent per square foot:
| $1.22 |
Financing Details
Loan AmountThe total sum of money borrowed from a lender to finance a property purchase. Calculation:Purchase Price - Down Payment
Loan amount:
| $375,920 |
|---|---|
Loan to Value Ratio (LTV)Loan amount divided by the market value of the property. Calculation:Loan Amount / Market Value
Loan to value ratio:
| 80.0% |
Loan TypeThe type of loan (e.g., fixed, adjustable).
Loan type:
| Amortizing |
TermThe loan repayment period in years.
Term:
| 30 years |
Interest RateThe percentage a lender charges on the borrowed amount of a loan, determining the cost of borrowing money.
Interest rate:
| 6.625% |
Principal & Interest (PI)The principal is the portion of the loan payment that reduces the loan balance. The interest is the lender's charge for borrowing money. Calculation:(P * r * (1 + r) ** n) / ((1 + r) ** n - 1) Where:
P = Loan amount (principal)
Principal & interest:
| $2,407 |
Property TaxesAnnual taxes levied by local governments on real estate properties. These taxes fund public services like schools, roads, and emergency services.
Property tax:
| $546 |
InsuranceThe costs for insurance coverage to protect against financial losses due to risks like fire, natural disasters, theft, liability, or tenant-related damages. Calculation:Assumes 7% of gross rental income, unless insurance rates are specified.
Insurance:
| $175 |
Private Mortgage Insurance (PMI)A fee that borrowers pay when they take out a conventional loan with a loan-to-value (LTV) ratio above 80%.
Private mortgage insurance (PMI):
| $0 |
Monthly PaymentThe fixed amount a borrower pays each month to repay a loan. It typically includes principal and interest (P&I) and may also cover property taxes, insurance, HOA fees, and PMI if escrowed. Monthly payment:
| $3,128 |
Operating Income
| % Rent | Monthly | Yearly | |
|---|---|---|---|
Gross RentThe total rental income received from tenants before deducting any expenses. Includes base rent, late fees, pet fees, parking fees, and other recurring charges.
Gross rent:
| $2,500 | $30,000 | |
Vacancy LossExpected loss of rent due to vacancies.
Vacancy loss:
(6%)
| 6% | -$150 | -$1,800 |
Operating IncomeGross rental income minus vacancy loss. Calculation:Gross rent - Vacancy loss
Operating income:
| $2,350 | $28,200 |
Operating Expenses
| % Rent | Monthly | Yearly | |
|---|---|---|---|
Property TaxesAnnual taxes levied by local governments on real estate properties. These taxes fund public services like schools, roads, and emergency services. | 22% | -$546 | -$6,548 |
InsuranceThe costs for insurance coverage to protect against financial losses due to risks like fire, natural disasters, theft, liability, or tenant-related damages. Calculation:Assumes 7% of gross rental income, unless insurance rates are specified. | 7% | -$175 | -$2,100 |
Property ManagementThe costs associated with hiring a property manager to handle the day-to-day operations of a rental property. Includes management fees, leasing fes, eviction fees, etc. Calculation:Assumes 8% of gross rental income. | 8% | -$200 | -$2,400 |
Repairs & MaintenanceOngoing costs for routine upkeep and minor fixes needed to keep a property in good working condition. Calculation:Assumes 5% of gross rental income. Varies by property age and condition. | 5% | -$125 | -$1,500 |
Capital ExpensesLarge, infrequent costs for major improvements or replacements, like a new roof, HVAC system, or appliances. Calculation:Assumes 5% of gross rental income. Varies by property age. | 5% | -$125 | -$1,500 |
HOA FeesRegular dues paid to a Homeowners Association for community maintenance, amenities, and management. Similar fees include: Condo Association Fees, Co-op Maintenance Fees, etc. | 15% | -$385 | -$4,620 |
Operating ExpensesRecurring costs required to maintain and manage a rental property, including property taxes, insurance, maintenance, repairs, utilities (if paid by the owner), property management fees, and other day-to-day expenses. Calculation:Insurance + Property Taxes + Property Management + Repairs & Maintenance + Capital Expenditures + HOA Fees | 62% | -$1,556 | -$18,668 |
Cash Flow
| Monthly | Yearly | |
|---|---|---|
Net Operating Income (NOI)The income generated from a property after deducting all operating expenses but before deducting mortgage payments, taxes, and capital expenditures. Calculation:Gross Operating Income - Operating Expenses
Net operating income:
| $794 | $9,528 |
Mortgage PaymentThe fixed amount a borrower pays each month to repay a loan. It typically includes principal and interest (P&I) and may also cover property taxes, insurance, HOA fees, and PMI if escrowed. | -$2,407 | -$28,884 |
Cash FlowNet Operating Income (NOI) minus mortgage payments. Calculation:NOI - Mortgage Payments | $1,613 | $19,356 |