
$650,000
Investment Summary
- Monthly Cash Flow
- -$469
- Cap Rate
- 4.8%
- Cash-on-Cash Return
- -3.8%
- Debt Coverage Ratio
- 0.85
- Internal Rate of Return (5 years)
- 0.3%
Cash Flow
Net Operating Income (NOI) minus mortgage payments.
Calculation:
NOI - Mortgage Payments
Cap Rate (Market Value)
Capitalization Rate is a rate of return that compares the yearly Net Operating Income (NOI) to the market value.
Calculation:
NOI / Market Value
Cash-on-Cash Return (CoC)
Annual Cash Flow / Cash Invested
Calculation:
Annual cash flow divided by initial cash invested.
Debt Coverage Ratio (DCR)
Net Operating Income (NOI) divided by total debt payments.
Calculation:
NOI / Total Debt Payments
Internal Rate of Return (IRR)
A metric for assessing profitability over time. IRR is the discount rate at which the net present value (NPV) of all future cash flows (positive and negative) from an investment equals zero — including both periodic cash flow (such as rent) and a projected sale at the end of the holding period. It represents the expected annualized return, accounting for income, expenses, and the recovery of capital through a future sale.
Property Description
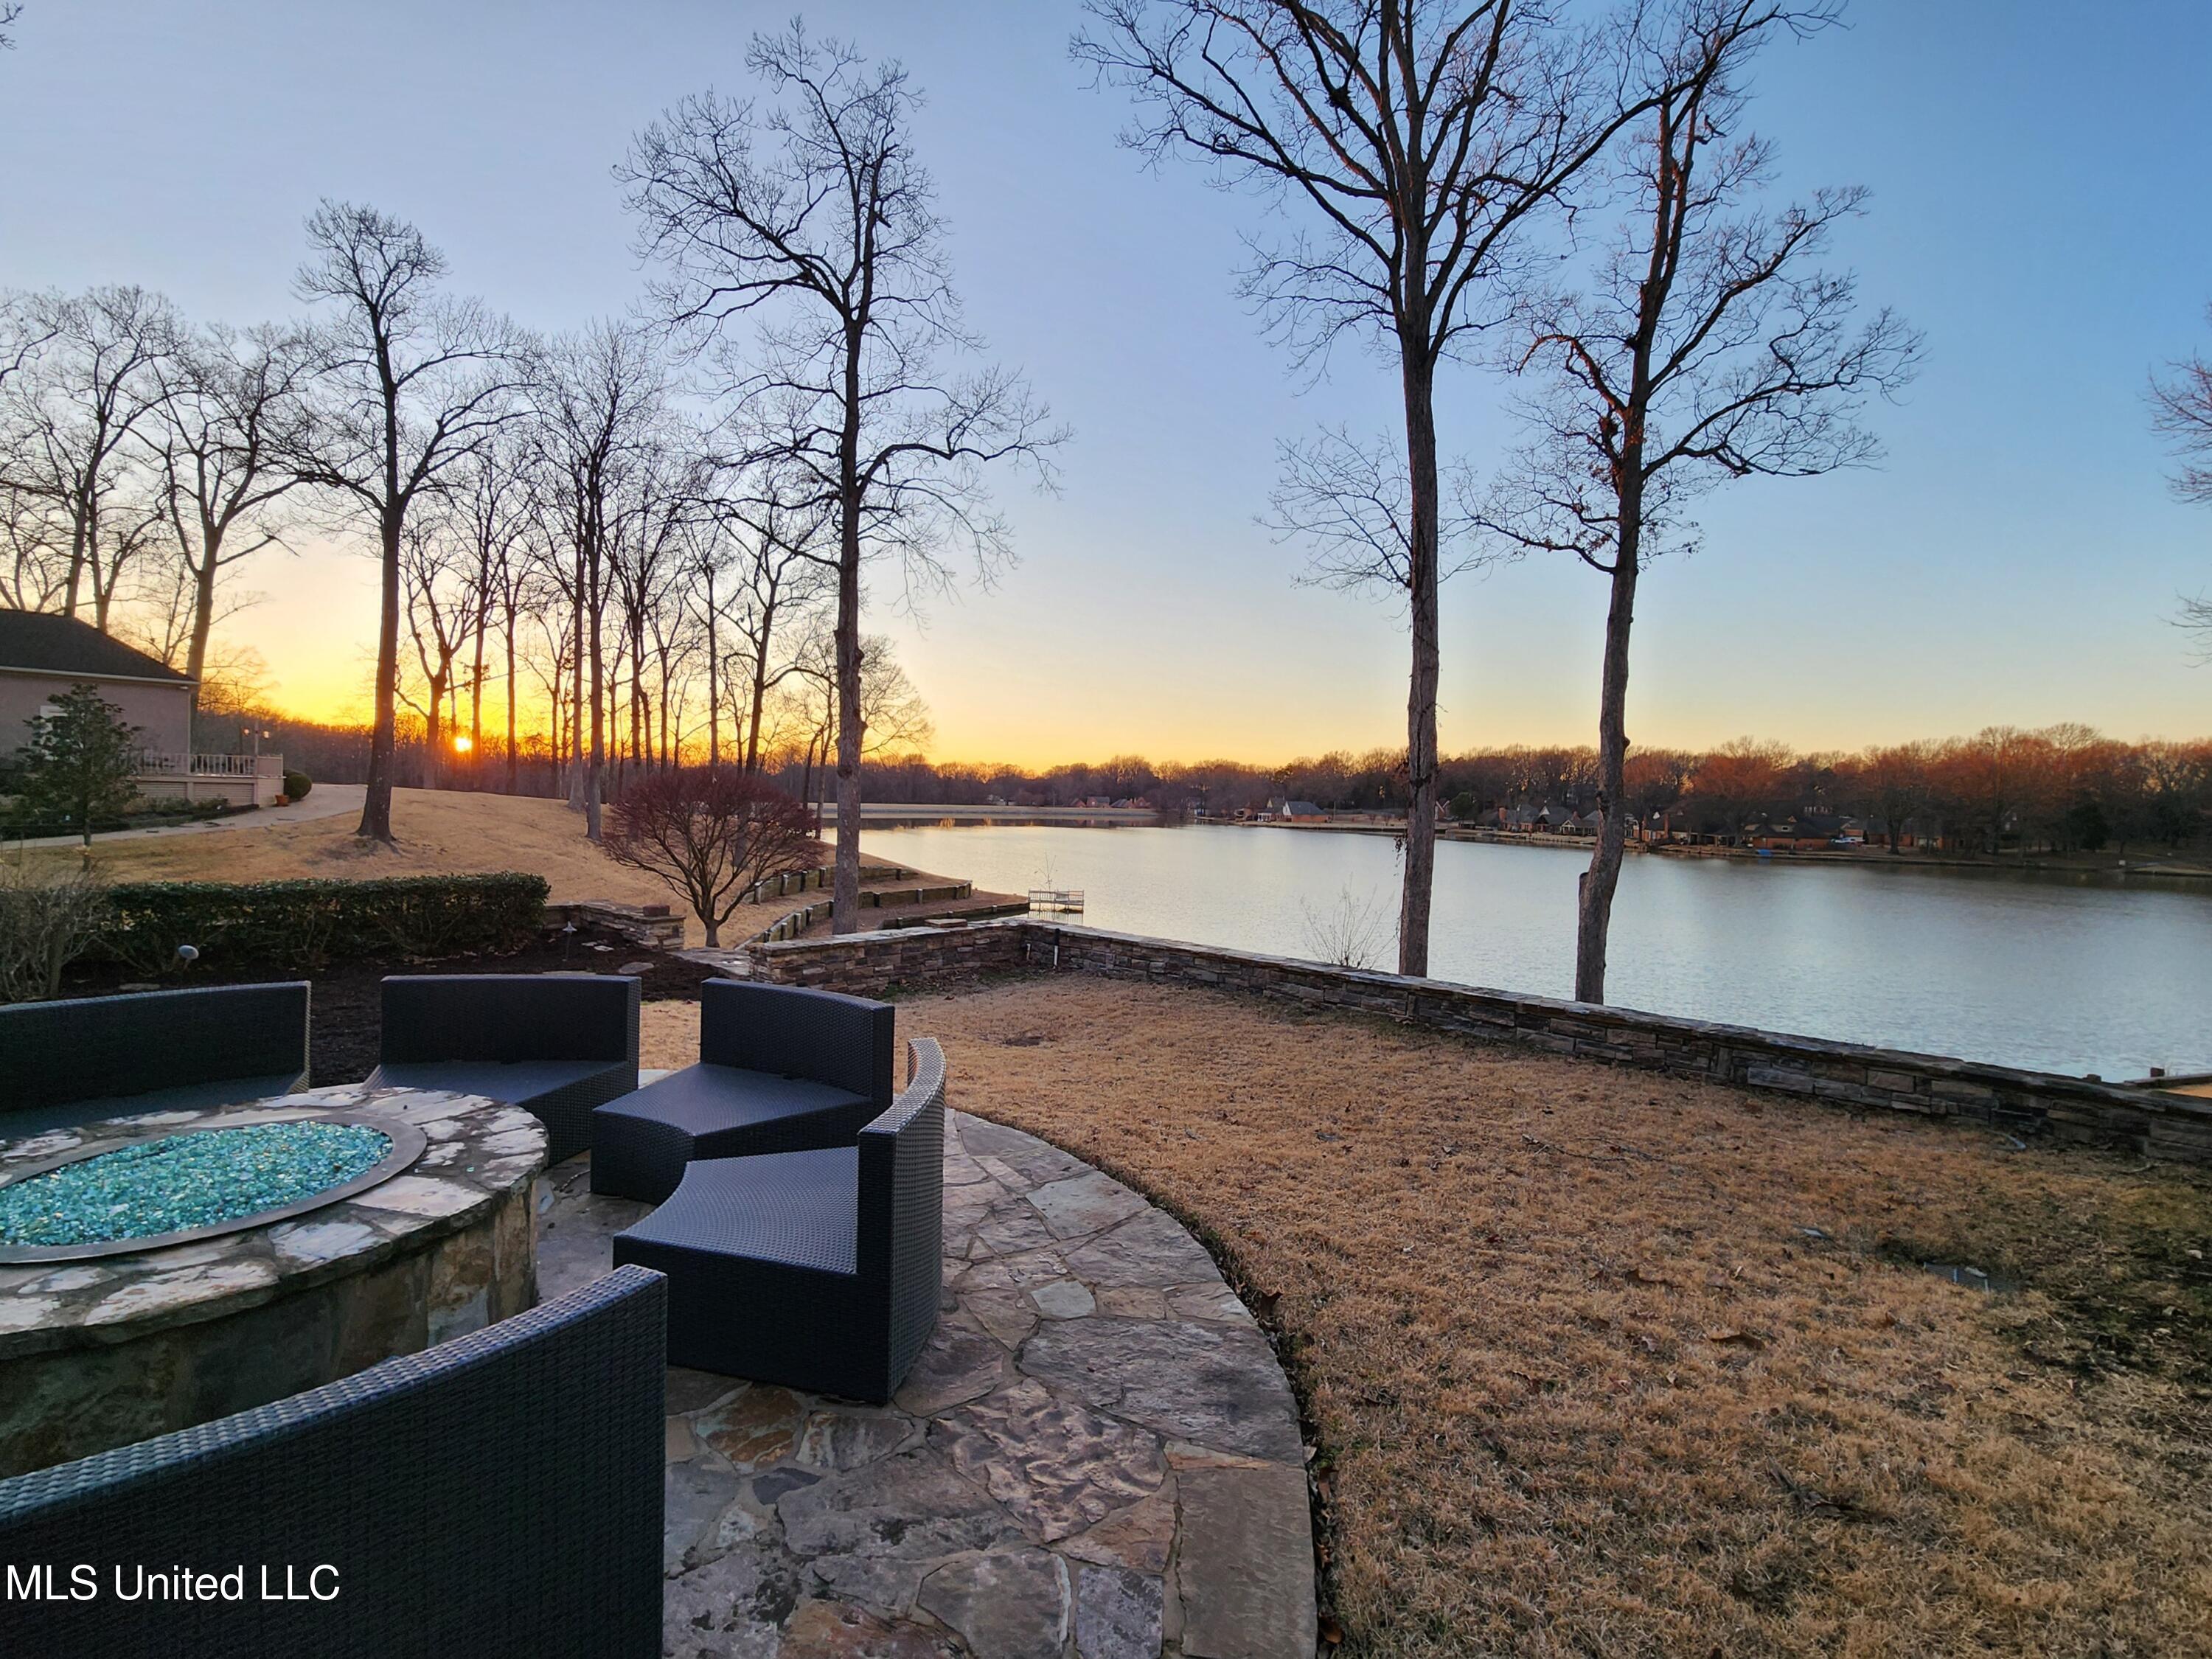
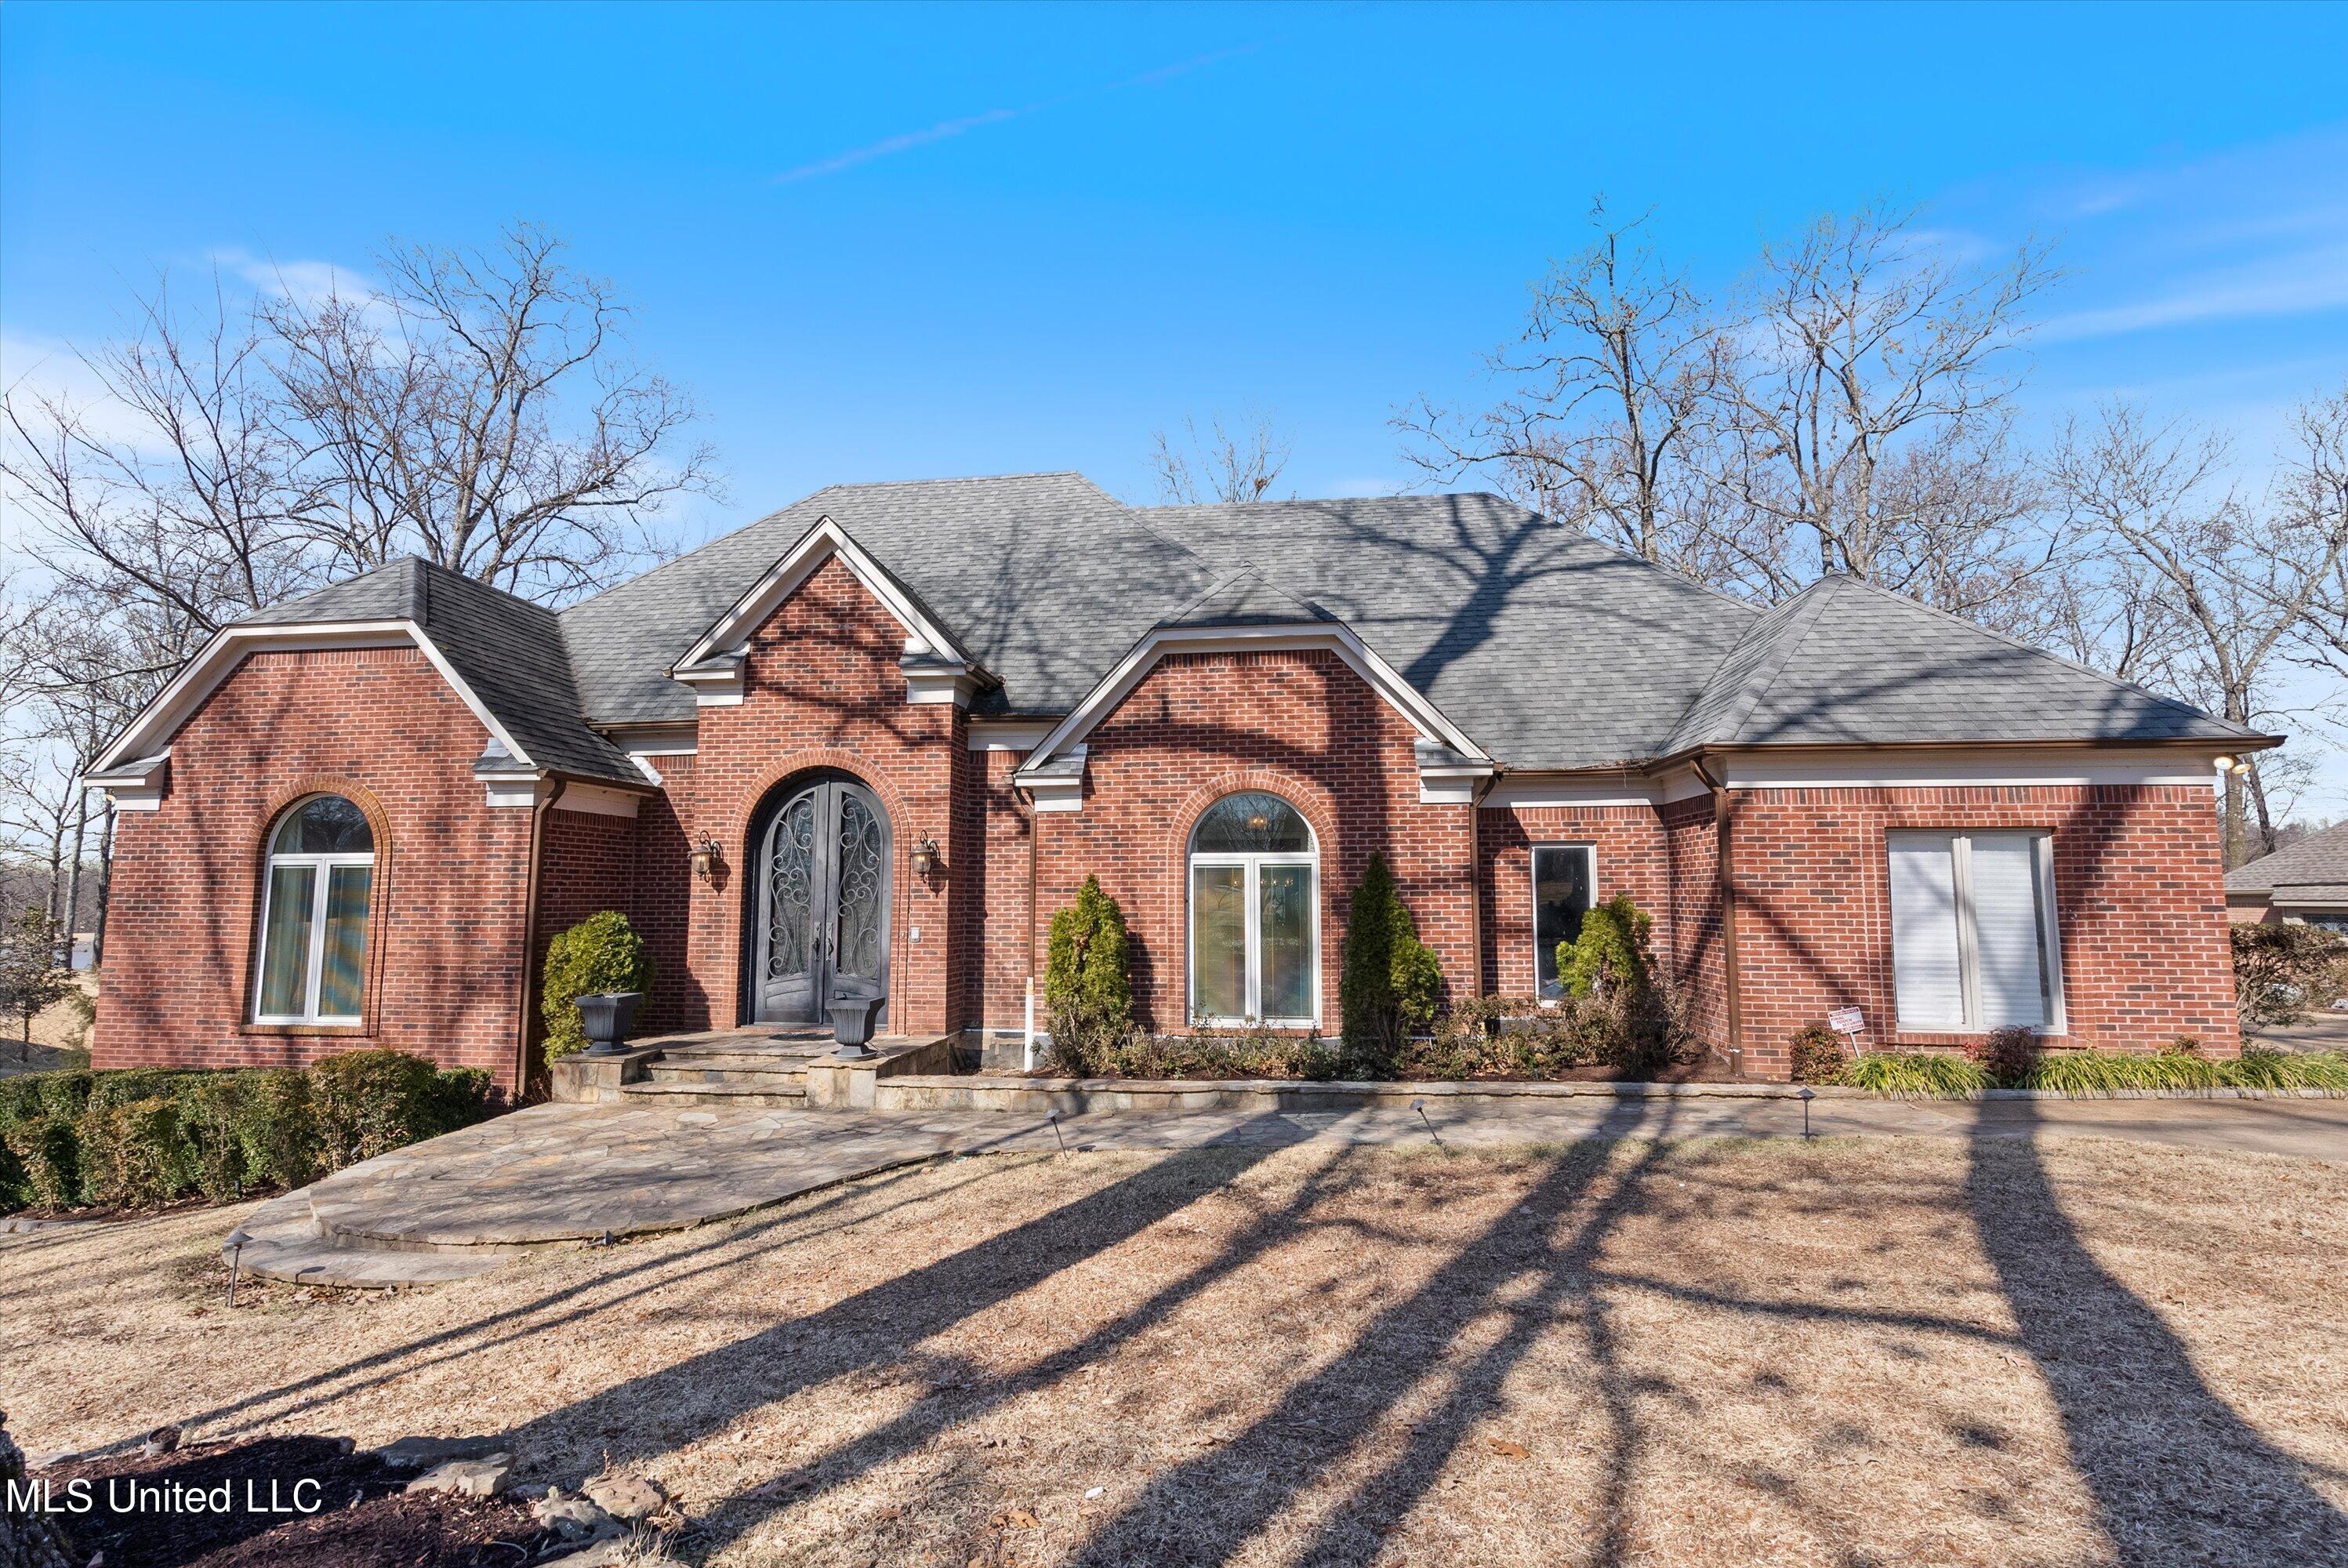
Wake up to the gentle shimmer of sunlight dancing on the water and fall asleep to the soft lullaby of lake breezes — welcome to a home where luxury meets serenity at every turn. Tucked gracefully along a tranquil lake, this enchanting estate invites you to live life beautifully, blending the elegance of fine design with the warmth of a truly livable home. Step into the great room, where rich wood floors meet soaring beamed ceilings and a dramatic modern fireplace sets the mood. Walls of folding glass open wide to a spacious screened porch, letting the outdoors in and turning every sunset into a private show. Whether hosting family gatherings or enjoying quiet mornings with coffee, this home was made for moments that matter. The heart of the home is a chef's dream — an exquisite kitchen wrapped in wall-to-ceiling cabinetry, polished granite, and panoramic lake views. A five-burner gas cooktop anchors the oversized island, while the walk-in pantry ensures that beauty meets function behind every cabinet door. The main level offers two luxurious suites, including a primary retreat that feels like a high-end spa getaway. Wake to peaceful lake views, step across custom cabinetry and a feature wall designed to delight, and rejuvenate in a stunning bath with dual granite vanities, dual walk-in closets, and a breathtaking walk-in shower. A formal dining room and sunlit home office add grace and versatility to this thoughtfully crafted floor plan. Downstairs, the walk-out level invites extended family or cherished guests to relax in comfort, complete with two additional suites, a large living area, and space to add a second kitchen — all just steps from the flagstone patio and lakeside firepit. Upstairs, a spacious suite offers limitless potential as a media room, hobby haven, or private guest quarters. Outside, the backyard is pure magic — where evenings are spent around the firepit, days unfold on the private dock, and laughter echoes across the water from paddleboards and kayaks. With over an acre of professionally landscaped grounds, there's room to roam, dream, and entertain in style. Set among other distinguished homes and just minutes from the charm of Silo Square and Snowden Grove, this one-of-a-kind property offers both peaceful seclusion and city convenience in the highly sought-after Desoto Central school zone. Additional highlights include a deck and patio plumbed for a gas grill, irrigation system, in-law living area, storm/safe room, and generous storage throughout. Every inch of this home has been updated with care and curated with love — all that's missing is you.
Build Your Team
Quickly find investor-friendly professionals who can help you succeed in real estate investing at any stage of the investing journey.


Agents
Match with investor-friendly agents who can help you find, analyze, and close your next deal


Lenders
Get the best funding…find investor-friendly lenders who specialize in your deal strategy


Property Managers
Transition to passive investing. Find a trusted property management partnership that lasts.


Tax Pros & Accountants
Taxes and financial reporting made easy—find experts to create tax savings strategies, file taxes, and more
Location
Property Details
Parking
- Description: Attached, Concrete, Garage Door Opener, Garage Faces Side, Storage, Direct Access
- Details: Attached, Concrete, Garage Door Opener, Garage Faces Side, Storage, Direct Access
- Garage Spaces: 2
- Spaces Total: 2
Bedroom Information
- # of Bedrooms: 5
Bathroom Information
- # of Baths (Full): 5
- # of Baths (Partial): 1
- # of Baths (Total): 6.0
Interior Features
- # of Rooms: 13
- # of Stories: 2
- Basement: Yes
- Basement Description: Daylight, Exterior Entry, Finished, Full, Interior Entry, Storage Space
Exterior Features
- Exterior Walls Materials: Brick Veneer
- Foundation: Other
- Roof Type: Hip
HOA
- Has HOA: Yes
- HOA Fee: $350/annually
Land Information
- Land Use: Residential
- Land Use Subtype: Single Family Residential (Assumed)
Lot Information
- Parcel ID: 1079320400002800
- Lot Size: 52707 sqft
Property Information
- Property Type: Single Family Residence
- Style: Traditional
- Year Built: 1989
Tax Information
- Annual Tax: $4,796
Utilities
- Water & Sewer: Public
- Heating: Central, Fireplace(s), Forced Air, Natural Gas, Zoned
- Cooling: Central Air, Ceiling Fan(s), Gas, Zoned, Multi Units
Location
- County: De Soto
Listing Details
Investment Summary
- Monthly Cash Flow
- -$469
- Cap Rate
- 4.8%
- Cash-on-Cash Return
- -3.8%
- Debt Coverage Ratio
- 0.85
- Internal Rate of Return (5 years)
- 0.3%
Cash Flow
Net Operating Income (NOI) minus mortgage payments.
Calculation:
NOI - Mortgage Payments
Cap Rate (Market Value)
Capitalization Rate is a rate of return that compares the yearly Net Operating Income (NOI) to the market value.
Calculation:
NOI / Market Value
Cash-on-Cash Return (CoC)
Annual Cash Flow / Cash Invested
Calculation:
Annual cash flow divided by initial cash invested.
Debt Coverage Ratio (DCR)
Net Operating Income (NOI) divided by total debt payments.
Calculation:
NOI / Total Debt Payments
Internal Rate of Return (IRR)
A metric for assessing profitability over time. IRR is the discount rate at which the net present value (NPV) of all future cash flows (positive and negative) from an investment equals zero — including both periodic cash flow (such as rent) and a projected sale at the end of the holding period. It represents the expected annualized return, accounting for income, expenses, and the recovery of capital through a future sale.
Purchase Details
Purchase PriceThe price paid for the property. Purchase price:
| $650,000 |
|---|---|
Amount FinancedThe amount of the purchase financed through a loan. Amount financed:
| -$520,000 |
Down paymentThe initial payment made towards the purchase. Down payment:
| $130,000 |
Closing CostsFees and expenses associated with purchasing a property, typically ranging from 2% to 5% of the home’s purchase price, paid at the end of a home purchase to cover services like lending, title transfer, and taxes. Closing costs:
| $19,500 |
Rehab CostsCosts incurred to repair or improve the property, including: roof, flooring, exterior siding, kitchen, exterior paint, bathrooms, etc. Rehab costs:
| $0 |
Initial Cash InvestedThe total initial cash invested in the property. Calculation:Down payment + Buying costs + Rehab costs Initial cash invested:
| $149,500 |
Square Feet (SQFT)The total square footage of the property. Square feet:
| 0 |
Cost Per Square FootCost per square foot of the property. Calculation:Purchase Price / Square Feet Cost per square foot:
| n/a |
Monthly Rent Per Square FootMonthly rent divided by the number of square feet. This ratio helps investors compare rental income efficiency across properties, markets, and unit sizes Calculation:Monthly Rent / Square Feet Monthly rent per square foot:
| n/a |
Financing Details
Loan AmountThe total sum of money borrowed from a lender to finance a property purchase. Calculation:Purchase Price - Down Payment
Loan amount:
| $520,000 |
|---|---|
Loan to Value Ratio (LTV)Loan amount divided by the market value of the property. Calculation:Loan Amount / Market Value
Loan to value ratio:
| 80.0% |
Loan TypeThe type of loan (e.g., fixed, adjustable).
Loan type:
| Amortizing |
TermThe loan repayment period in years.
Term:
| 30 years |
Interest RateThe percentage a lender charges on the borrowed amount of a loan, determining the cost of borrowing money.
Interest rate:
| 5.875% |
Principal & Interest (PI)The principal is the portion of the loan payment that reduces the loan balance. The interest is the lender's charge for borrowing money. Calculation:(P * r * (1 + r) ** n) / ((1 + r) ** n - 1) Where:
P = Loan amount (principal)
Principal & interest:
| $3,076 |
Property TaxesAnnual taxes levied by local governments on real estate properties. These taxes fund public services like schools, roads, and emergency services.
Property tax:
| $400 |
InsuranceThe costs for insurance coverage to protect against financial losses due to risks like fire, natural disasters, theft, liability, or tenant-related damages. Calculation:Assumes 7% of gross rental income, unless insurance rates are specified.
Insurance:
| $308 |
Private Mortgage Insurance (PMI)A fee that borrowers pay when they take out a conventional loan with a loan-to-value (LTV) ratio above 80%.
Private mortgage insurance (PMI):
| $0 |
Monthly PaymentThe fixed amount a borrower pays each month to repay a loan. It typically includes principal and interest (P&I) and may also cover property taxes, insurance, HOA fees, and PMI if escrowed. Monthly payment:
| $3,784 |
Operating Income
| % Rent | Monthly | Yearly | |
|---|---|---|---|
Gross RentThe total rental income received from tenants before deducting any expenses. Includes base rent, late fees, pet fees, parking fees, and other recurring charges.
Gross rent:
| $4,400 | $52,800 | |
Vacancy LossExpected loss of rent due to vacancies.
Vacancy loss:
(6%)
| 6% | -$264 | -$3,168 |
Operating IncomeGross rental income minus vacancy loss. Calculation:Gross rent - Vacancy loss
Operating income:
| $4,136 | $49,632 |
Operating Expenses
| % Rent | Monthly | Yearly | |
|---|---|---|---|
Property TaxesAnnual taxes levied by local governments on real estate properties. These taxes fund public services like schools, roads, and emergency services. | 9% | -$400 | -$4,796 |
InsuranceThe costs for insurance coverage to protect against financial losses due to risks like fire, natural disasters, theft, liability, or tenant-related damages. Calculation:Assumes 7% of gross rental income, unless insurance rates are specified. | 7% | -$308 | -$3,696 |
Property ManagementThe costs associated with hiring a property manager to handle the day-to-day operations of a rental property. Includes management fees, leasing fes, eviction fees, etc. Calculation:Assumes 8% of gross rental income. | 8% | -$352 | -$4,224 |
Repairs & MaintenanceOngoing costs for routine upkeep and minor fixes needed to keep a property in good working condition. Calculation:Assumes 5% of gross rental income. Varies by property age and condition. | 5% | -$220 | -$2,640 |
Capital ExpensesLarge, infrequent costs for major improvements or replacements, like a new roof, HVAC system, or appliances. Calculation:Assumes 5% of gross rental income. Varies by property age. | 5% | -$220 | -$2,640 |
HOA FeesRegular dues paid to a Homeowners Association for community maintenance, amenities, and management. Similar fees include: Condo Association Fees, Co-op Maintenance Fees, etc. | 1% | -$29 | -$348 |
Operating ExpensesRecurring costs required to maintain and manage a rental property, including property taxes, insurance, maintenance, repairs, utilities (if paid by the owner), property management fees, and other day-to-day expenses. Calculation:Insurance + Property Taxes + Property Management + Repairs & Maintenance + Capital Expenditures + HOA Fees | 35% | -$1,529 | -$18,344 |
Cash Flow
| Monthly | Yearly | |
|---|---|---|
Net Operating Income (NOI)The income generated from a property after deducting all operating expenses but before deducting mortgage payments, taxes, and capital expenditures. Calculation:Gross Operating Income - Operating Expenses
Net operating income:
| $2,607 | $31,284 |
Mortgage PaymentThe fixed amount a borrower pays each month to repay a loan. It typically includes principal and interest (P&I) and may also cover property taxes, insurance, HOA fees, and PMI if escrowed. | -$3,076 | -$36,912 |
Cash FlowNet Operating Income (NOI) minus mortgage payments. Calculation:NOI - Mortgage Payments | $469 | $5,628 |