$479,000
Investment Summary
- Monthly Cash Flow
- -$903
- Cap Rate
- 3.4%
- Cash-on-Cash Return
- -9.8%
- Debt Coverage Ratio
- 0.60
- Internal Rate of Return (5 years)
- -5.5%
Cash Flow
Net Operating Income (NOI) minus mortgage payments.
Calculation:
NOI - Mortgage Payments
Cap Rate (Market Value)
Capitalization Rate is a rate of return that compares the yearly Net Operating Income (NOI) to the market value.
Calculation:
NOI / Market Value
Cash-on-Cash Return (CoC)
Annual Cash Flow / Cash Invested
Calculation:
Annual cash flow divided by initial cash invested.
Debt Coverage Ratio (DCR)
Net Operating Income (NOI) divided by total debt payments.
Calculation:
NOI / Total Debt Payments
Internal Rate of Return (IRR)
A metric for assessing profitability over time. IRR is the discount rate at which the net present value (NPV) of all future cash flows (positive and negative) from an investment equals zero — including both periodic cash flow (such as rent) and a projected sale at the end of the holding period. It represents the expected annualized return, accounting for income, expenses, and the recovery of capital through a future sale.
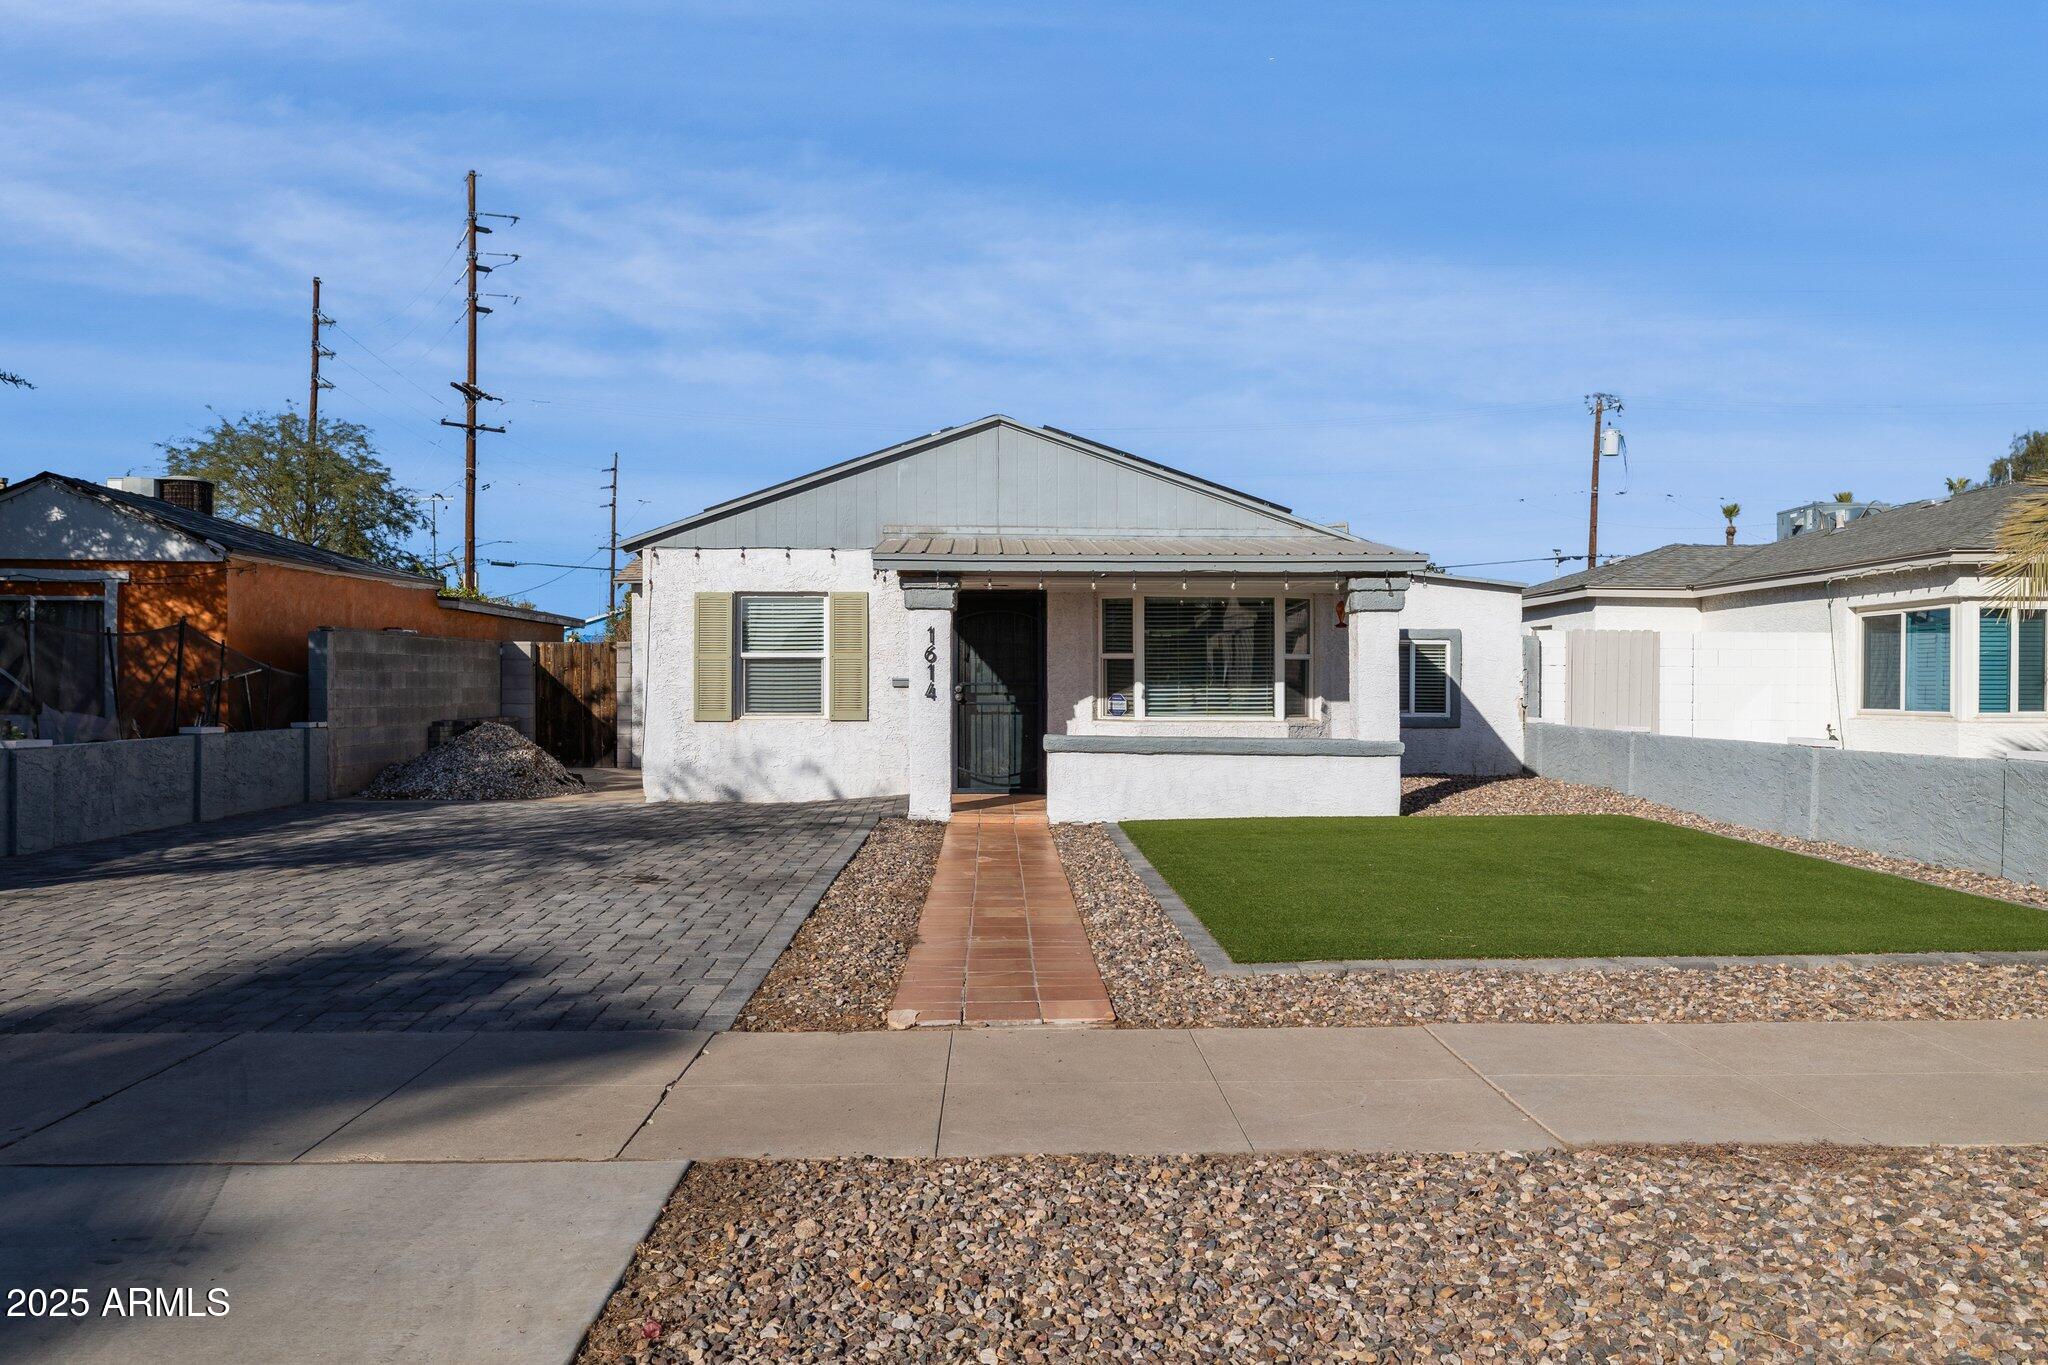
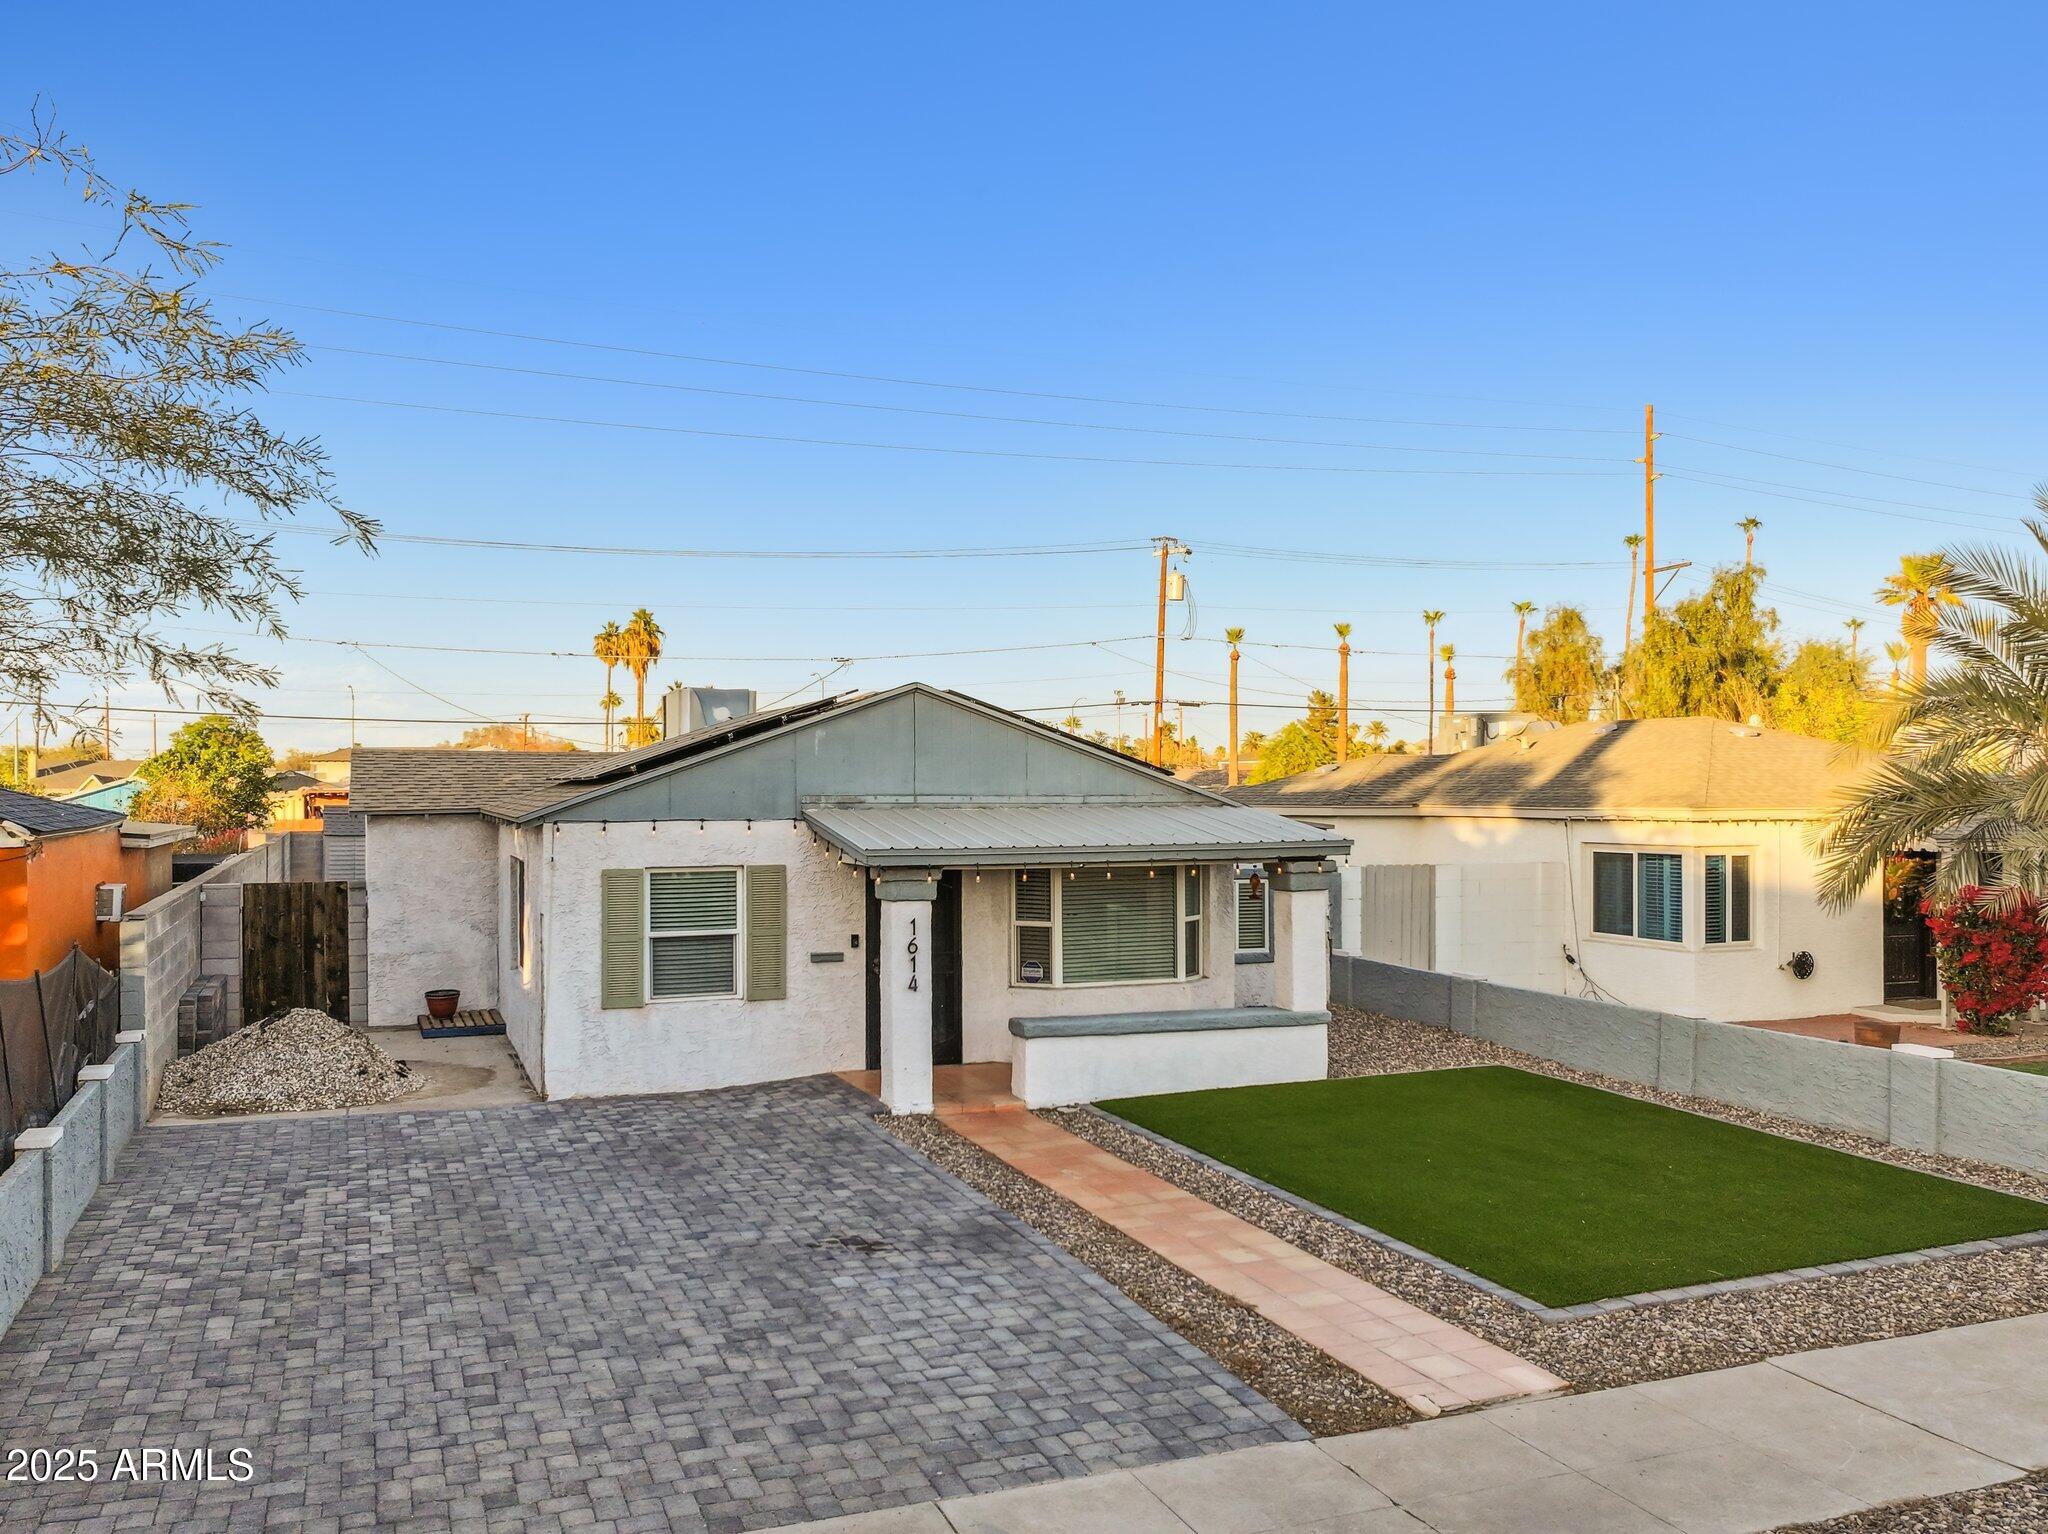
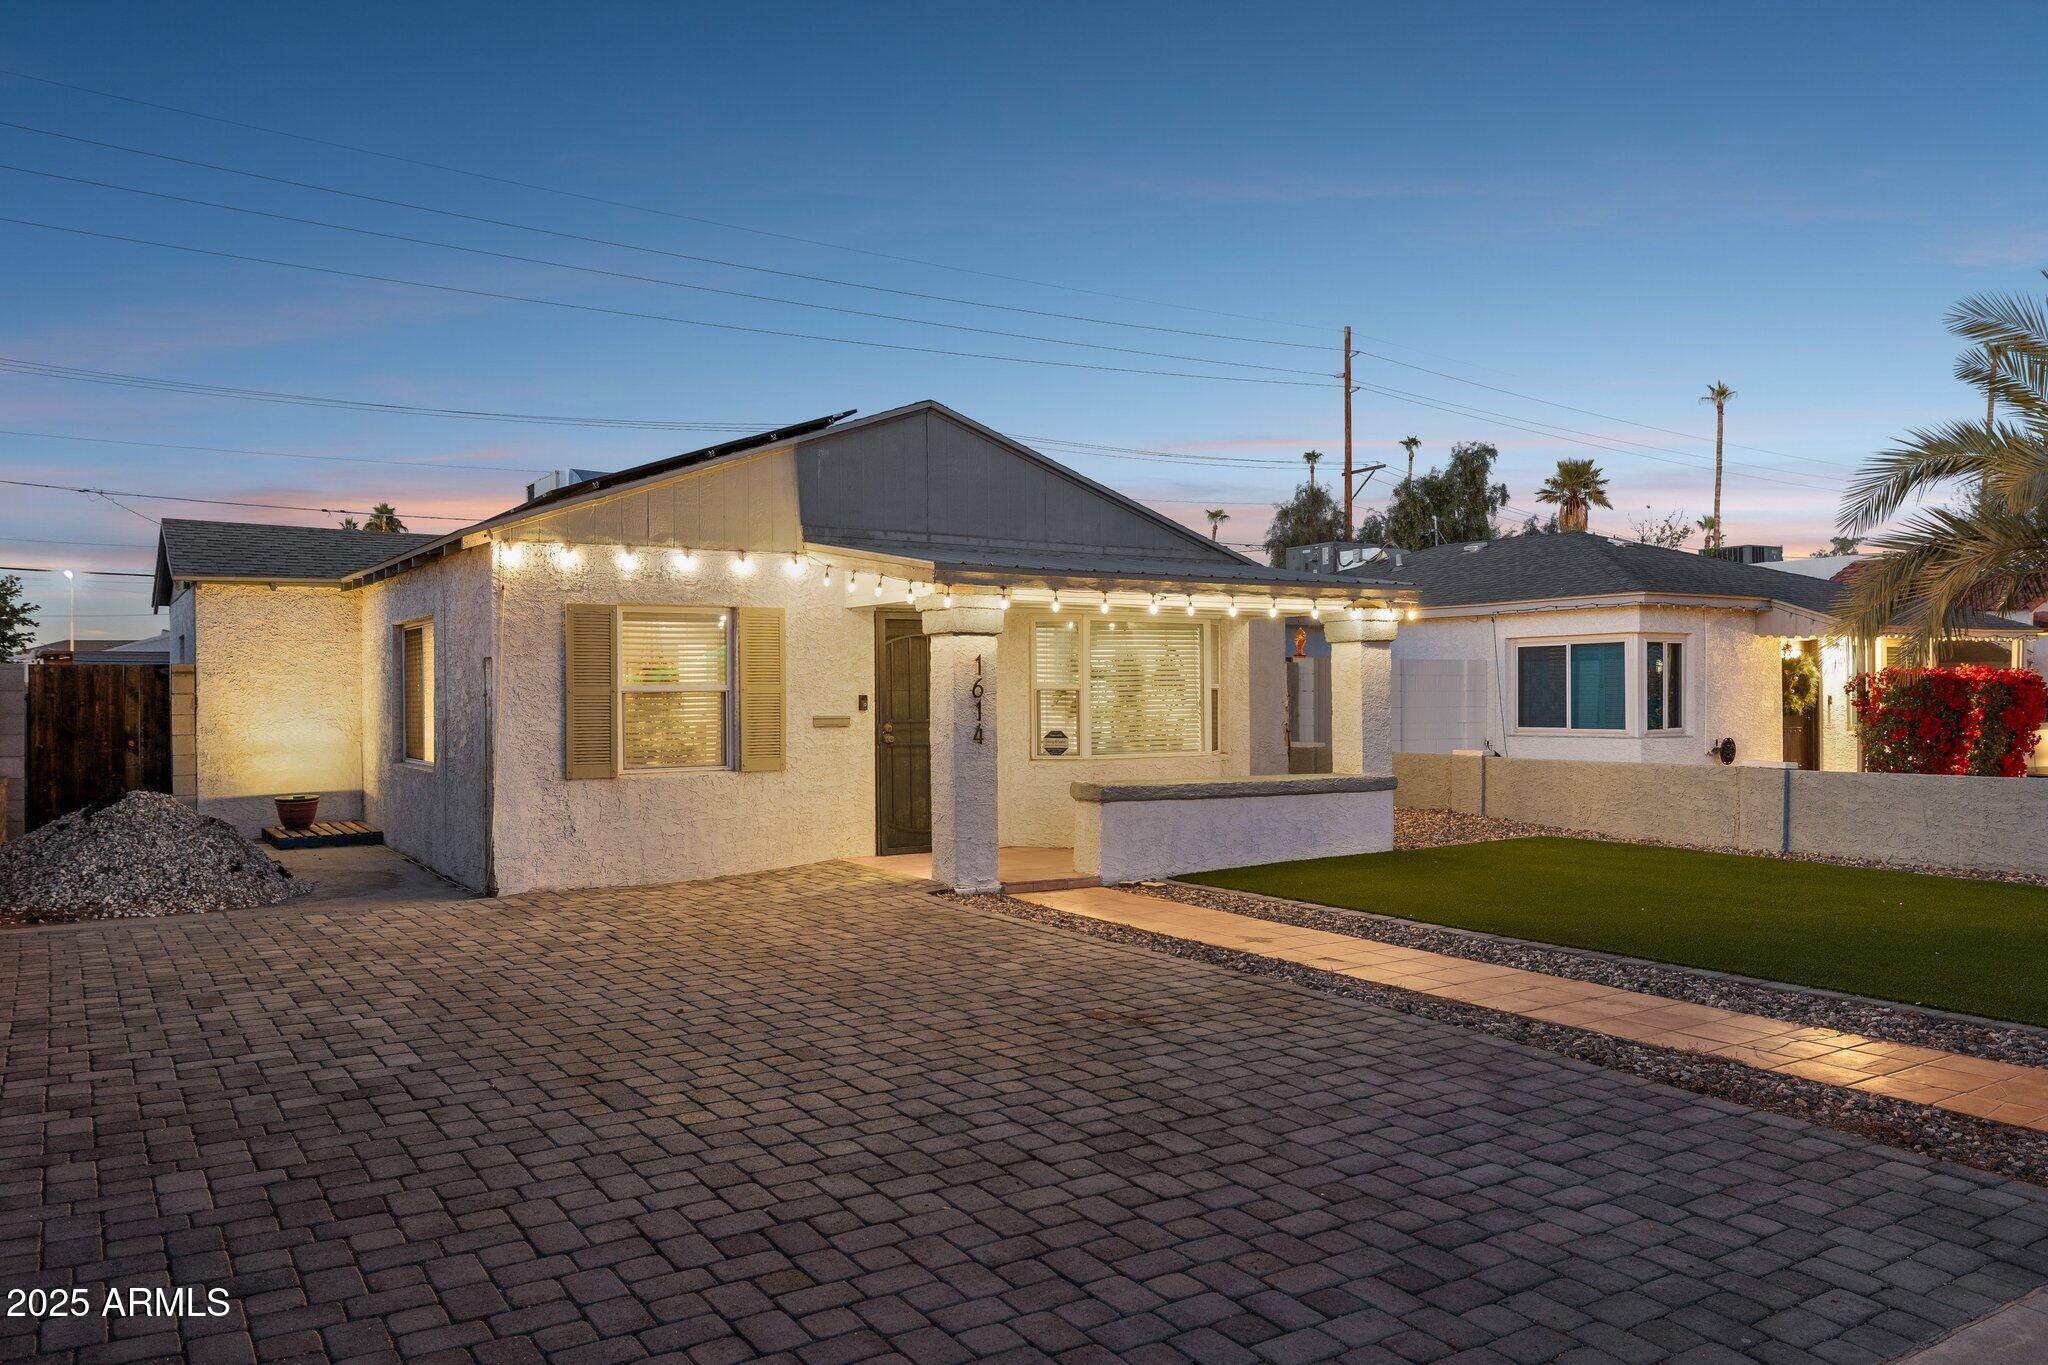
Property Description
Welcome to this c. 1937 jewel box built by Cowley, Higgins & Delph in the idyllic FQ Story historic district. Lynwood St. is dotted with mature palm trees and is home to many spectacularly renovated historic homes. As you approach this home, it becomes apparent that the residents in this coveted neighborhood have true pride of ownership. Looking for a 1930s ranch home that has vintage character blended with a modern aesthetic?! Look no further! With updated interiors and many upgrades, this home is an exceptional value. Major systems have been recently overhauled including: new water heater '22, new sewer line '22, new roof '19 and new 200 amp electrical panel in '16. The home's distinctive modern aesthetic is matched with high-level eco-efficiencies including an OWNED 5.04kw solar installed in '20 (valued over $15,000 & owned free and clear) and dual pane windows throughout the home. The dialed-in curb appeal is perfectly at home in the neighborhood with an expanded, paver-lined driveway (fits up to 4 cars), synthetic lawn with paver edging, neutral exterior paint with decorative window shutters, Saltillo-tiled walkway and a cozy front porch with a metal roof. The cozy living room has rich wood laminate flooring and 2 dual pane windows that allow for gorgeous natural light to filter in. The efficient kitchen is fully revitalized with sage green cabinetry paired with slab granite counters, deep emerald subway tile backsplash, rustic wood upper shelving and stainless steel appliances (gas range/oven, dishwasher + French door refrigerator convey). The dining space opens to the living room and kitchen, while overlooking the front yard through dual pane bay windows. There are 3 bedrooms, with the 2nd and 3rd bedrooms connecting, which offers flexibility to choose which room suits your needs as your primary bedroom. The connecting bedroom can function as a separate bedroom, office, studio, nursery, home gym, etc. The bathroom is completely updated with subway tiled tub/shower surround + walls, classic white vanity and mosaic tile floors. A large laundry room offers wall shelving (perfect for pantry/food storage) and includes newer washer and dryer. The rear yard offers a shaded pergola which provides an outdoor destination for entertaining. A detached 1 car garage/ancillary structure was constructed in 2020 and offers ample room for parking/storage, with new slab and rolling steel/wood RV gate with alley access. Future possibilities of the garage space are endless. Whether you need a home office, gym or a guest house, the garage could re-designed to serve multiple purposes. The rear yard is surrounded by block fencing, has a separate storage shed and also offers room for expansion and/or a pool; unlimited possibilities! The FQ Story historic district is a vibrant neighborhood with incredible walkability to amazing downtown Phx eateries/bars, entertainment, sports arenas, galleries and area hotspots. Easily walk/bike/jump on the light rail to nearby Genuwine, Walter Studios, Savage Phx, Lola Coffee, Japanese Friendship Garden, The Vig, Pomo, Press Coffee, Vovomeena, Grand Ave, First Fridays, Phoenix Art Museum, Margaret T. Hance Park and Encanto park. Sports lovers will love the proximity to Footprint Center to catch a Suns game and Chase field to catch a Diamondbacks game. Easy access to Phx Sky Harbor, ASU downtown, I-10, 51 and more!
Build Your Team
Quickly find investor-friendly professionals who can help you succeed in real estate investing at any stage of the investing journey.


Agents
Match with investor-friendly agents who can help you find, analyze, and close your next deal


Lenders
Get the best funding…find investor-friendly lenders who specialize in your deal strategy


Property Managers
Transition to passive investing. Find a trusted property management partnership that lasts.


Tax Pros & Accountants
Taxes and financial reporting made easy—find experts to create tax savings strategies, file taxes, and more
Location
Property Details
Parking
- Description: Rear Vehicle Entry, Detached
- Details: Detached
- Garage Spaces: 1
- Spaces Total: 3
Bedroom Information
- # of Bedrooms: 3
Bathroom Information
- # of Baths (Total): 1.0
Interior Features
- # of Rooms: 6
- # of Stories: 1
Exterior Features
- Exterior Walls Materials: Brick
- Roof Material: Composition, Metal
- Solar Panels: Yes
Land Information
- Land Use: Residential
- Land Use Subtype: Single Family Residential
Lot Information
- Parcel ID: 11118140
- Lot Size: 6273 sqft
Property Information
- Property Type: Single Family Residence
- Style: Other
- Year Built: 1916
Tax Information
- Annual Tax: $1,845
Utilities
- Water & Sewer: Public
- Heating: Natural Gas
- Cooling: Central Air, Ceiling Fan(s)
Location
- County: Maricopa
Listing Details
Investment Summary
- Monthly Cash Flow
- -$903
- Cap Rate
- 3.4%
- Cash-on-Cash Return
- -9.8%
- Debt Coverage Ratio
- 0.60
- Internal Rate of Return (5 years)
- -5.5%
Cash Flow
Net Operating Income (NOI) minus mortgage payments.
Calculation:
NOI - Mortgage Payments
Cap Rate (Market Value)
Capitalization Rate is a rate of return that compares the yearly Net Operating Income (NOI) to the market value.
Calculation:
NOI / Market Value
Cash-on-Cash Return (CoC)
Annual Cash Flow / Cash Invested
Calculation:
Annual cash flow divided by initial cash invested.
Debt Coverage Ratio (DCR)
Net Operating Income (NOI) divided by total debt payments.
Calculation:
NOI / Total Debt Payments
Internal Rate of Return (IRR)
A metric for assessing profitability over time. IRR is the discount rate at which the net present value (NPV) of all future cash flows (positive and negative) from an investment equals zero — including both periodic cash flow (such as rent) and a projected sale at the end of the holding period. It represents the expected annualized return, accounting for income, expenses, and the recovery of capital through a future sale.
Purchase Details
Purchase PriceThe price paid for the property. Purchase price:
| $479,000 |
|---|---|
Amount FinancedThe amount of the purchase financed through a loan. Amount financed:
| -$383,200 |
Down paymentThe initial payment made towards the purchase. Down payment:
| $95,800 |
Closing CostsFees and expenses associated with purchasing a property, typically ranging from 2% to 5% of the home’s purchase price, paid at the end of a home purchase to cover services like lending, title transfer, and taxes. Closing costs:
| $14,370 |
Rehab CostsCosts incurred to repair or improve the property, including: roof, flooring, exterior siding, kitchen, exterior paint, bathrooms, etc. Rehab costs:
| $0 |
Initial Cash InvestedThe total initial cash invested in the property. Calculation:Down payment + Buying costs + Rehab costs Initial cash invested:
| $110,170 |
Square Feet (SQFT)The total square footage of the property. Square feet:
| 1,155 |
Cost Per Square FootCost per square foot of the property. Calculation:Purchase Price / Square Feet Cost per square foot:
| $415 |
Monthly Rent Per Square FootMonthly rent divided by the number of square feet. This ratio helps investors compare rental income efficiency across properties, markets, and unit sizes Calculation:Monthly Rent / Square Feet Monthly rent per square foot:
| $1.90 |
Financing Details
Loan AmountThe total sum of money borrowed from a lender to finance a property purchase. Calculation:Purchase Price - Down Payment
Loan amount:
| $383,200 |
|---|---|
Loan to Value Ratio (LTV)Loan amount divided by the market value of the property. Calculation:Loan Amount / Market Value
Loan to value ratio:
| 80.0% |
Loan TypeThe type of loan (e.g., fixed, adjustable).
Loan type:
| Amortizing |
TermThe loan repayment period in years.
Term:
| 30 years |
Interest RateThe percentage a lender charges on the borrowed amount of a loan, determining the cost of borrowing money.
Interest rate:
| 5.875% |
Principal & Interest (PI)The principal is the portion of the loan payment that reduces the loan balance. The interest is the lender's charge for borrowing money. Calculation:(P * r * (1 + r) ** n) / ((1 + r) ** n - 1) Where:
P = Loan amount (principal)
Principal & interest:
| $2,267 |
Property TaxesAnnual taxes levied by local governments on real estate properties. These taxes fund public services like schools, roads, and emergency services.
Property tax:
| $154 |
InsuranceThe costs for insurance coverage to protect against financial losses due to risks like fire, natural disasters, theft, liability, or tenant-related damages. Calculation:Assumes 7% of gross rental income, unless insurance rates are specified.
Insurance:
| $154 |
Private Mortgage Insurance (PMI)A fee that borrowers pay when they take out a conventional loan with a loan-to-value (LTV) ratio above 80%.
Private mortgage insurance (PMI):
| $0 |
Monthly PaymentThe fixed amount a borrower pays each month to repay a loan. It typically includes principal and interest (P&I) and may also cover property taxes, insurance, HOA fees, and PMI if escrowed. Monthly payment:
| $2,575 |
Operating Income
| % Rent | Monthly | Yearly | |
|---|---|---|---|
Gross RentThe total rental income received from tenants before deducting any expenses. Includes base rent, late fees, pet fees, parking fees, and other recurring charges.
Gross rent:
| $2,200 | $26,400 | |
Vacancy LossExpected loss of rent due to vacancies.
Vacancy loss:
(6%)
| 6% | -$132 | -$1,584 |
Operating IncomeGross rental income minus vacancy loss. Calculation:Gross rent - Vacancy loss
Operating income:
| $2,068 | $24,816 |
Operating Expenses
| % Rent | Monthly | Yearly | |
|---|---|---|---|
Property TaxesAnnual taxes levied by local governments on real estate properties. These taxes fund public services like schools, roads, and emergency services. | 7% | -$154 | -$1,845 |
InsuranceThe costs for insurance coverage to protect against financial losses due to risks like fire, natural disasters, theft, liability, or tenant-related damages. Calculation:Assumes 7% of gross rental income, unless insurance rates are specified. | 7% | -$154 | -$1,848 |
Property ManagementThe costs associated with hiring a property manager to handle the day-to-day operations of a rental property. Includes management fees, leasing fes, eviction fees, etc. Calculation:Assumes 8% of gross rental income. | 8% | -$176 | -$2,112 |
Repairs & MaintenanceOngoing costs for routine upkeep and minor fixes needed to keep a property in good working condition. Calculation:Assumes 5% of gross rental income. Varies by property age and condition. | 5% | -$110 | -$1,320 |
Capital ExpensesLarge, infrequent costs for major improvements or replacements, like a new roof, HVAC system, or appliances. Calculation:Assumes 5% of gross rental income. Varies by property age. | 5% | -$110 | -$1,320 |
HOA FeesRegular dues paid to a Homeowners Association for community maintenance, amenities, and management. Similar fees include: Condo Association Fees, Co-op Maintenance Fees, etc. | n/a | n/a | n/a |
Operating ExpensesRecurring costs required to maintain and manage a rental property, including property taxes, insurance, maintenance, repairs, utilities (if paid by the owner), property management fees, and other day-to-day expenses. Calculation:Insurance + Property Taxes + Property Management + Repairs & Maintenance + Capital Expenditures + HOA Fees | 32% | -$704 | -$8,445 |
Cash Flow
| Monthly | Yearly | |
|---|---|---|
Net Operating Income (NOI)The income generated from a property after deducting all operating expenses but before deducting mortgage payments, taxes, and capital expenditures. Calculation:Gross Operating Income - Operating Expenses
Net operating income:
| $1,364 | $16,368 |
Mortgage PaymentThe fixed amount a borrower pays each month to repay a loan. It typically includes principal and interest (P&I) and may also cover property taxes, insurance, HOA fees, and PMI if escrowed. | -$2,267 | -$27,204 |
Cash FlowNet Operating Income (NOI) minus mortgage payments. Calculation:NOI - Mortgage Payments | $903 | $10,836 |