Phoenix, AZ Investment Properties for Sale
Browse homes for sale and investment properties in Phoenix, AZ. Refine your search by price, property type, or more.
Best cash flowing properties in Phoenix, AZ
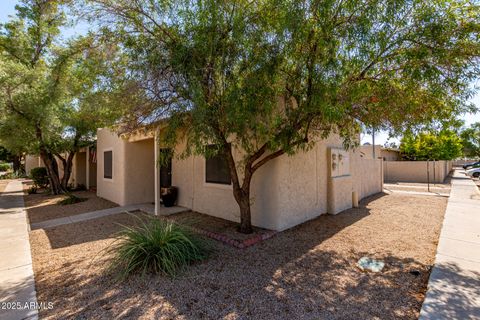
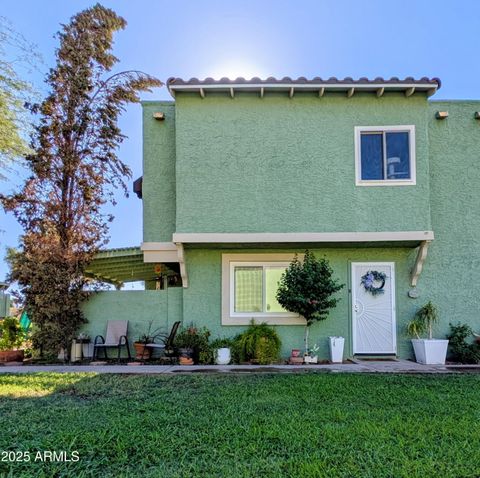
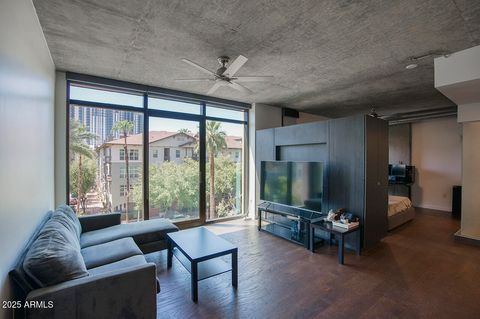
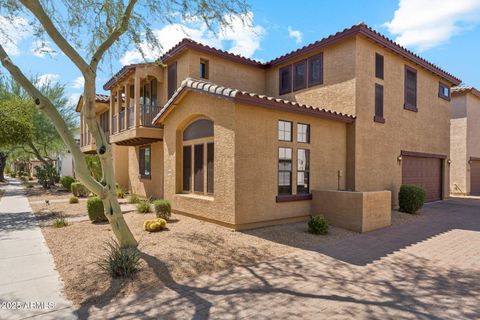
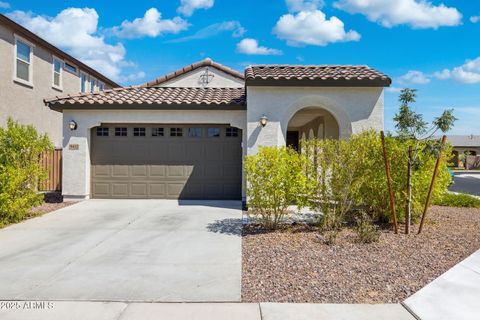
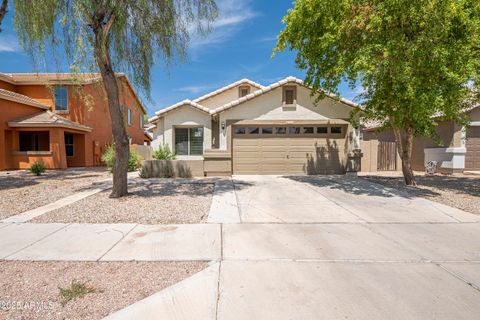
Active
$179,900
1
bds
|
1
ba
|
705
sqft
|
built
1981
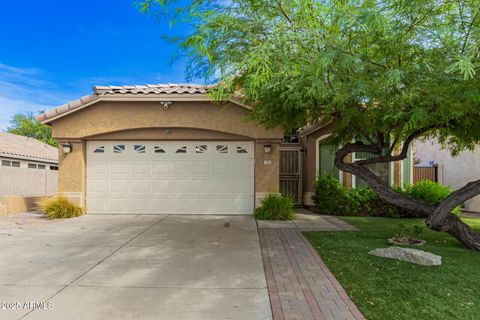
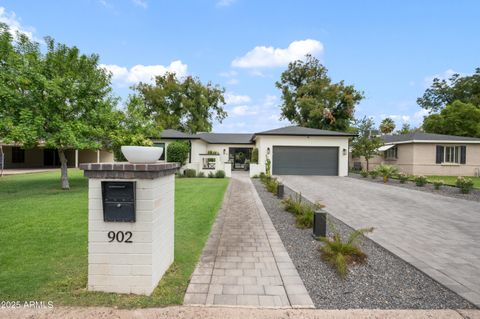
15601 N 27th St, Phoenix, AZ 85032
$-362
Cash flow
-10.5%
Cash-on-Cash Return
3.3%
Cap rate
0.6%
Rent to Value Ratio
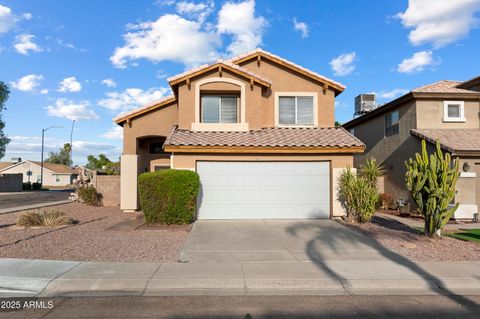
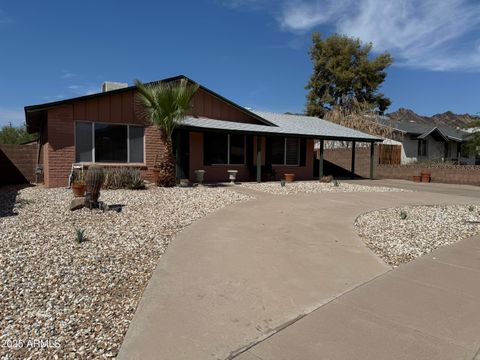
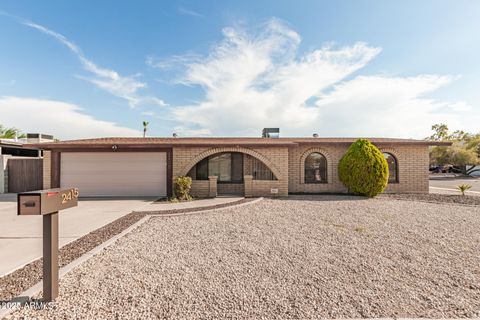
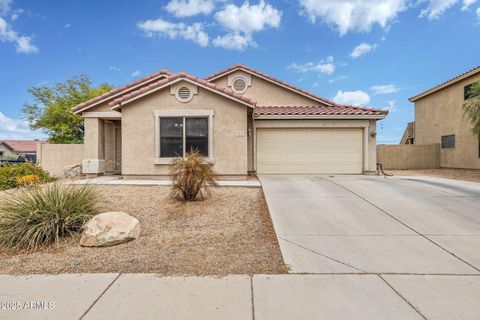
Active
$224,900
2
bds
|
2
ba
|
952
sqft
|
built
1984
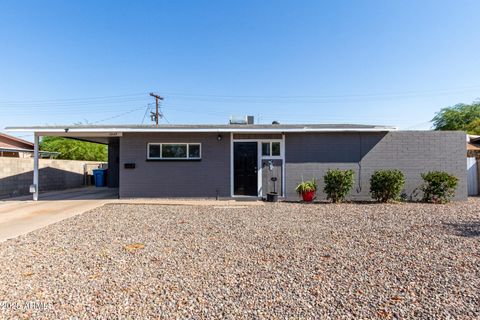
2437 E Tracy Ln, Phoenix, AZ 85032
$-369
Cash flow
-8.6%
Cash-on-Cash Return
3.7%
Cap rate
0.6%
Rent to Value Ratio
3,073 out of 3,386 properties for sale in Phoenix, AZ
Limited Results Shown
Create a free account, or log in to reveal all property listings and enjoy the complete experience.
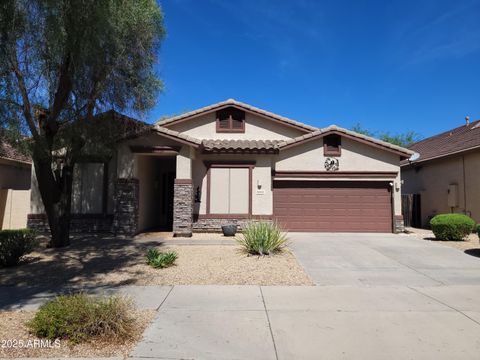
Active
$475,000
4
bds
|
3
ba
|
2,221
sqft
|
built
2007
10941 W Minnezona Ave, Phoenix, AZ 85037
$-964
Cash flow
-10.6%
Cash-on-Cash Return
3.2%
Cap rate
0.5%
Rent to Value Ratio
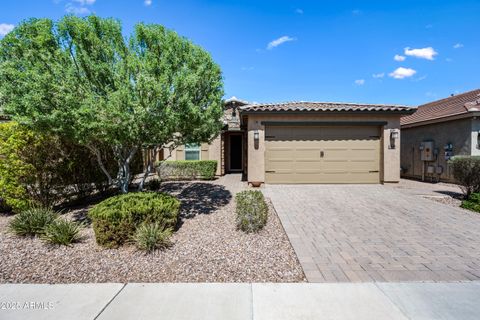
Active
$700,000
4
bds
|
4
ba
|
2,827
sqft
|
built
2021
7528 W Warner St, Phoenix, AZ 85043
$-1,834
Cash flow
-13.7%
Cash-on-Cash Return
2.5%
Cap rate
0.4%
Rent to Value Ratio
Active
$599,900
3
bds
|
2
ba
|
1,661
sqft
|
built
1995
3316 E Brookwood Ct, Phoenix, AZ 85048
$-1,346
Cash flow
-11.7%
Cash-on-Cash Return
3.0%
Cap rate
0.4%
Rent to Value Ratio

Active
$1,375,000
5
bds
|
5
ba
|
4,319
sqft
|
built
2003
41714 N Signal Hill Ct, Phoenix, AZ 85086
$-2,766
Cash flow
-10.5%
Cash-on-Cash Return
3.3%
Cap rate
0.5%
Rent to Value Ratio
Active
$325,000
2
bds
|
1
ba
|
896
sqft
|
built
1961
7649 W Whitton Ave, Phoenix, AZ 85033
$-489
Cash flow
-7.9%
Cash-on-Cash Return
3.9%
Cap rate
0.5%
Rent to Value Ratio
Active
$349,900
4
bds
|
3
ba
|
1,344
sqft
|
built
1953
2934 W Northern Ave, Phoenix, AZ 85051
$-597
Cash flow
-8.9%
Cash-on-Cash Return
3.6%
Cap rate
0.5%
Rent to Value Ratio
Active
$350,000
3
bds
|
2
ba
|
1,367
sqft
|
built
2002
2316 W Carson Rd, Phoenix, AZ 85041
$-473
Cash flow
-7.1%
Cash-on-Cash Return
4.1%
Cap rate
0.6%
Rent to Value Ratio
Active
$249,900
3
bds
|
2
ba
|
928
sqft
|
built
1975
10217 N 7th Pl, Phoenix, AZ 85020
$-386
Cash flow
-8.1%
Cash-on-Cash Return
3.8%
Cap rate
0.7%
Rent to Value Ratio
Active
$540,000
3
bds
|
3
ba
|
1,638
sqft
|
built
1996
18823 N 39th Way, Phoenix, AZ 85050
$-1,000
Cash flow
-9.7%
Cash-on-Cash Return
3.5%
Cap rate
0.5%
Rent to Value Ratio

Active
$875,000
4
bds
|
3
ba
|
2,608
sqft
|
built
2007
21622 N 39th Ter, Phoenix, AZ 85050
$-2,289
Cash flow
-13.6%
Cash-on-Cash Return
2.5%
Cap rate
0.4%
Rent to Value Ratio
Active
$575,000
3
bds
|
3
ba
|
2,020
sqft
|
built
2014
4727 E Betty Elyse Ln, Phoenix, AZ 85032
$-1,135
Cash flow
-10.3%
Cash-on-Cash Return
3.3%
Cap rate
0.5%
Rent to Value Ratio
Active
$778,900
4
bds
|
3
ba
|
2,532
sqft
|
built
2017
2929 W Amber Sun Dr, Phoenix, AZ 85085
$-1,627
Cash flow
-10.9%
Cash-on-Cash Return
3.2%
Cap rate
0.4%
Rent to Value Ratio
Active
$450,000
1
bds
|
1
ba
|
745
sqft
|
built
2016
100 W Portland St, Phoenix, AZ 85003
$-1,583
Cash flow
-18.4%
Cash-on-Cash Return
1.5%
Cap rate
0.4%
Rent to Value Ratio
Active
$395,000
3
bds
|
2
ba
|
1,389
sqft
|
built
1972
1432 E Purdue Ave, Phoenix, AZ 85020
$-581
Cash flow
-7.7%
Cash-on-Cash Return
3.9%
Cap rate
0.5%
Rent to Value Ratio
Active
$485,000
3
bds
|
2
ba
|
1,583
sqft
|
built
1988
15421 S 38th St, Phoenix, AZ 85044
$-923
Cash flow
-9.9%
Cash-on-Cash Return
3.4%
Cap rate
0.5%
Rent to Value Ratio
Active
$495,000
3
bds
|
3
ba
|
1,734
sqft
|
built
1993
9207 S 51st St, Phoenix, AZ 85044
$-1,157
Cash flow
-12.2%
Cash-on-Cash Return
2.9%
Cap rate
0.5%
Rent to Value Ratio
Active
$460,000
3
bds
|
3
ba
|
1,882
sqft
|
built
2005
2366 W Sleepy Ranch Rd, Phoenix, AZ 85085
$-1,031
Cash flow
-11.7%
Cash-on-Cash Return
3.0%
Cap rate
0.5%
Rent to Value Ratio
Active
$345,000
3
bds
|
3
ba
|
1,394
sqft
|
built
2007
2150 W Alameda Rd, Phoenix, AZ 85085
$-456
Cash flow
-6.9%
Cash-on-Cash Return
4.1%
Cap rate
0.6%
Rent to Value Ratio
Active
$575,000
3
bds
|
2
ba
|
1,922
sqft
|
built
2004
31912 N 23rd Ave, Phoenix, AZ 85085
$-1,334
Cash flow
-12.1%
Cash-on-Cash Return
2.9%
Cap rate
0.4%
Rent to Value Ratio

Active
$460,000
2
bds
|
2
ba
|
1,662
sqft
|
built
2019
2425 W Bronco Butte Trl, Phoenix, AZ 85085
$-1,248
Cash flow
-14.2%
Cash-on-Cash Return
2.4%
Cap rate
0.5%
Rent to Value Ratio

Active
$675,000
4
bds
|
2
ba
|
1,932
sqft
|
built
1976
15244 N 7th Pl, Phoenix, AZ 85022
$-1,517
Cash flow
-11.7%
Cash-on-Cash Return
3.0%
Cap rate
0.4%
Rent to Value Ratio

Active
$639,777
4
bds
|
2
ba
|
1,596
sqft
|
built
1958
1002 E Butler Dr, Phoenix, AZ 85020
$-1,565
Cash flow
-12.8%
Cash-on-Cash Return
2.7%
Cap rate
0.4%
Rent to Value Ratio
Active
$565,000
3
bds
|
2
ba
|
1,619
sqft
|
built
2016
1846 W Bonanza Dr, Phoenix, AZ 85085
$-1,173
Cash flow
-10.8%
Cash-on-Cash Return
3.2%
Cap rate
0.5%
Rent to Value Ratio
Active
$429,000
3
bds
|
2
ba
|
1,396
sqft
|
built
2023
9432 W Roma Ave, Phoenix, AZ 85037
$-1,160
Cash flow
-14.1%
Cash-on-Cash Return
2.4%
Cap rate
0.4%
Rent to Value Ratio
Active
$390,000
3
bds
|
2
ba
|
1,639
sqft
|
built
1974
2415 W Villa Rita Dr, Phoenix, AZ 85023
$-414
Cash flow
-5.5%
Cash-on-Cash Return
4.4%
Cap rate
0.6%
Rent to Value Ratio
Active
$350,000
2
bds
|
1
ba
|
936
sqft
|
built
1978
3150 W Michelle Dr, Phoenix, AZ 85053
$-466
Cash flow
-6.9%
Cash-on-Cash Return
4.1%
Cap rate
0.5%
Rent to Value Ratio

Active
$950,000
6
bds
|
6
ba
|
4,561
sqft
|
built
2006
42043 N Bradon Way, Phoenix, AZ 85086
$-1,601
Cash flow
-8.8%
Cash-on-Cash Return
3.7%
Cap rate
0.6%
Rent to Value Ratio
Active
$280,000
2
bds
|
2
ba
|
886
sqft
|
built
1987
1720 E Thunderbird Rd, Phoenix, AZ 85022
$-606
Cash flow
-11.3%
Cash-on-Cash Return
3.1%
Cap rate
0.6%
Rent to Value Ratio

Active
$595,000
4
bds
|
3
ba
|
2,406
sqft
|
built
2008
2411 W Corral Rd, Phoenix, AZ 85041
$-1,493
Cash flow
-13.1%
Cash-on-Cash Return
2.7%
Cap rate
0.4%
Rent to Value Ratio
Active
$1,550,000
4
bds
|
4
ba
|
2,954
sqft
|
built
2020
902 W State Ave, Phoenix, AZ 85021
$-3,194
Cash flow
-10.8%
Cash-on-Cash Return
3.2%
Cap rate
0.4%
Rent to Value Ratio
Active
$745,000
4
bds
|
4
ba
|
2,792
sqft
|
built
2005
41318 N Bent Creek Way, Phoenix, AZ 85086
$-1,869
Cash flow
-13.1%
Cash-on-Cash Return
2.7%
Cap rate
0.5%
Rent to Value Ratio
Active
$1,474,000
5
bds
|
3
ba
|
2,844
sqft
|
built
1974
9046 N 28th St, Phoenix, AZ 85028
$-4,042
Cash flow
-14.3%
Cash-on-Cash Return
2.4%
Cap rate
0.3%
Rent to Value Ratio
Active
$419,000
2
bds
|
3
ba
|
1,435
sqft
|
built
1996
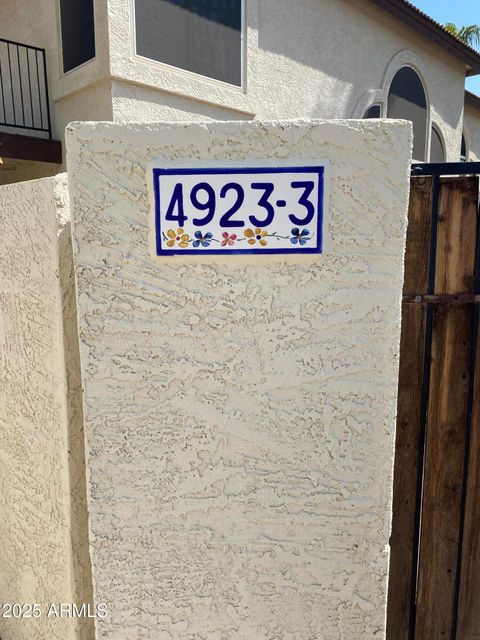
4923 E Hazel Dr, Phoenix, AZ 85044
$-952
Cash flow
-11.9%
Cash-on-Cash Return
3.0%
Cap rate
0.5%
Rent to Value Ratio
Active
$345,000
4
bds
|
2
ba
|
1,518
sqft
|
built
2004
8218 W Superior Ave, Phoenix, AZ 85043
$-431
Cash flow
-6.5%
Cash-on-Cash Return
4.2%
Cap rate
0.6%
Rent to Value Ratio
Active
$364,990
3
bds
|
2
ba
|
1,436
sqft
|
built
2001
9214 W Pierson St, Phoenix, AZ 85037
$-670
Cash flow
-9.6%
Cash-on-Cash Return
3.5%
Cap rate
0.5%
Rent to Value Ratio
Active
$629,000
3
bds
|
2
ba
|
1,404
sqft
|
built
1940
2227 N Evergreen St, Phoenix, AZ 85006
$-1,527
Cash flow
-12.7%
Cash-on-Cash Return
2.8%
Cap rate
0.4%
Rent to Value Ratio

Active
$513,000
3
bds
|
2
ba
|
1,340
sqft
|
built
1977
611 E Tam Oshanter Dr, Phoenix, AZ 85022
$-1,246
Cash flow
-12.7%
Cash-on-Cash Return
2.8%
Cap rate
0.4%
Rent to Value Ratio
Active
$425,000
3
bds
|
3
ba
|
1,800
sqft
|
built
2002
1750 W Union Hills Dr, Phoenix, AZ 85027
$-644
Cash flow
-7.9%
Cash-on-Cash Return
3.9%
Cap rate
0.5%
Rent to Value Ratio