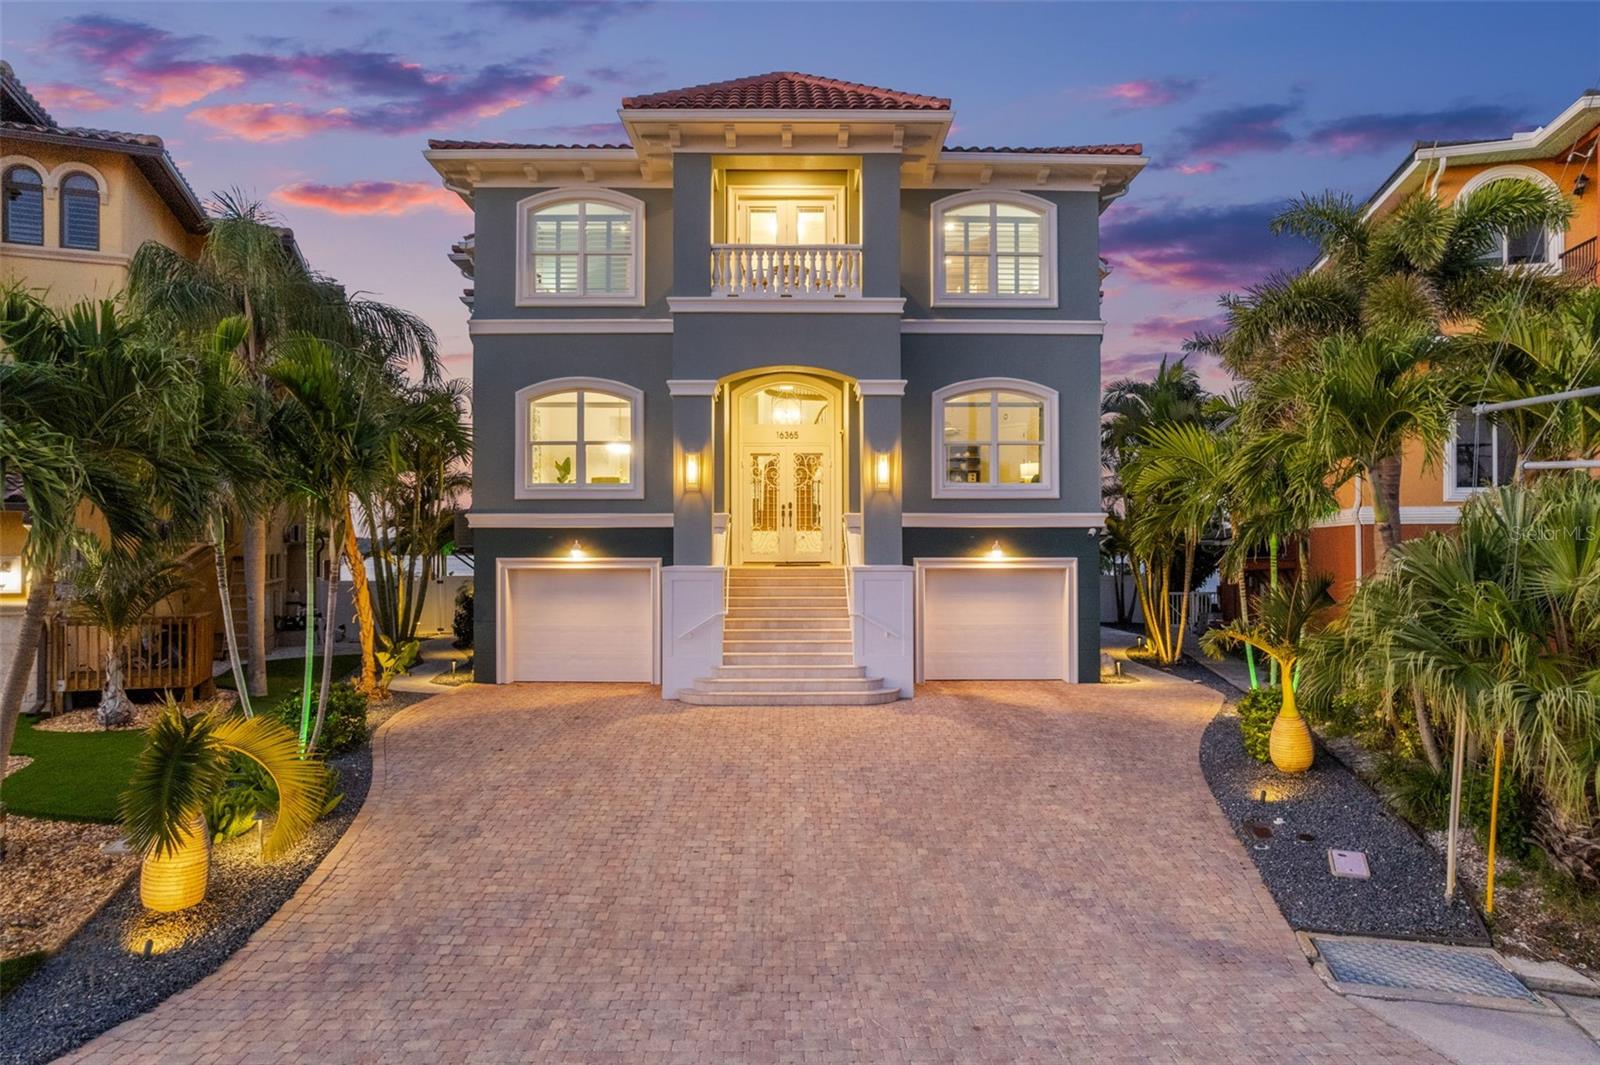
$3,799,999
Investment Summary
- Monthly Cash Flow
- -$15,376
- Cap Rate
- 1.3%
- Cash-on-Cash Return
- -21.1%
- Debt Coverage Ratio
- 0.21
- Internal Rate of Return (5 years)
- -16.4%
Cash Flow
Net Operating Income (NOI) minus mortgage payments.
Calculation:
NOI - Mortgage Payments
Cap Rate (Market Value)
Capitalization Rate is a rate of return that compares the yearly Net Operating Income (NOI) to the market value.
Calculation:
NOI / Market Value
Cash-on-Cash Return (CoC)
Annual Cash Flow / Cash Invested
Calculation:
Annual cash flow divided by initial cash invested.
Debt Coverage Ratio (DCR)
Net Operating Income (NOI) divided by total debt payments.
Calculation:
NOI / Total Debt Payments
Internal Rate of Return (IRR)
A metric for assessing profitability over time. IRR is the discount rate at which the net present value (NPV) of all future cash flows (positive and negative) from an investment equals zero — including both periodic cash flow (such as rent) and a projected sale at the end of the holding period. It represents the expected annualized return, accounting for income, expenses, and the recovery of capital through a future sale.
Property Description
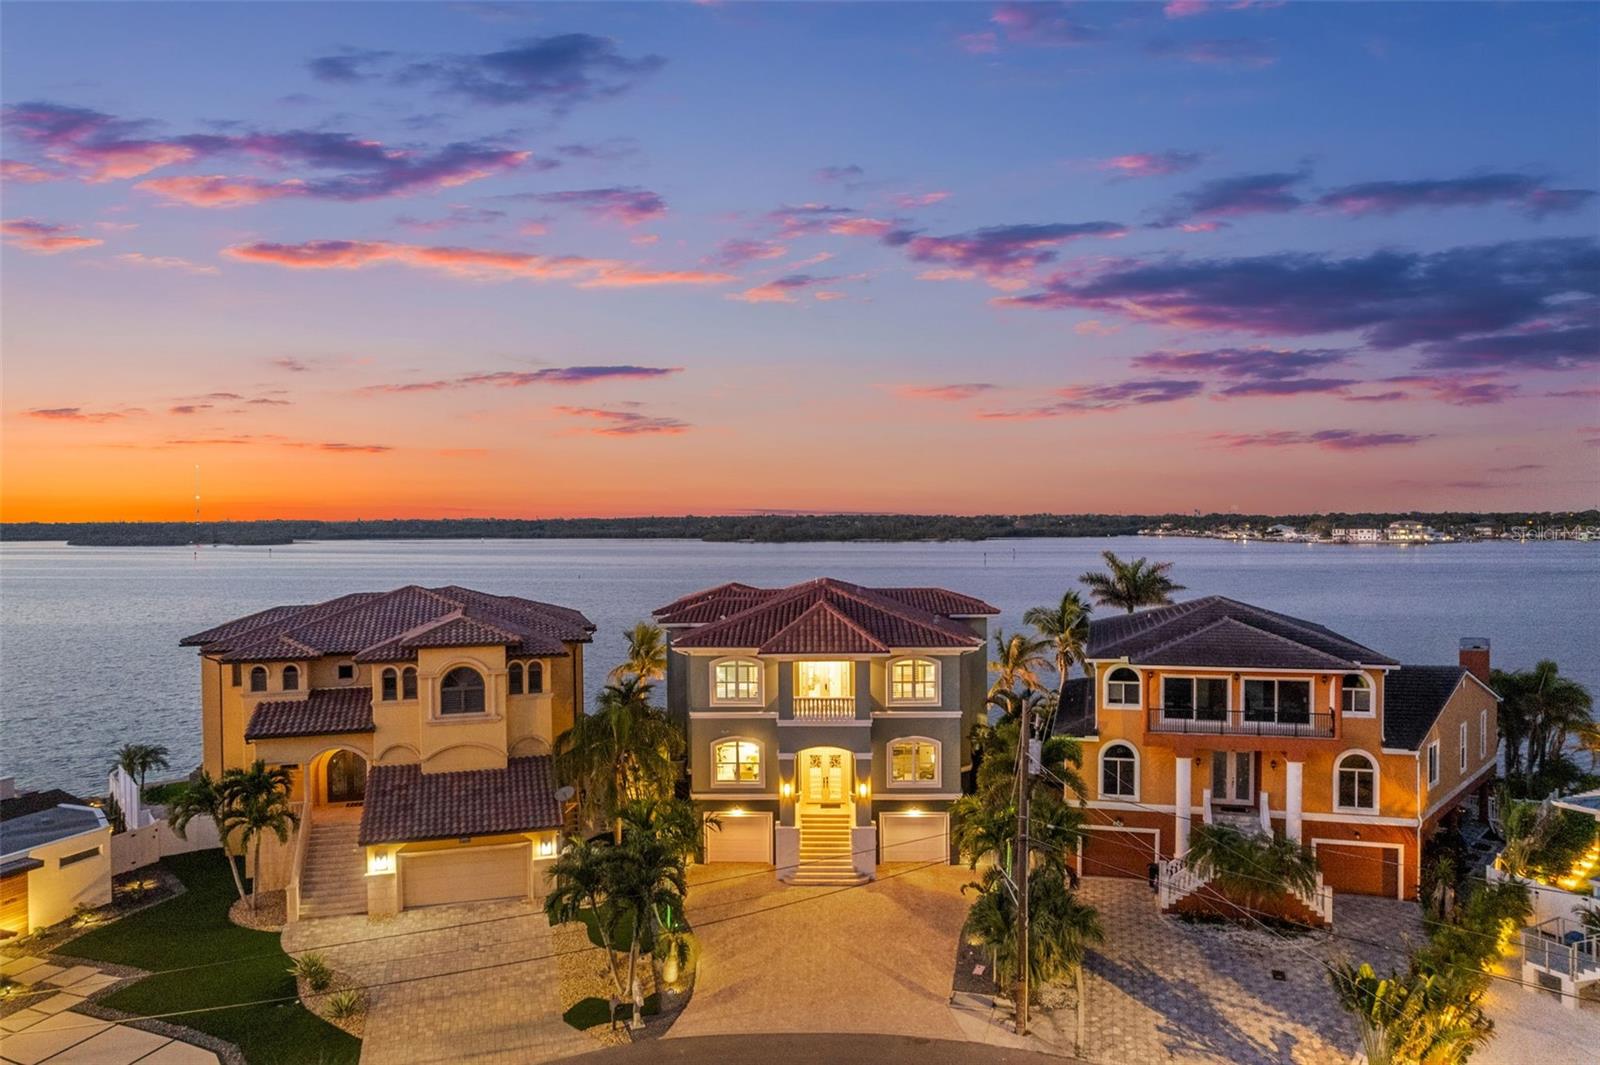
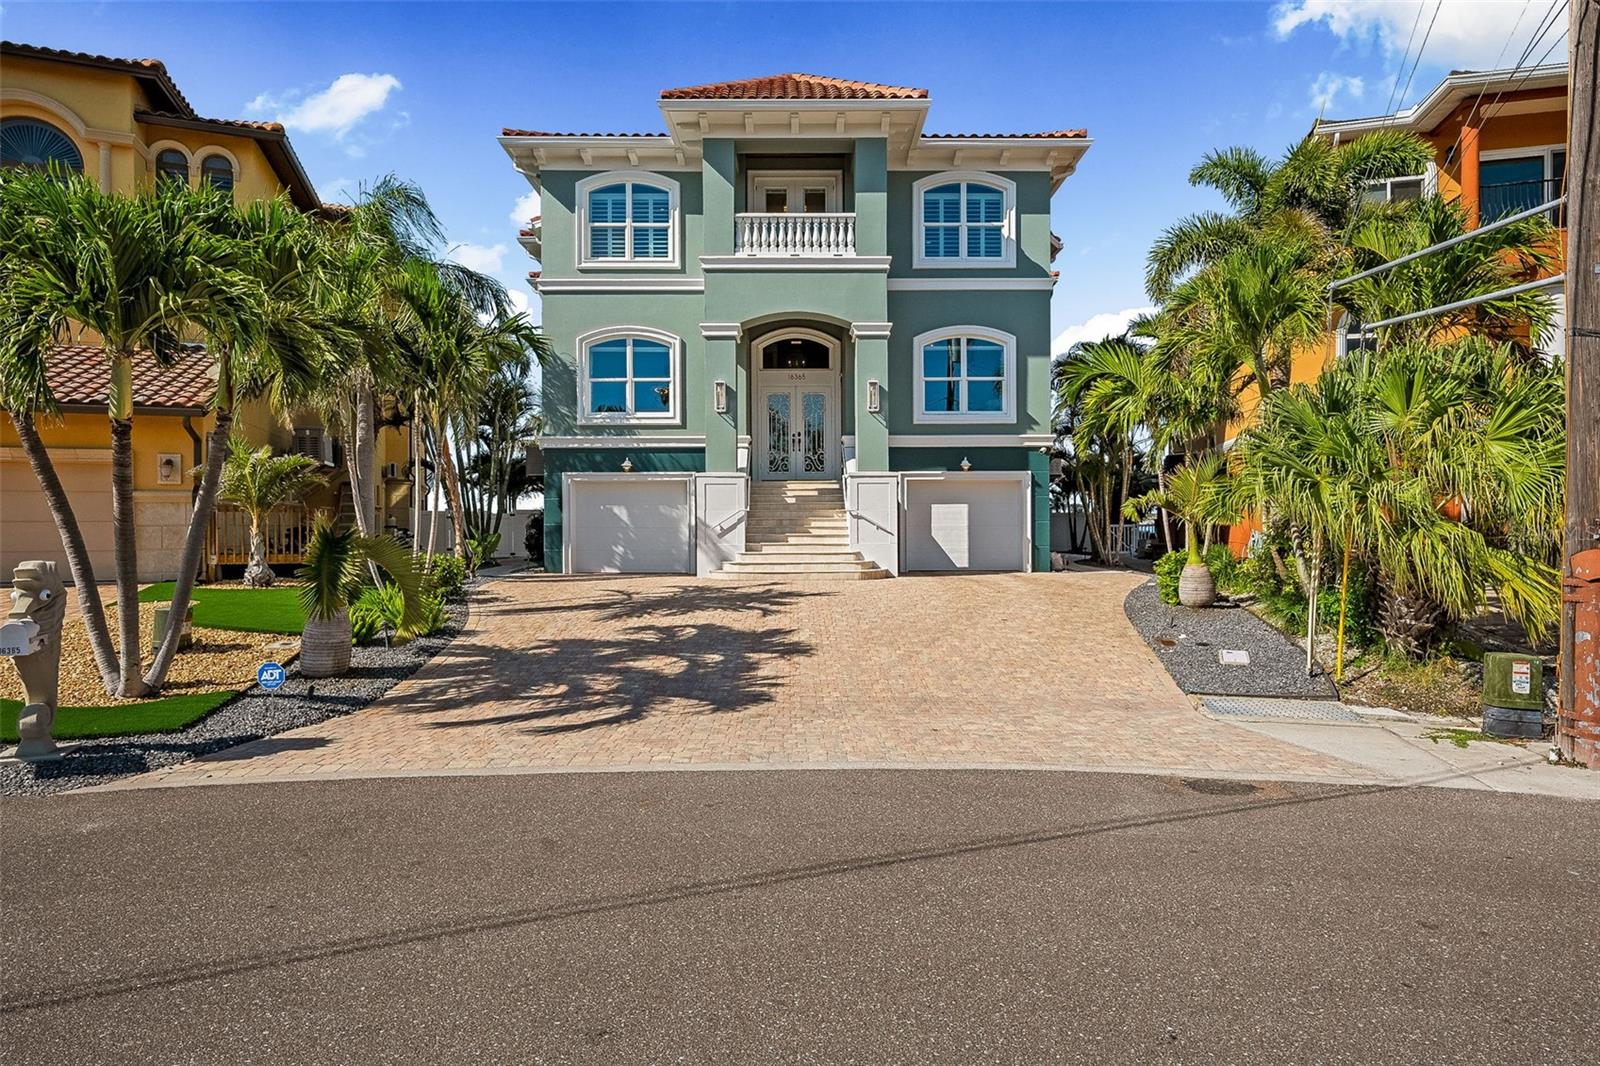
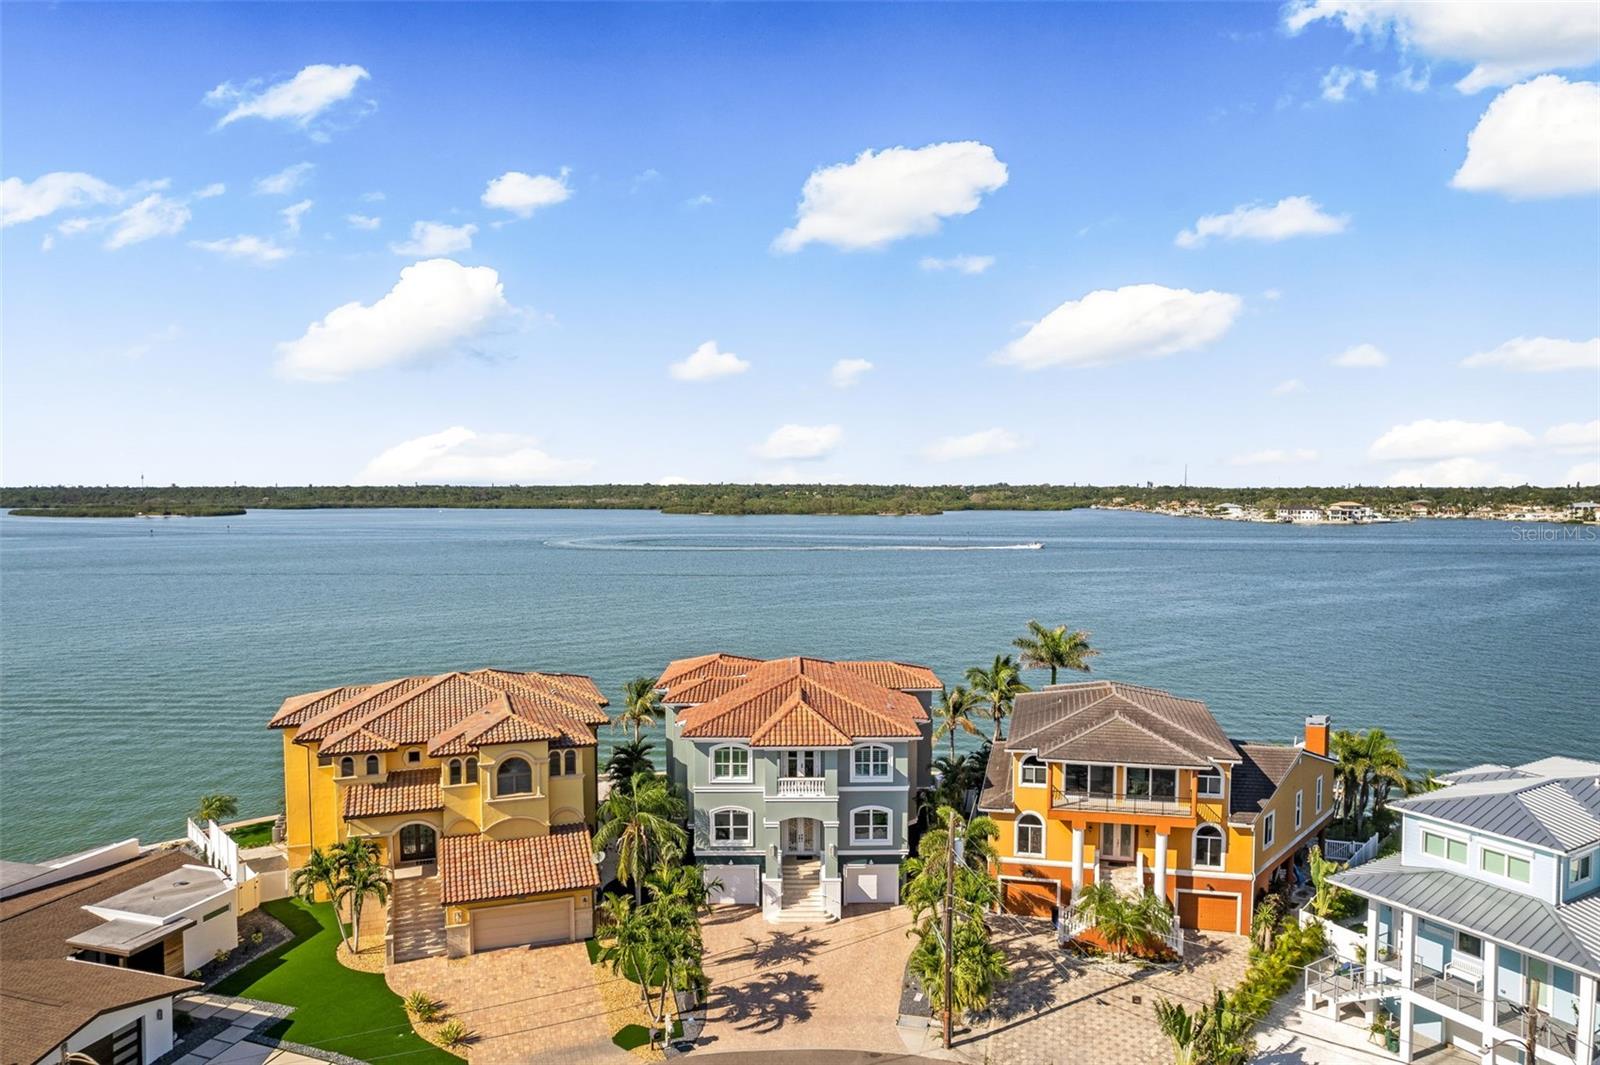
Under contract-accepting backup offers. SOON TO BE FEATURED ON HGTV'S 100 DAY DREAM HOME! RARE COVETED POINT LOT ON THE INTRACOASTAL WITH OPEN WATER VIEWS!!! This extraordinary ELEVATED estate is a sanctuary of style, technology, AND strength, offering the ultimate expression of refined waterfront living! Every detail of this home has been meticulously reimagined- TONS OF RECENT RENOVATIONS including new interior and exterior paint, premium porcelain tile flooring, upgraded bathrooms, upgraded chef's kitchen, automated privacy sunshades, pavers, landscaping, and more. With an unrivaled commitment to structural integrity, this residence is engineered to withstand the fiercest storms, built with insulated concrete construction, a tile roof, impact-rated windows, triple-lock doors, and a 2025 generator.Distinguishing features that elevate this home above the rest include a commercial-grade elevator servicing all levels, a full-home Control4 smart automation system, integrated stereo sound throughout, and the convenience of natural gas. Behind the front door lies a grand foyer that sets the tone for what’s to come: soaring ceilings and seamless flow between curated living spaces. The sophisticated office, formal dining room, and open-concept family room are bathed in natural light with stunning water views. The designer kitchen is a statement in itself—anchored by a dramatic, extra-thick quartz island and outfitted with top-tier appliances, ideal for culinary artistry and entertaining. Enjoy seamless indoor-outdoor living with balconies on both the front and back of the home—perfect for sunset dinners while watching the boats pass, or unwinding in complete tranquility—this is a setting like no other.Upstairs, retreat to your private primary suite—an opulent haven with its own gas fireplace, private balcony offering uninterrupted water views, and spa-inspired bathroom featuring a soaking tub, resort-style shower, and exceptional walk-in closet system. Spacious guest suites with en-suite bathrooms provide comfort and privacy. Outdoors, enjoy a newly resurfaced saltwater pool with brand-new pump and equipment, a putting green, and multiple spaces to unwind or entertain. The dock and boat lift have been professionally maintained and recently descaled, offering direct access to the Bay for effortless boating. A transferable flood insurance policy with premiums under $1,000 annually adds an extra layer of value and peace of mind. Located minutes from pristine beaches, bars, restaurants, and shopping, this property sits in a golf cart-friendly community—this is not just a residence, but a lifestyle. Don't miss out on your opportunity to own one of the most exceptional waterfront properties on the market today!
Build Your Team
Quickly find investor-friendly professionals who can help you succeed in real estate investing at any stage of the investing journey.


Agents
Match with investor-friendly agents who can help you find, analyze, and close your next deal


Lenders
Get the best funding…find investor-friendly lenders who specialize in your deal strategy


Property Managers
Transition to passive investing. Find a trusted property management partnership that lasts.


Tax Pros & Accountants
Taxes and financial reporting made easy—find experts to create tax savings strategies, file taxes, and more
Location
Property Details
Parking
- Description: Driveway, Garage Door Opener, Oversized, Split Garage, Tandem, Workshop in Garage
- Details: Driveway, Garage Door Opener, Garage, Attached
- Garage Spaces: 3
- Spaces Total: 0
Bedroom Information
- # of Bedrooms: 4
Bathroom Information
- # of Baths (Full): 4
- # of Baths (Total): 5.0
Interior Features
- # of Rooms: 4
- # of Stories: 3
- Fireplace: Yes
Exterior Features
- Exterior Walls Materials: Brick
- Foundation: Slab
- Roof Type: Gable
- Roof Material: Tile
- Pool: Yes
Land Information
- Land Use: Residential
- Land Use Subtype: Single Family Residential
Lot Information
- Parcel ID: 053115739440000340
- Lot Size: 8372 sqft
Property Information
- Property Type: Single Family Residence
- Year Built: 2014
Tax Information
- Annual Tax: $32,069
Utilities
- Water & Sewer: Public
- Heating: Central, Natural Gas, Zoned
- Cooling: Central Air, Zoned
Location
- County: Pinellas
Listing Details
Investment Summary
- Monthly Cash Flow
- -$15,376
- Cap Rate
- 1.3%
- Cash-on-Cash Return
- -21.1%
- Debt Coverage Ratio
- 0.21
- Internal Rate of Return (5 years)
- -16.4%
Cash Flow
Net Operating Income (NOI) minus mortgage payments.
Calculation:
NOI - Mortgage Payments
Cap Rate (Market Value)
Capitalization Rate is a rate of return that compares the yearly Net Operating Income (NOI) to the market value.
Calculation:
NOI / Market Value
Cash-on-Cash Return (CoC)
Annual Cash Flow / Cash Invested
Calculation:
Annual cash flow divided by initial cash invested.
Debt Coverage Ratio (DCR)
Net Operating Income (NOI) divided by total debt payments.
Calculation:
NOI / Total Debt Payments
Internal Rate of Return (IRR)
A metric for assessing profitability over time. IRR is the discount rate at which the net present value (NPV) of all future cash flows (positive and negative) from an investment equals zero — including both periodic cash flow (such as rent) and a projected sale at the end of the holding period. It represents the expected annualized return, accounting for income, expenses, and the recovery of capital through a future sale.
Purchase Details
Purchase PriceThe price paid for the property. Purchase price:
| $3,799,999 |
|---|---|
Amount FinancedThe amount of the purchase financed through a loan. Amount financed:
| -$3,039,999 |
Down paymentThe initial payment made towards the purchase. Down payment:
| $760,000 |
Closing CostsFees and expenses associated with purchasing a property, typically ranging from 2% to 5% of the home’s purchase price, paid at the end of a home purchase to cover services like lending, title transfer, and taxes. Closing costs:
| $114,000 |
Rehab CostsCosts incurred to repair or improve the property, including: roof, flooring, exterior siding, kitchen, exterior paint, bathrooms, etc. Rehab costs:
| $0 |
Initial Cash InvestedThe total initial cash invested in the property. Calculation:Down payment + Buying costs + Rehab costs Initial cash invested:
| $874,000 |
Square Feet (SQFT)The total square footage of the property. Square feet:
| 4,752 |
Cost Per Square FootCost per square foot of the property. Calculation:Purchase Price / Square Feet Cost per square foot:
| $800 |
Monthly Rent Per Square FootMonthly rent divided by the number of square feet. This ratio helps investors compare rental income efficiency across properties, markets, and unit sizes Calculation:Monthly Rent / Square Feet Monthly rent per square foot:
| $2.06 |
Financing Details
Loan AmountThe total sum of money borrowed from a lender to finance a property purchase. Calculation:Purchase Price - Down Payment
Loan amount:
| $3,039,999 |
|---|---|
Loan to Value Ratio (LTV)Loan amount divided by the market value of the property. Calculation:Loan Amount / Market Value
Loan to value ratio:
| 80.0% |
Loan TypeThe type of loan (e.g., fixed, adjustable).
Loan type:
| Amortizing |
TermThe loan repayment period in years.
Term:
| 30 years |
Interest RateThe percentage a lender charges on the borrowed amount of a loan, determining the cost of borrowing money.
Interest rate:
| 6.625% |
Principal & Interest (PI)The principal is the portion of the loan payment that reduces the loan balance. The interest is the lender's charge for borrowing money. Calculation:(P * r * (1 + r) ** n) / ((1 + r) ** n - 1) Where:
P = Loan amount (principal)
Principal & interest:
| $19,465 |
Property TaxesAnnual taxes levied by local governments on real estate properties. These taxes fund public services like schools, roads, and emergency services.
Property tax:
| $2,673 |
InsuranceThe costs for insurance coverage to protect against financial losses due to risks like fire, natural disasters, theft, liability, or tenant-related damages. Calculation:Assumes 7% of gross rental income, unless insurance rates are specified.
Insurance:
| $686 |
Private Mortgage Insurance (PMI)A fee that borrowers pay when they take out a conventional loan with a loan-to-value (LTV) ratio above 80%.
Private mortgage insurance (PMI):
| $0 |
Monthly PaymentThe fixed amount a borrower pays each month to repay a loan. It typically includes principal and interest (P&I) and may also cover property taxes, insurance, HOA fees, and PMI if escrowed. Monthly payment:
| $22,824 |
Operating Income
| % Rent | Monthly | Yearly | |
|---|---|---|---|
Gross RentThe total rental income received from tenants before deducting any expenses. Includes base rent, late fees, pet fees, parking fees, and other recurring charges.
Gross rent:
| $9,800 | $117,600 | |
Vacancy LossExpected loss of rent due to vacancies.
Vacancy loss:
(6%)
| 6% | -$588 | -$7,056 |
Operating IncomeGross rental income minus vacancy loss. Calculation:Gross rent - Vacancy loss
Operating income:
| $9,212 | $110,544 |
Operating Expenses
| % Rent | Monthly | Yearly | |
|---|---|---|---|
Property TaxesAnnual taxes levied by local governments on real estate properties. These taxes fund public services like schools, roads, and emergency services. | 27% | -$2,673 | -$32,070 |
InsuranceThe costs for insurance coverage to protect against financial losses due to risks like fire, natural disasters, theft, liability, or tenant-related damages. Calculation:Assumes 7% of gross rental income, unless insurance rates are specified. | 7% | -$686 | -$8,232 |
Property ManagementThe costs associated with hiring a property manager to handle the day-to-day operations of a rental property. Includes management fees, leasing fes, eviction fees, etc. Calculation:Assumes 8% of gross rental income. | 8% | -$784 | -$9,408 |
Repairs & MaintenanceOngoing costs for routine upkeep and minor fixes needed to keep a property in good working condition. Calculation:Assumes 5% of gross rental income. Varies by property age and condition. | 5% | -$490 | -$5,880 |
Capital ExpensesLarge, infrequent costs for major improvements or replacements, like a new roof, HVAC system, or appliances. Calculation:Assumes 5% of gross rental income. Varies by property age. | 5% | -$490 | -$5,880 |
HOA FeesRegular dues paid to a Homeowners Association for community maintenance, amenities, and management. Similar fees include: Condo Association Fees, Co-op Maintenance Fees, etc. | n/a | n/a | n/a |
Operating ExpensesRecurring costs required to maintain and manage a rental property, including property taxes, insurance, maintenance, repairs, utilities (if paid by the owner), property management fees, and other day-to-day expenses. Calculation:Insurance + Property Taxes + Property Management + Repairs & Maintenance + Capital Expenditures + HOA Fees | 52% | -$5,123 | -$61,470 |
Cash Flow
| Monthly | Yearly | |
|---|---|---|
Net Operating Income (NOI)The income generated from a property after deducting all operating expenses but before deducting mortgage payments, taxes, and capital expenditures. Calculation:Gross Operating Income - Operating Expenses
Net operating income:
| $4,089 | $49,068 |
Mortgage PaymentThe fixed amount a borrower pays each month to repay a loan. It typically includes principal and interest (P&I) and may also cover property taxes, insurance, HOA fees, and PMI if escrowed. | -$19,465 | -$233,580 |
Cash FlowNet Operating Income (NOI) minus mortgage payments. Calculation:NOI - Mortgage Payments | -$15,376 | -$184,512 |