$950,000
Investment Summary
- Monthly Cash Flow
- -$1,934
- Cap Rate
- 3.7%
- Cash-on-Cash Return
- -10.6%
- Debt Coverage Ratio
- 0.60
- Internal Rate of Return (5 years)
- -6.3%
Cash Flow
Net Operating Income (NOI) minus mortgage payments.
Calculation:
NOI - Mortgage Payments
Cap Rate (Market Value)
Capitalization Rate is a rate of return that compares the yearly Net Operating Income (NOI) to the market value.
Calculation:
NOI / Market Value
Cash-on-Cash Return (CoC)
Annual Cash Flow / Cash Invested
Calculation:
Annual cash flow divided by initial cash invested.
Debt Coverage Ratio (DCR)
Net Operating Income (NOI) divided by total debt payments.
Calculation:
NOI / Total Debt Payments
Internal Rate of Return (IRR)
A metric for assessing profitability over time. IRR is the discount rate at which the net present value (NPV) of all future cash flows (positive and negative) from an investment equals zero — including both periodic cash flow (such as rent) and a projected sale at the end of the holding period. It represents the expected annualized return, accounting for income, expenses, and the recovery of capital through a future sale.
Property Description
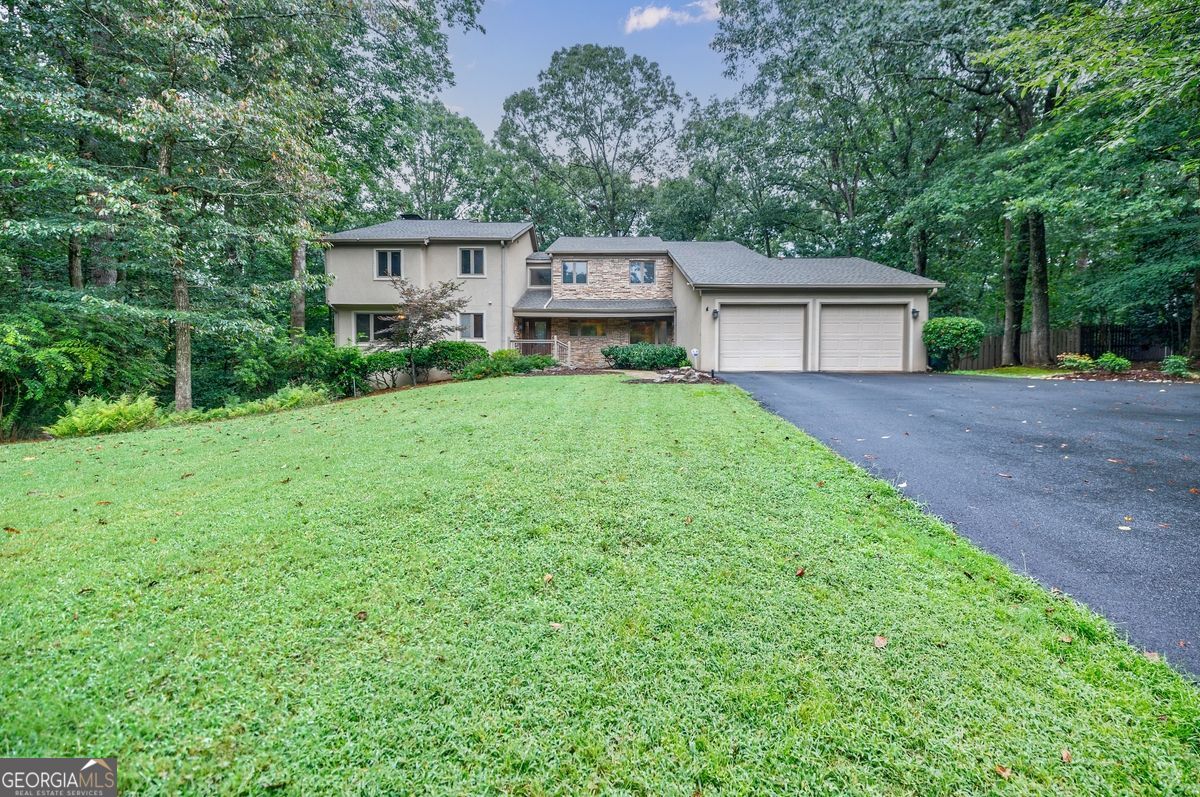
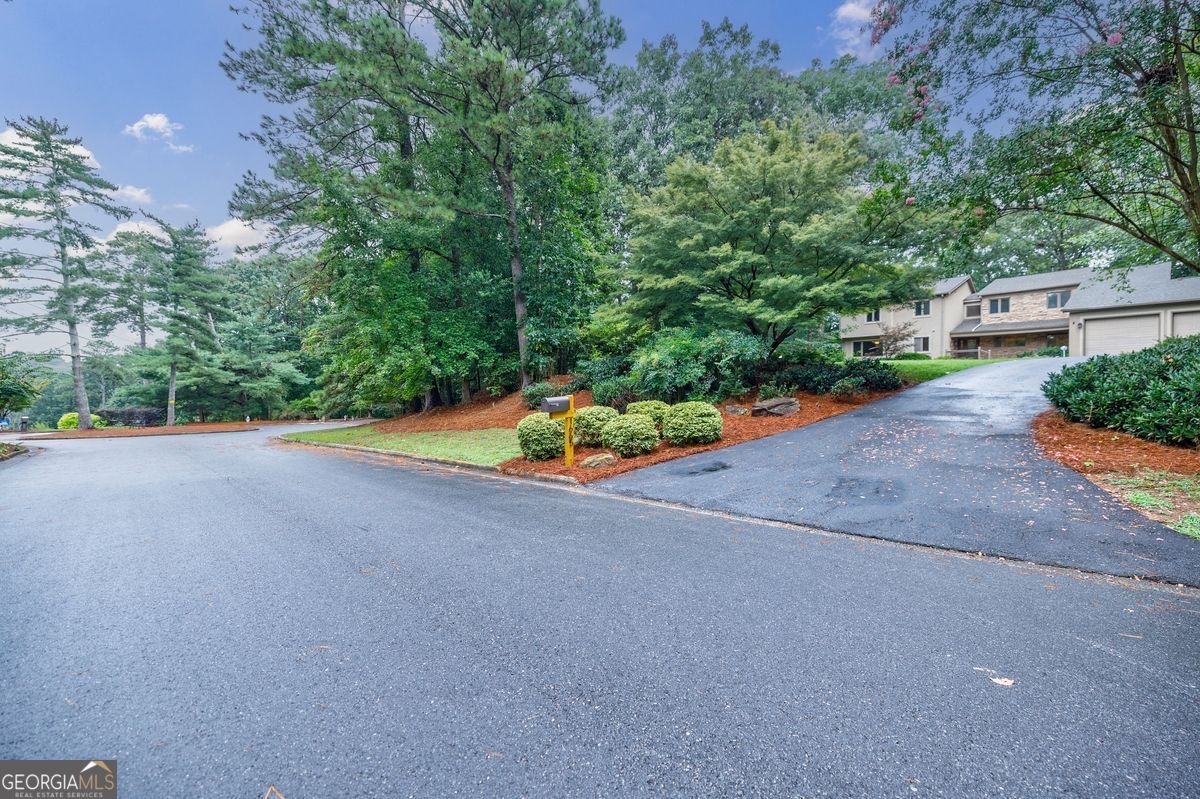
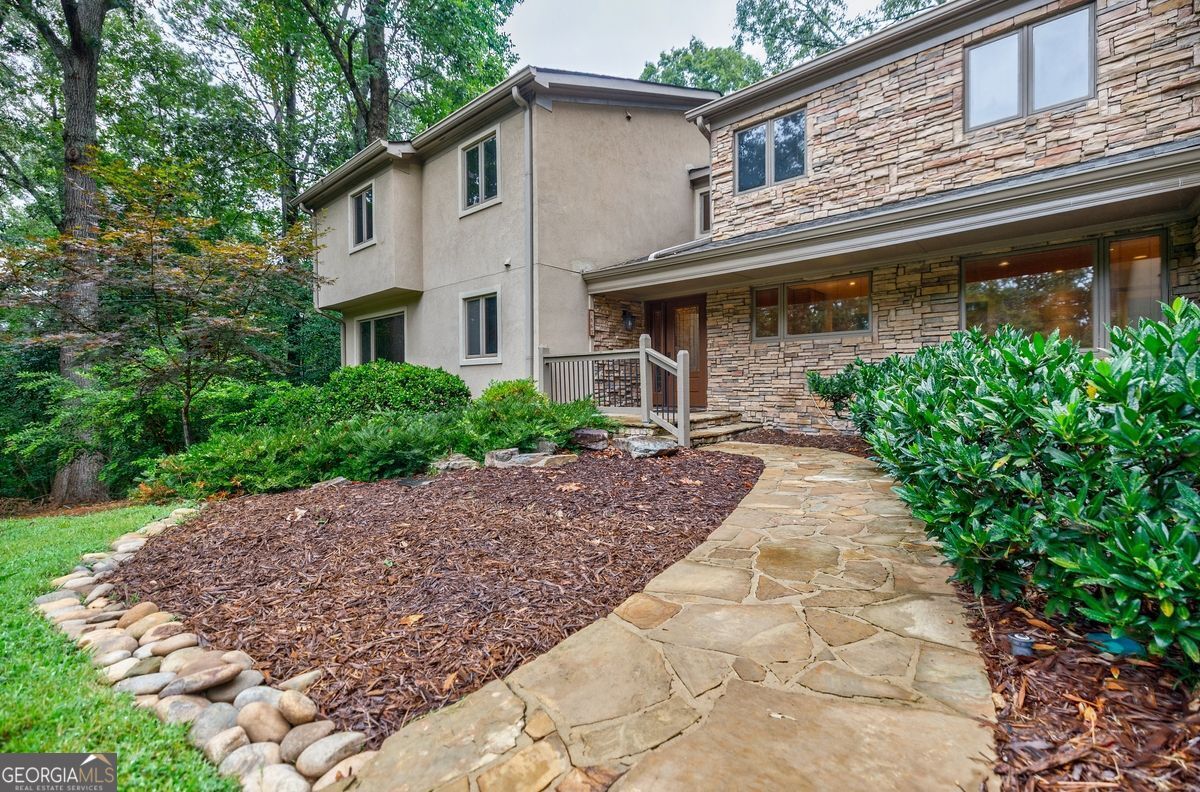
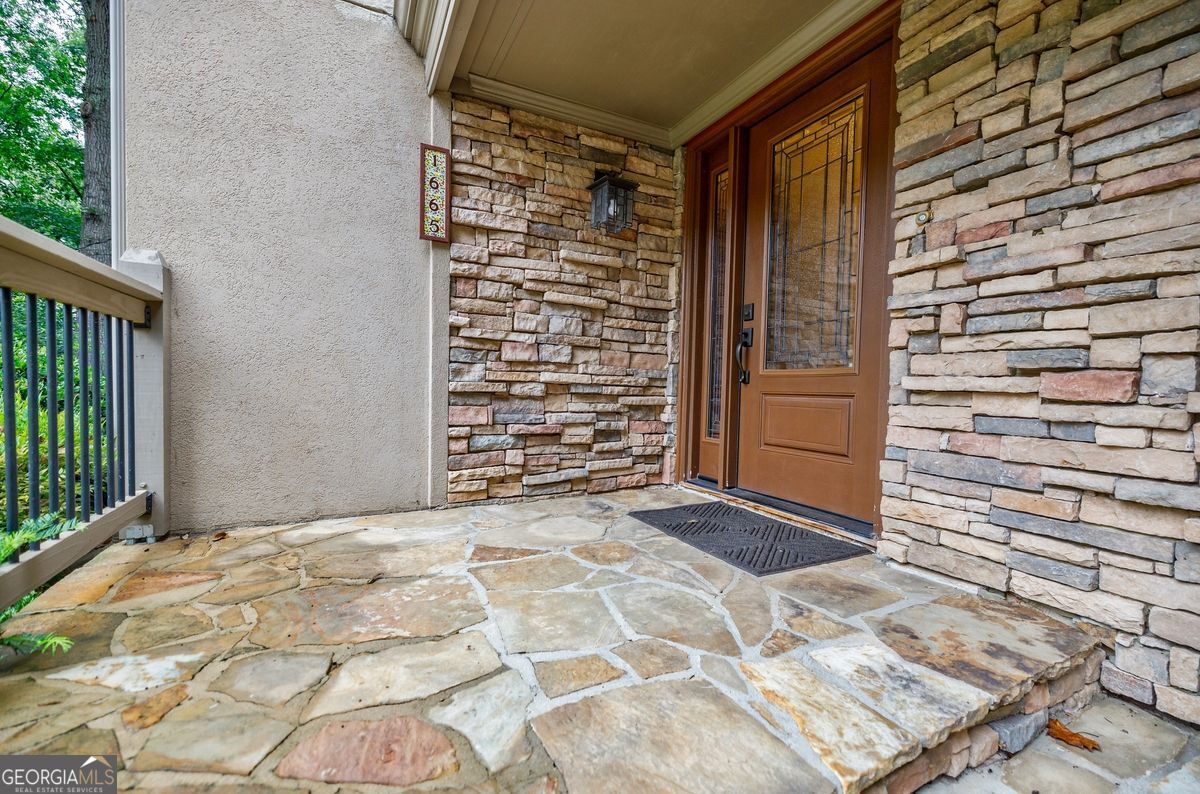
Tucked away on a quiet cul-de-sac in Sandy Springs, this spacious 5-bedroom, 4-bath contemporary home on a wooded 1 acre-plus lot offers privacy, plus easy access to Georgia 400 and I-285. The architect who designed the house focused on functionality and ease of access across all three levels, providing privacy and personal space for all, plus including large kitchen, dining and gathering areas. The main floor features a dining room that can seat 12 if desired, plus a large, comfortable living room with windows overlooking the pool, patio, decks and wooded yard. The oversized kitchen has top-tier appliances and lots of storage space with an eat-in kitchen area and opens to a screened porch for relaxation and eating. Also on the main floor, you'll find a bedroom and a bathroom, and a separate seating area that also faces the backyard. Upstairs there is a huge primary suite, with two walk-in closets and en-suite bathroom. Outside the primary suite is a seating, reading and relaxation area. In addition upstairs there are three other bedrooms and a bathroom, plus a convenient laundry room. Another feature of this home is a finished basement with a bar area with wine cooler, dishwasher and refrigerator. There is also a room with adjoining bathroom that can serve as a bedroom or bonus room for craft space, office, exercise equipment or other use. From the basement, you can walk directly out to the pool, deck and patio area. There are also two storage rooms in the basement. The two-car garage includes a large pantry-style closet with plenty of shelving for storage, plus a room along the back of the garage wall for a workshop or more storage. The front yard is well-maintained with mature vegetation, and there are woods on one side of the lot and below the pool to the property line. The windows are double-paned, and the asphalt driveway and extra parking spaces were recently resurfaced and re-sealed. The roof is three years old, and the new electrical panel was installed in August 2025. The home is in Saddleridge, a long-established neighborhood of 51 homes over 75 acres; each home occupies at least one acre. There is a voluntary HOA which maintains the two-cul-de-sacs and the subdivision front entrance, plus holds casual get-togethers each year for residents. The original owners were among the first residents of the neighborhood and raised 5 children there, with the creative home design providing privacy and a spot for everyone. For fans of the Atlanta Braves, former Braves' All-Star third baseman Bob Horner lived across the street and would provide a bus to take neighborhood residents to home games on occasion. The owners took terrific care of the house and it has been well-maintained. It features wood trim and special touches and storage and living space that is exceptional.
Build Your Team
Quickly find investor-friendly professionals who can help you succeed in real estate investing at any stage of the investing journey.


Agents
Match with investor-friendly agents who can help you find, analyze, and close your next deal


Lenders
Get the best funding…find investor-friendly lenders who specialize in your deal strategy


Property Managers
Transition to passive investing. Find a trusted property management partnership that lasts.


Tax Pros & Accountants
Taxes and financial reporting made easy—find experts to create tax savings strategies, file taxes, and more
Location
Property Details
Parking
- Details: Attached, Garage Door Opener, Garage, Parking Pad, Storage
- Garage Spaces: 2
- Spaces Total: 2
Bedroom Information
- # of Bedrooms: 5
Bathroom Information
- # of Baths (Full): 4
- # of Baths (Partial): 1
- # of Baths (Total): 4.0
Interior Features
- # of Rooms: 7
- # of Stories: 3
- Basement: Yes
- Basement Description: Daylight, Interior Entry, Exterior Entry, Finished, Full
- Fireplace: Yes
Exterior Features
- Exterior Walls Materials: Wood
- Foundation: Block
- Roof Material: Other
- Pool: Yes
HOA
- Has HOA: Yes
- HOA Fee: $120/annually
Land Information
- Land Use: Residential
- Land Use Subtype: Single Family Residential
Lot Information
- Parcel ID: 06035300030064
- Lot Size: 0 sqft
Property Information
- Property Type: Single Family Residence
- Style: Contemporary
- Year Built: 1977
Tax Information
- Annual Tax: $2,778
Utilities
- Water & Sewer: Public
- Heating: Central, Natural Gas, Hot Water
- Cooling: Ceiling Fan(s), Central Air, Zoned
Location
- County: Fulton
Listing Details
Investment Summary
- Monthly Cash Flow
- -$1,934
- Cap Rate
- 3.7%
- Cash-on-Cash Return
- -10.6%
- Debt Coverage Ratio
- 0.60
- Internal Rate of Return (5 years)
- -6.3%
Cash Flow
Net Operating Income (NOI) minus mortgage payments.
Calculation:
NOI - Mortgage Payments
Cap Rate (Market Value)
Capitalization Rate is a rate of return that compares the yearly Net Operating Income (NOI) to the market value.
Calculation:
NOI / Market Value
Cash-on-Cash Return (CoC)
Annual Cash Flow / Cash Invested
Calculation:
Annual cash flow divided by initial cash invested.
Debt Coverage Ratio (DCR)
Net Operating Income (NOI) divided by total debt payments.
Calculation:
NOI / Total Debt Payments
Internal Rate of Return (IRR)
A metric for assessing profitability over time. IRR is the discount rate at which the net present value (NPV) of all future cash flows (positive and negative) from an investment equals zero — including both periodic cash flow (such as rent) and a projected sale at the end of the holding period. It represents the expected annualized return, accounting for income, expenses, and the recovery of capital through a future sale.
Purchase Details
Purchase PriceThe price paid for the property. Purchase price:
| $950,000 |
|---|---|
Amount FinancedThe amount of the purchase financed through a loan. Amount financed:
| -$760,000 |
Down paymentThe initial payment made towards the purchase. Down payment:
| $190,000 |
Closing CostsFees and expenses associated with purchasing a property, typically ranging from 2% to 5% of the home’s purchase price, paid at the end of a home purchase to cover services like lending, title transfer, and taxes. Closing costs:
| $28,500 |
Rehab CostsCosts incurred to repair or improve the property, including: roof, flooring, exterior siding, kitchen, exterior paint, bathrooms, etc. Rehab costs:
| $0 |
Initial Cash InvestedThe total initial cash invested in the property. Calculation:Down payment + Buying costs + Rehab costs Initial cash invested:
| $218,500 |
Square Feet (SQFT)The total square footage of the property. Square feet:
| 4,496 |
Cost Per Square FootCost per square foot of the property. Calculation:Purchase Price / Square Feet Cost per square foot:
| $211 |
Monthly Rent Per Square FootMonthly rent divided by the number of square feet. This ratio helps investors compare rental income efficiency across properties, markets, and unit sizes Calculation:Monthly Rent / Square Feet Monthly rent per square foot:
| $1.02 |
Financing Details
Loan AmountThe total sum of money borrowed from a lender to finance a property purchase. Calculation:Purchase Price - Down Payment
Loan amount:
| $760,000 |
|---|---|
Loan to Value Ratio (LTV)Loan amount divided by the market value of the property. Calculation:Loan Amount / Market Value
Loan to value ratio:
| 80.0% |
Loan TypeThe type of loan (e.g., fixed, adjustable).
Loan type:
| Amortizing |
TermThe loan repayment period in years.
Term:
| 30 years |
Interest RateThe percentage a lender charges on the borrowed amount of a loan, determining the cost of borrowing money.
Interest rate:
| 6.625% |
Principal & Interest (PI)The principal is the portion of the loan payment that reduces the loan balance. The interest is the lender's charge for borrowing money. Calculation:(P * r * (1 + r) ** n) / ((1 + r) ** n - 1) Where:
P = Loan amount (principal)
Principal & interest:
| $4,866 |
Property TaxesAnnual taxes levied by local governments on real estate properties. These taxes fund public services like schools, roads, and emergency services.
Property tax:
| $232 |
InsuranceThe costs for insurance coverage to protect against financial losses due to risks like fire, natural disasters, theft, liability, or tenant-related damages. Calculation:Assumes 7% of gross rental income, unless insurance rates are specified.
Insurance:
| $322 |
Private Mortgage Insurance (PMI)A fee that borrowers pay when they take out a conventional loan with a loan-to-value (LTV) ratio above 80%.
Private mortgage insurance (PMI):
| $0 |
Monthly PaymentThe fixed amount a borrower pays each month to repay a loan. It typically includes principal and interest (P&I) and may also cover property taxes, insurance, HOA fees, and PMI if escrowed. Monthly payment:
| $5,420 |
Operating Income
| % Rent | Monthly | Yearly | |
|---|---|---|---|
Gross RentThe total rental income received from tenants before deducting any expenses. Includes base rent, late fees, pet fees, parking fees, and other recurring charges.
Gross rent:
| $4,600 | $55,200 | |
Vacancy LossExpected loss of rent due to vacancies.
Vacancy loss:
(6%)
| 6% | -$276 | -$3,312 |
Operating IncomeGross rental income minus vacancy loss. Calculation:Gross rent - Vacancy loss
Operating income:
| $4,324 | $51,888 |
Operating Expenses
| % Rent | Monthly | Yearly | |
|---|---|---|---|
Property TaxesAnnual taxes levied by local governments on real estate properties. These taxes fund public services like schools, roads, and emergency services. | 5% | -$232 | -$2,778 |
InsuranceThe costs for insurance coverage to protect against financial losses due to risks like fire, natural disasters, theft, liability, or tenant-related damages. Calculation:Assumes 7% of gross rental income, unless insurance rates are specified. | 7% | -$322 | -$3,864 |
Property ManagementThe costs associated with hiring a property manager to handle the day-to-day operations of a rental property. Includes management fees, leasing fes, eviction fees, etc. Calculation:Assumes 8% of gross rental income. | 8% | -$368 | -$4,416 |
Repairs & MaintenanceOngoing costs for routine upkeep and minor fixes needed to keep a property in good working condition. Calculation:Assumes 5% of gross rental income. Varies by property age and condition. | 5% | -$230 | -$2,760 |
Capital ExpensesLarge, infrequent costs for major improvements or replacements, like a new roof, HVAC system, or appliances. Calculation:Assumes 5% of gross rental income. Varies by property age. | 5% | -$230 | -$2,760 |
HOA FeesRegular dues paid to a Homeowners Association for community maintenance, amenities, and management. Similar fees include: Condo Association Fees, Co-op Maintenance Fees, etc. | 0% | -$10 | -$120 |
Operating ExpensesRecurring costs required to maintain and manage a rental property, including property taxes, insurance, maintenance, repairs, utilities (if paid by the owner), property management fees, and other day-to-day expenses. Calculation:Insurance + Property Taxes + Property Management + Repairs & Maintenance + Capital Expenditures + HOA Fees | 30% | -$1,392 | -$16,698 |
Cash Flow
| Monthly | Yearly | |
|---|---|---|
Net Operating Income (NOI)The income generated from a property after deducting all operating expenses but before deducting mortgage payments, taxes, and capital expenditures. Calculation:Gross Operating Income - Operating Expenses
Net operating income:
| $2,932 | $35,184 |
Mortgage PaymentThe fixed amount a borrower pays each month to repay a loan. It typically includes principal and interest (P&I) and may also cover property taxes, insurance, HOA fees, and PMI if escrowed. | -$4,866 | -$58,392 |
Cash FlowNet Operating Income (NOI) minus mortgage payments. Calculation:NOI - Mortgage Payments | -$1,934 | -$23,208 |