$1,950,000
Investment Summary
- Monthly Cash Flow
- -$7,256
- Cap Rate
- 1.7%
- Cash-on-Cash Return
- -19.4%
- Debt Coverage Ratio
- 0.27
- Internal Rate of Return (5 years)
- -14.8%
Cash Flow
Net Operating Income (NOI) minus mortgage payments.
Calculation:
NOI - Mortgage Payments
Cap Rate (Market Value)
Capitalization Rate is a rate of return that compares the yearly Net Operating Income (NOI) to the market value.
Calculation:
NOI / Market Value
Cash-on-Cash Return (CoC)
Annual Cash Flow / Cash Invested
Calculation:
Annual cash flow divided by initial cash invested.
Debt Coverage Ratio (DCR)
Net Operating Income (NOI) divided by total debt payments.
Calculation:
NOI / Total Debt Payments
Internal Rate of Return (IRR)
A metric for assessing profitability over time. IRR is the discount rate at which the net present value (NPV) of all future cash flows (positive and negative) from an investment equals zero — including both periodic cash flow (such as rent) and a projected sale at the end of the holding period. It represents the expected annualized return, accounting for income, expenses, and the recovery of capital through a future sale.
Property Description
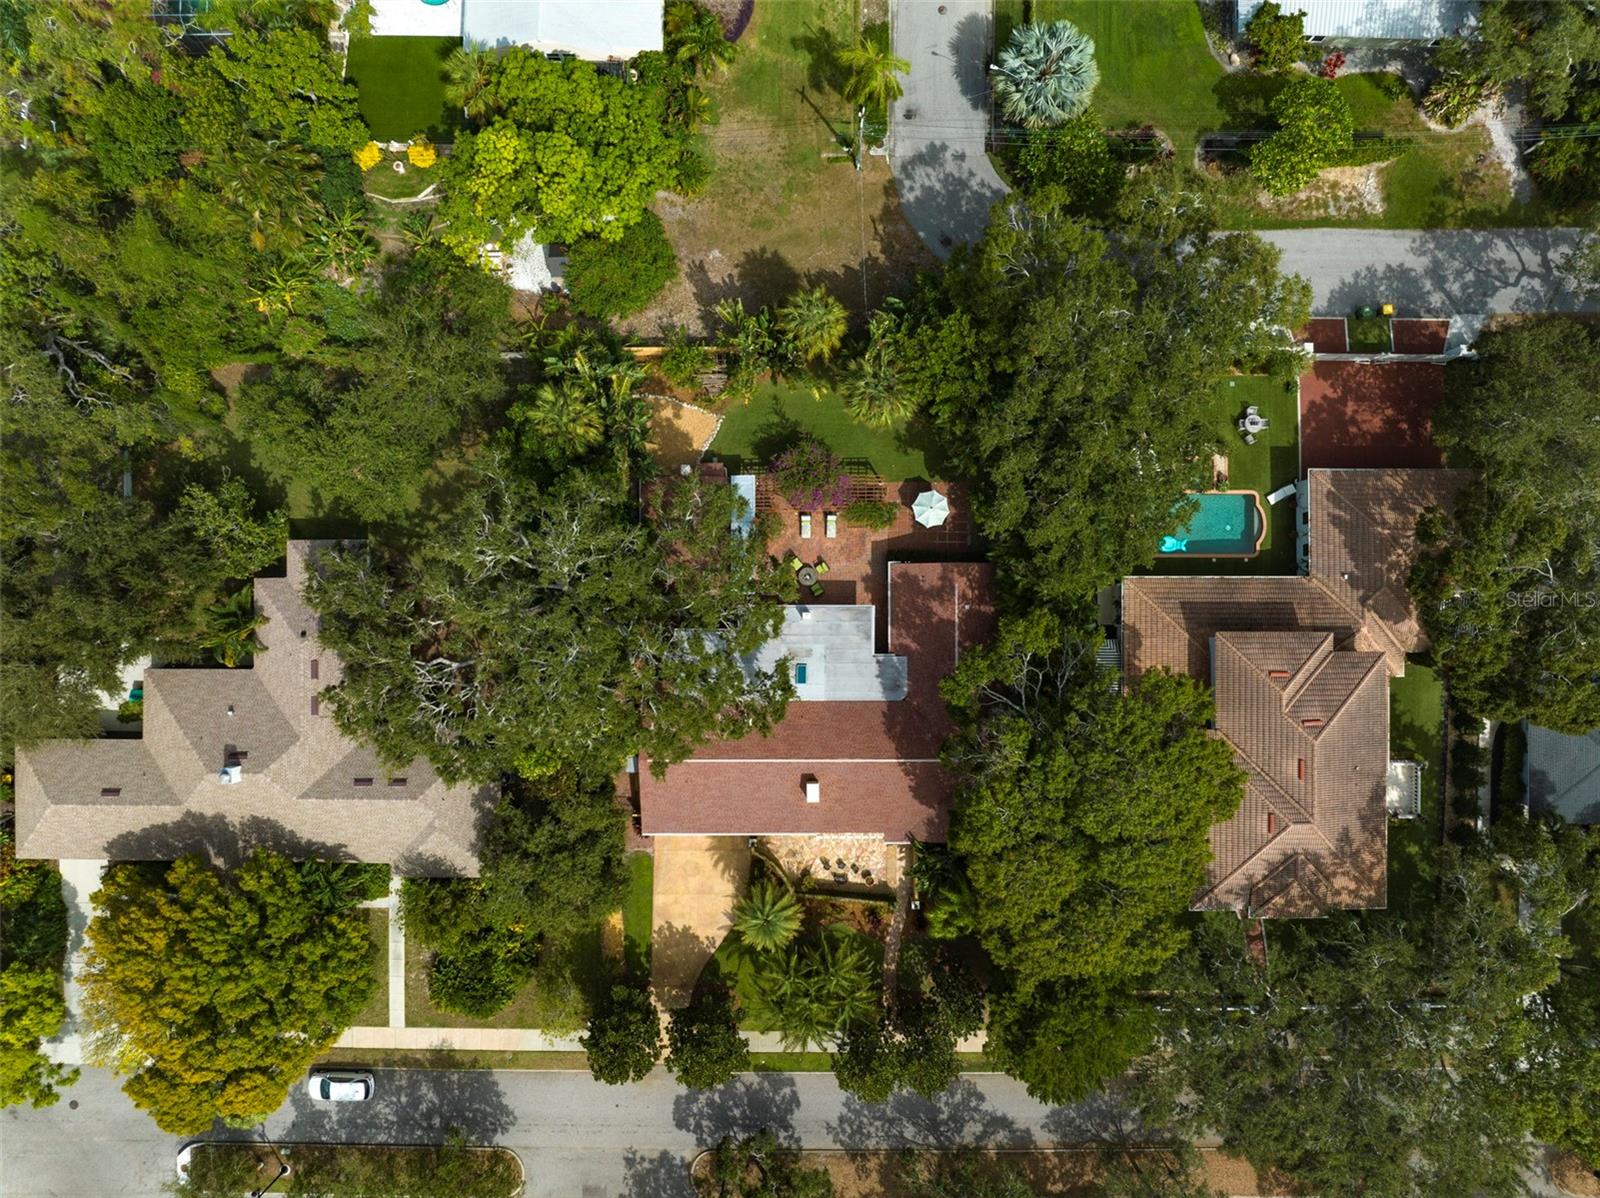
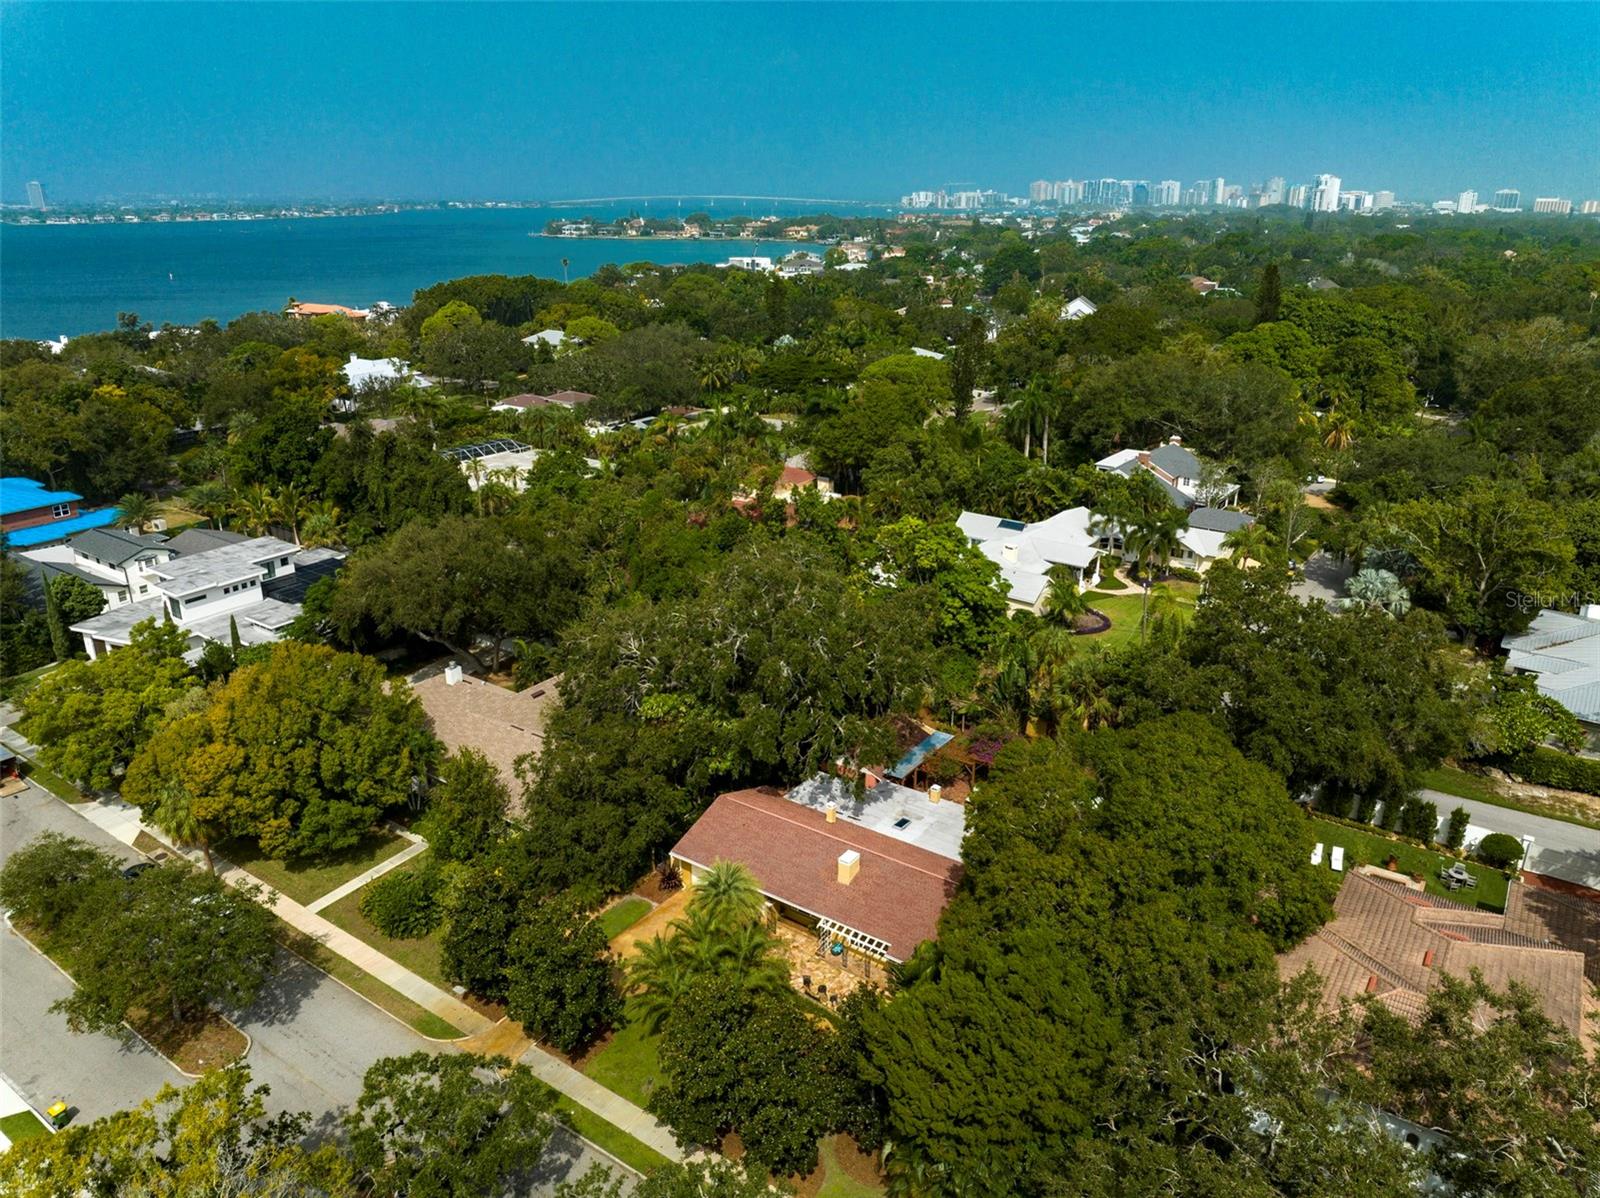
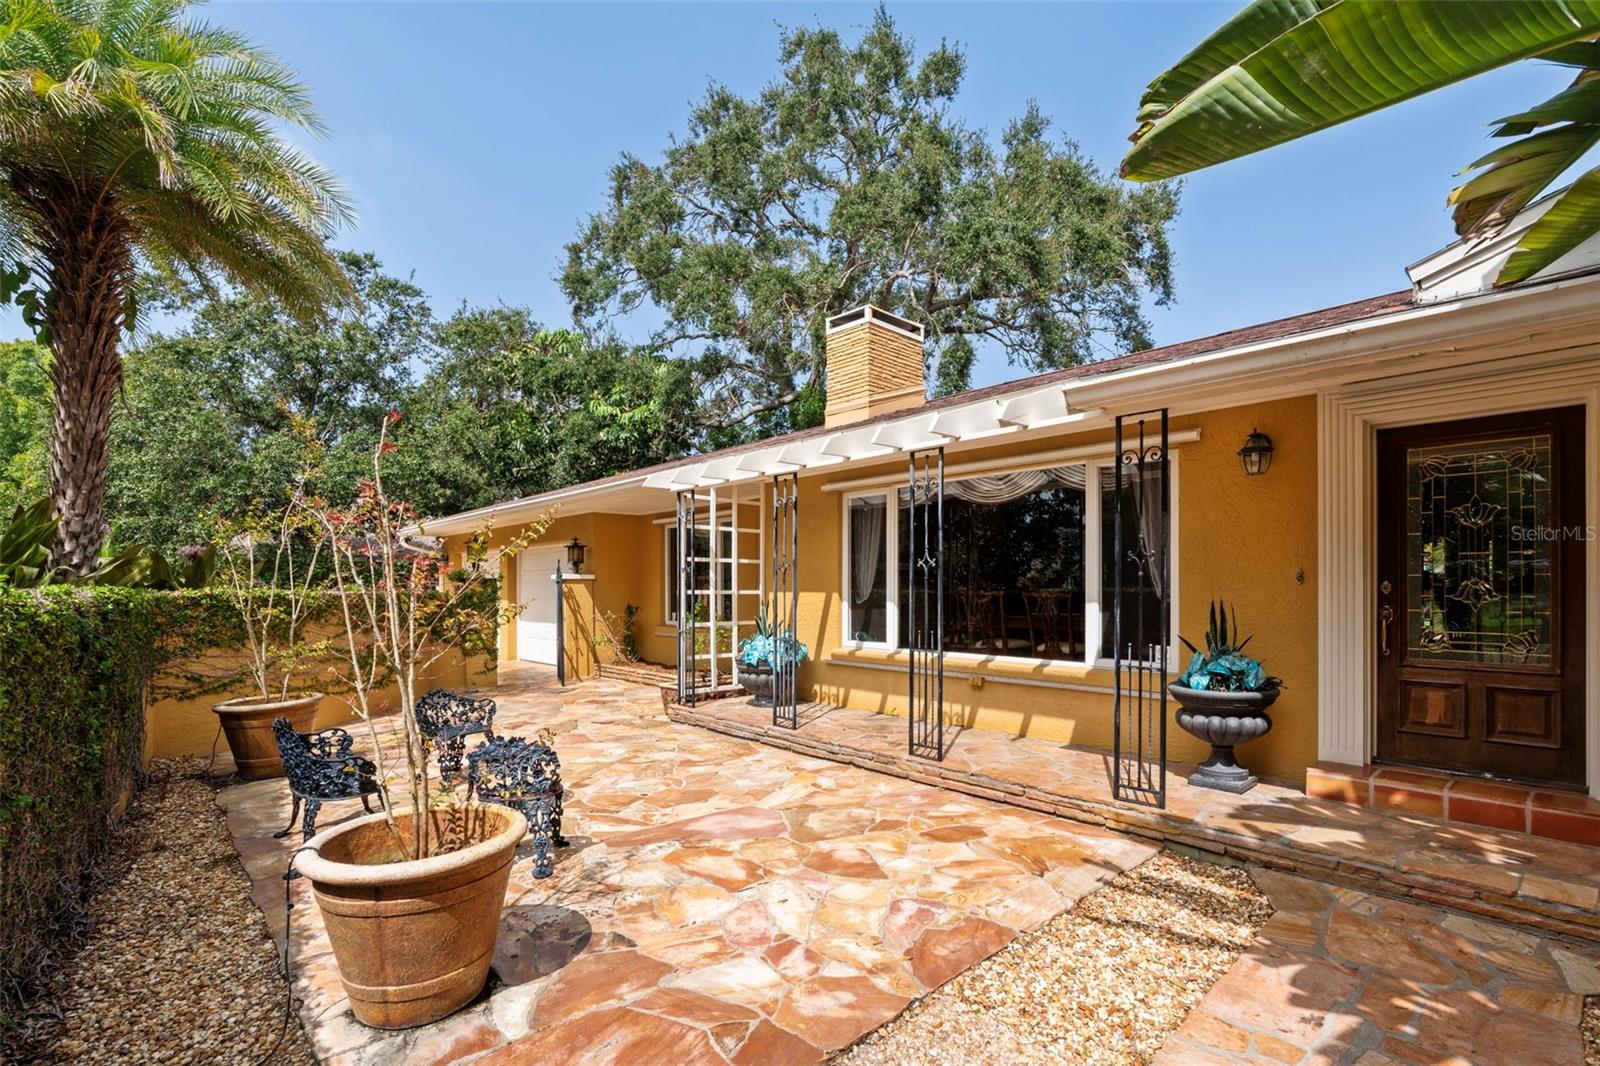
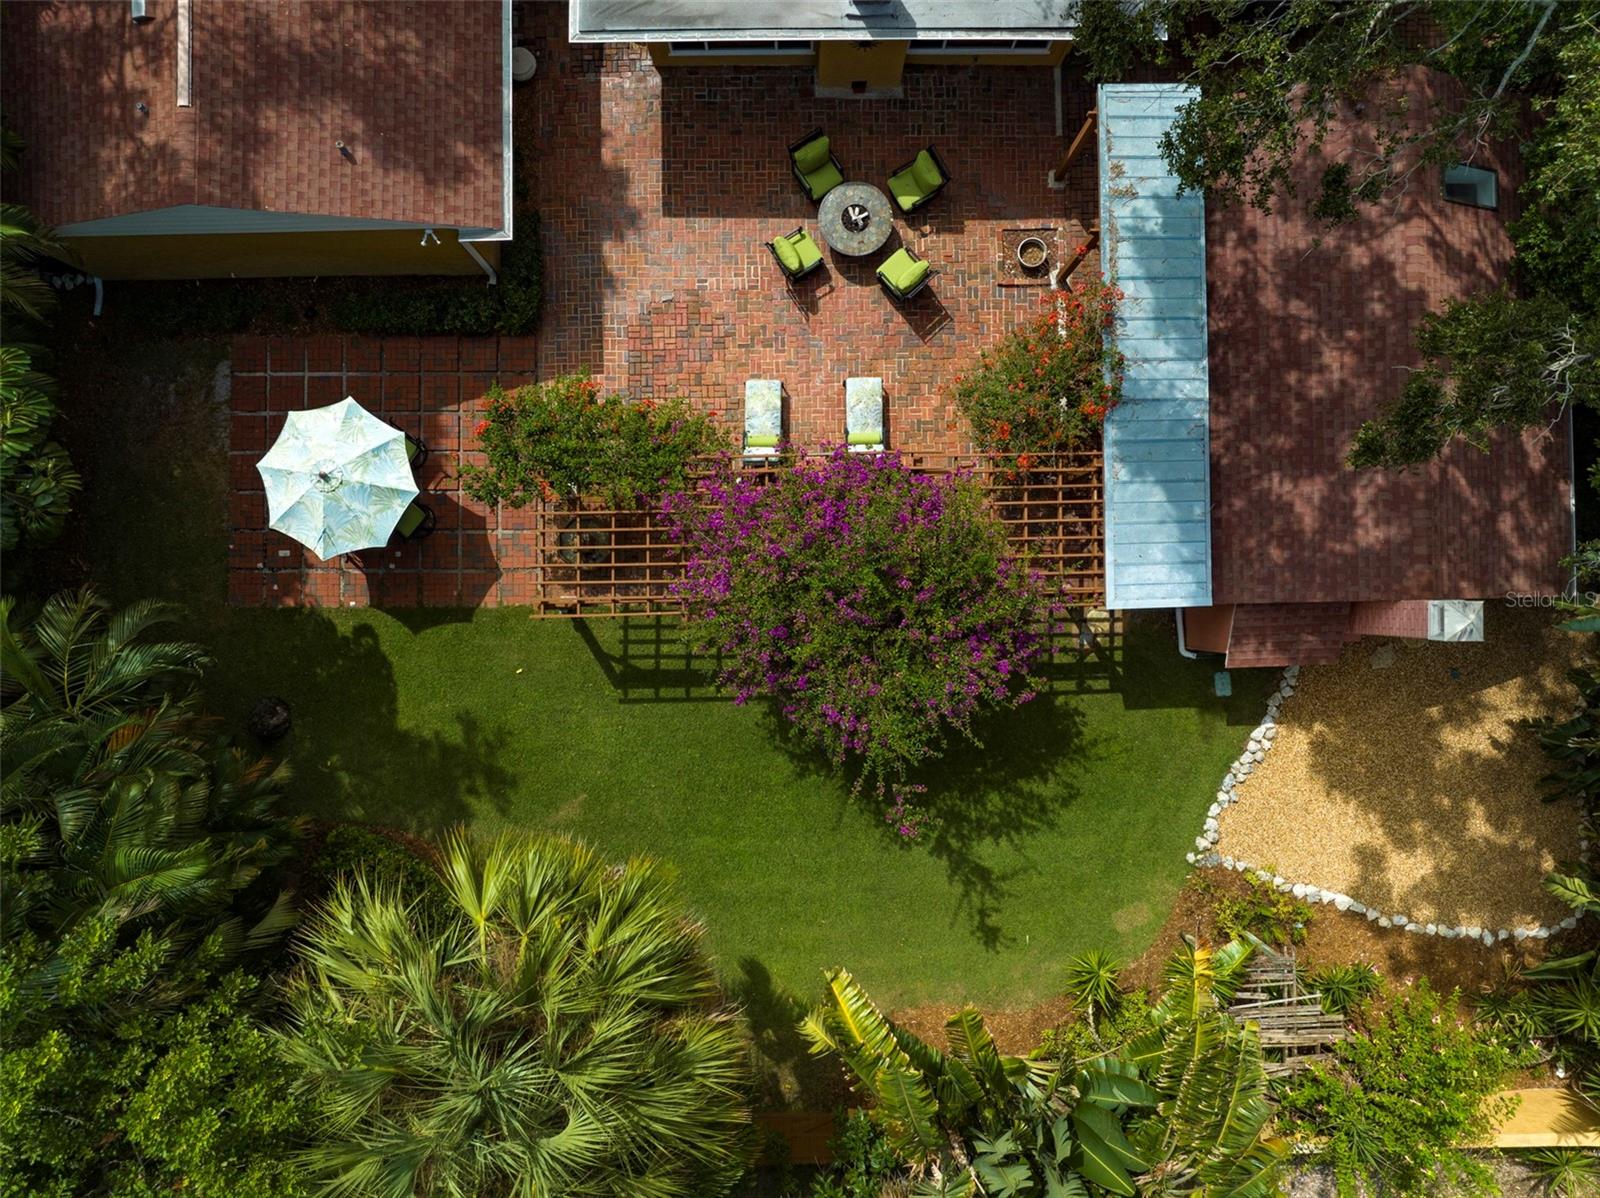
Historic Cherokee Park: This prime, “West of the Trail” property with oak-lined boulevard streets and decorative light posts is located near Southside Village. At 20 feet elevation, this property has NO HISTORY OF FLOODING. There is a low annual HOA and no CDD’s. Situated on a picturesque lot, this home with a guest house boasts privacy and tranquility; surrounded by mature landscaping that provides a serene oasis. Both the main house and guest house have brand new roofs with certified GAF 25-year warranties. The main house has three bedrooms with two and a half baths, while the guest house has one full bath and kitchenette; totaling 3,227 square feet. Entering the home through the gated flagstone courtyard, you will find the openness of the home with authentic Saltillo tile flooring. The master bath has travertine flooring, dual sinks on a granite countertop, an open travertine shower and a tub. The guest bath flooring has custom multicolor tiles; embracing the “vintage” feel. The kitchen has granite countertops with stainless steel appliances, including a French door refrigerator/freezer (2022), and combination microwave/air fryer/convection oven with a Bluetooth-communicating combination range/oven/convection oven (11/2023.) The guest house flooring is wood looking wide ceramic tile. Three wood burning fireplaces, (two in the main house and one in the guest house), have been restored and are fully functional. Ample storage space includes a large walk-in closet with built-ins in the master bedroom and four cedar closets. No need for gutter cleaning, as both houses have Leaf Filter screens that come with a lifetime warranty. The multi-zone irrigation system is controlled by an automated clock and recently converted to metered city water (5/2025) due to the original surface well going dry due to drought. In the tranquil backyard, the large brick paver patio features an arbor and a fountain. Prior to Hurricane Milton on October 9, 2024, there were cascading bougainvillea on the arbor which had to be pruned back. Along the fenced and stucco wall back yard perimeter, there were traveler’s palms and white birds of paradise that further obstructed views to surrounding properties and gave the backyard a more private, tropical feel. An additional bonus is the yard’s double gate that backs up to Harmony Lane for tree trimming and construction access. A new custom front door with glass insets and updated hardware was installed in 1/2025. The proximity of this home to downtown and the world renowned Siesta Key beaches makes it the perfect base for enjoying all that Sarasota has to offer. The holiday parties and social gatherings promote a sense of community. Don't miss the opportunity to own this exceptional property, where prime location, a spacious lot, and unparalleled privacy come together to create a truly magnificent living experience.
Build Your Team
Quickly find investor-friendly professionals who can help you succeed in real estate investing at any stage of the investing journey.


Agents
Match with investor-friendly agents who can help you find, analyze, and close your next deal


Lenders
Get the best funding…find investor-friendly lenders who specialize in your deal strategy


Property Managers
Transition to passive investing. Find a trusted property management partnership that lasts.


Tax Pros & Accountants
Taxes and financial reporting made easy—find experts to create tax savings strategies, file taxes, and more
Location
Property Details
Parking
- Description: Garage
- Details: Attached
- Garage Spaces: 2
- Spaces Total: 0
Bedroom Information
- # of Bedrooms: 4
Bathroom Information
- # of Baths (Full): 3
- # of Baths (Partial): 1
- # of Baths (Total): 4.0
Interior Features
- # of Rooms: 9
- # of Stories: 1
- Fireplace: Yes
Exterior Features
- Exterior Walls Materials: Stucco
- Foundation: Slab
- Roof Type: Gable
- Roof Material: Shingle
HOA
- Has HOA: Yes
- HOA Fee: $300/annually
Land Information
- Land Use: Residential
- Land Use Subtype: Multi-Family Dwellings (any combination 2+)
Lot Information
- Parcel ID: 2038150021
- Lot Size: 15000 sqft
Property Information
- Property Type: Single Family Residence
- Year Built: 1953
Tax Information
- Annual Tax: $12,444
Utilities
- Water & Sewer: Private, Public, Well
- Heating: Central, Electric
- Cooling: Central Air, Zoned
Location
- County: Sarasota
Listing Details
Investment Summary
- Monthly Cash Flow
- -$7,256
- Cap Rate
- 1.7%
- Cash-on-Cash Return
- -19.4%
- Debt Coverage Ratio
- 0.27
- Internal Rate of Return (5 years)
- -14.8%
Cash Flow
Net Operating Income (NOI) minus mortgage payments.
Calculation:
NOI - Mortgage Payments
Cap Rate (Market Value)
Capitalization Rate is a rate of return that compares the yearly Net Operating Income (NOI) to the market value.
Calculation:
NOI / Market Value
Cash-on-Cash Return (CoC)
Annual Cash Flow / Cash Invested
Calculation:
Annual cash flow divided by initial cash invested.
Debt Coverage Ratio (DCR)
Net Operating Income (NOI) divided by total debt payments.
Calculation:
NOI / Total Debt Payments
Internal Rate of Return (IRR)
A metric for assessing profitability over time. IRR is the discount rate at which the net present value (NPV) of all future cash flows (positive and negative) from an investment equals zero — including both periodic cash flow (such as rent) and a projected sale at the end of the holding period. It represents the expected annualized return, accounting for income, expenses, and the recovery of capital through a future sale.
Purchase Details
Purchase PriceThe price paid for the property. Purchase price:
| $1,950,000 |
|---|---|
Amount FinancedThe amount of the purchase financed through a loan. Amount financed:
| -$1,560,000 |
Down paymentThe initial payment made towards the purchase. Down payment:
| $390,000 |
Closing CostsFees and expenses associated with purchasing a property, typically ranging from 2% to 5% of the home’s purchase price, paid at the end of a home purchase to cover services like lending, title transfer, and taxes. Closing costs:
| $58,500 |
Rehab CostsCosts incurred to repair or improve the property, including: roof, flooring, exterior siding, kitchen, exterior paint, bathrooms, etc. Rehab costs:
| $0 |
Initial Cash InvestedThe total initial cash invested in the property. Calculation:Down payment + Buying costs + Rehab costs Initial cash invested:
| $448,500 |
Square Feet (SQFT)The total square footage of the property. Square feet:
| 3,227 |
Cost Per Square FootCost per square foot of the property. Calculation:Purchase Price / Square Feet Cost per square foot:
| $604 |
Monthly Rent Per Square FootMonthly rent divided by the number of square feet. This ratio helps investors compare rental income efficiency across properties, markets, and unit sizes Calculation:Monthly Rent / Square Feet Monthly rent per square foot:
| $1.70 |
Financing Details
Loan AmountThe total sum of money borrowed from a lender to finance a property purchase. Calculation:Purchase Price - Down Payment
Loan amount:
| $1,560,000 |
|---|---|
Loan to Value Ratio (LTV)Loan amount divided by the market value of the property. Calculation:Loan Amount / Market Value
Loan to value ratio:
| 80.0% |
Loan TypeThe type of loan (e.g., fixed, adjustable).
Loan type:
| Amortizing |
TermThe loan repayment period in years.
Term:
| 30 years |
Interest RateThe percentage a lender charges on the borrowed amount of a loan, determining the cost of borrowing money.
Interest rate:
| 6.625% |
Principal & Interest (PI)The principal is the portion of the loan payment that reduces the loan balance. The interest is the lender's charge for borrowing money. Calculation:(P * r * (1 + r) ** n) / ((1 + r) ** n - 1) Where:
P = Loan amount (principal)
Principal & interest:
| $9,989 |
Property TaxesAnnual taxes levied by local governments on real estate properties. These taxes fund public services like schools, roads, and emergency services.
Property tax:
| $1,037 |
InsuranceThe costs for insurance coverage to protect against financial losses due to risks like fire, natural disasters, theft, liability, or tenant-related damages. Calculation:Assumes 7% of gross rental income, unless insurance rates are specified.
Insurance:
| $385 |
Private Mortgage Insurance (PMI)A fee that borrowers pay when they take out a conventional loan with a loan-to-value (LTV) ratio above 80%.
Private mortgage insurance (PMI):
| $0 |
Monthly PaymentThe fixed amount a borrower pays each month to repay a loan. It typically includes principal and interest (P&I) and may also cover property taxes, insurance, HOA fees, and PMI if escrowed. Monthly payment:
| $11,411 |
Operating Income
| % Rent | Monthly | Yearly | |
|---|---|---|---|
Gross RentThe total rental income received from tenants before deducting any expenses. Includes base rent, late fees, pet fees, parking fees, and other recurring charges.
Gross rent:
| $5,500 | $66,000 | |
Vacancy LossExpected loss of rent due to vacancies.
Vacancy loss:
(6%)
| 6% | -$330 | -$3,960 |
Operating IncomeGross rental income minus vacancy loss. Calculation:Gross rent - Vacancy loss
Operating income:
| $5,170 | $62,040 |
Operating Expenses
| % Rent | Monthly | Yearly | |
|---|---|---|---|
Property TaxesAnnual taxes levied by local governments on real estate properties. These taxes fund public services like schools, roads, and emergency services. | 19% | -$1,037 | -$12,444 |
InsuranceThe costs for insurance coverage to protect against financial losses due to risks like fire, natural disasters, theft, liability, or tenant-related damages. Calculation:Assumes 7% of gross rental income, unless insurance rates are specified. | 7% | -$385 | -$4,620 |
Property ManagementThe costs associated with hiring a property manager to handle the day-to-day operations of a rental property. Includes management fees, leasing fes, eviction fees, etc. Calculation:Assumes 8% of gross rental income. | 8% | -$440 | -$5,280 |
Repairs & MaintenanceOngoing costs for routine upkeep and minor fixes needed to keep a property in good working condition. Calculation:Assumes 5% of gross rental income. Varies by property age and condition. | 5% | -$275 | -$3,300 |
Capital ExpensesLarge, infrequent costs for major improvements or replacements, like a new roof, HVAC system, or appliances. Calculation:Assumes 5% of gross rental income. Varies by property age. | 5% | -$275 | -$3,300 |
HOA FeesRegular dues paid to a Homeowners Association for community maintenance, amenities, and management. Similar fees include: Condo Association Fees, Co-op Maintenance Fees, etc. | 0% | -$25 | -$300 |
Operating ExpensesRecurring costs required to maintain and manage a rental property, including property taxes, insurance, maintenance, repairs, utilities (if paid by the owner), property management fees, and other day-to-day expenses. Calculation:Insurance + Property Taxes + Property Management + Repairs & Maintenance + Capital Expenditures + HOA Fees | 44% | -$2,437 | -$29,244 |
Cash Flow
| Monthly | Yearly | |
|---|---|---|
Net Operating Income (NOI)The income generated from a property after deducting all operating expenses but before deducting mortgage payments, taxes, and capital expenditures. Calculation:Gross Operating Income - Operating Expenses
Net operating income:
| $2,733 | $32,796 |
Mortgage PaymentThe fixed amount a borrower pays each month to repay a loan. It typically includes principal and interest (P&I) and may also cover property taxes, insurance, HOA fees, and PMI if escrowed. | -$9,989 | -$119,868 |
Cash FlowNet Operating Income (NOI) minus mortgage payments. Calculation:NOI - Mortgage Payments | -$7,256 | -$87,072 |