
$448,500
Investment Summary
- Monthly Cash Flow
- -$1,199
- Cap Rate
- 2.9%
- Cash-on-Cash Return
- -13.9%
- Debt Coverage Ratio
- 0.48
- Internal Rate of Return (5 years)
- -9.5%
Cash Flow
Net Operating Income (NOI) minus mortgage payments.
Calculation:
NOI - Mortgage Payments
Cap Rate (Market Value)
Capitalization Rate is a rate of return that compares the yearly Net Operating Income (NOI) to the market value.
Calculation:
NOI / Market Value
Cash-on-Cash Return (CoC)
Annual Cash Flow / Cash Invested
Calculation:
Annual cash flow divided by initial cash invested.
Debt Coverage Ratio (DCR)
Net Operating Income (NOI) divided by total debt payments.
Calculation:
NOI / Total Debt Payments
Internal Rate of Return (IRR)
A metric for assessing profitability over time. IRR is the discount rate at which the net present value (NPV) of all future cash flows (positive and negative) from an investment equals zero — including both periodic cash flow (such as rent) and a projected sale at the end of the holding period. It represents the expected annualized return, accounting for income, expenses, and the recovery of capital through a future sale.
Property Description
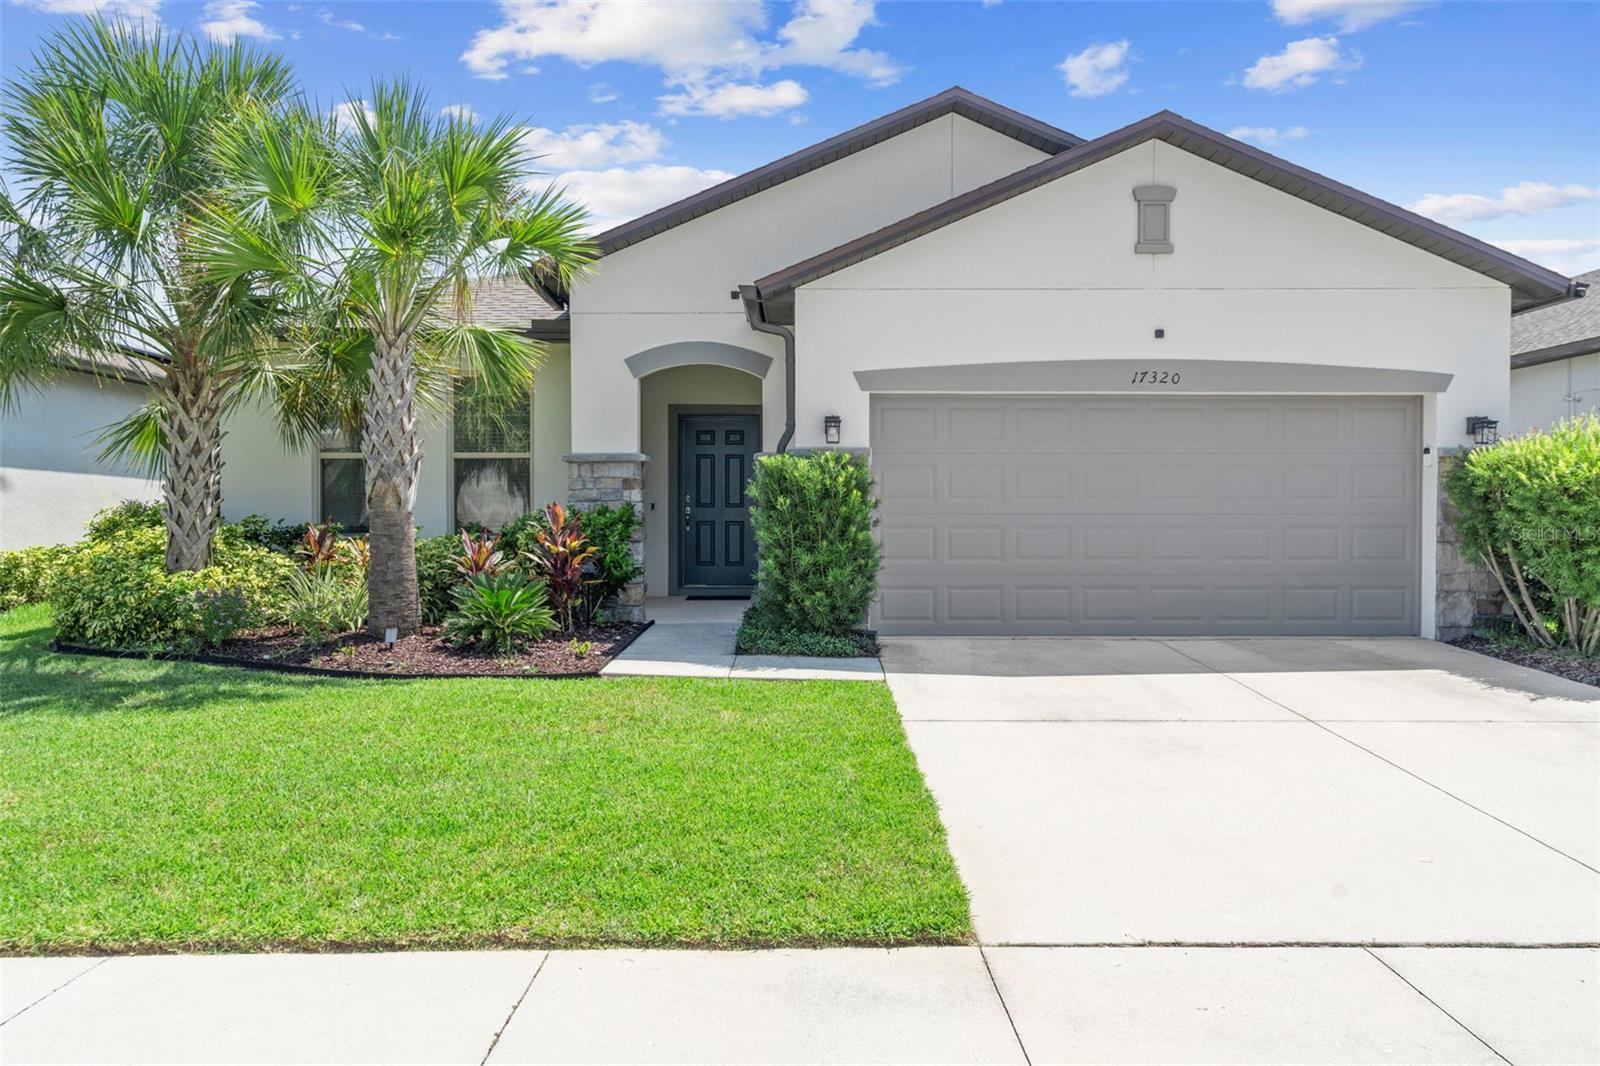
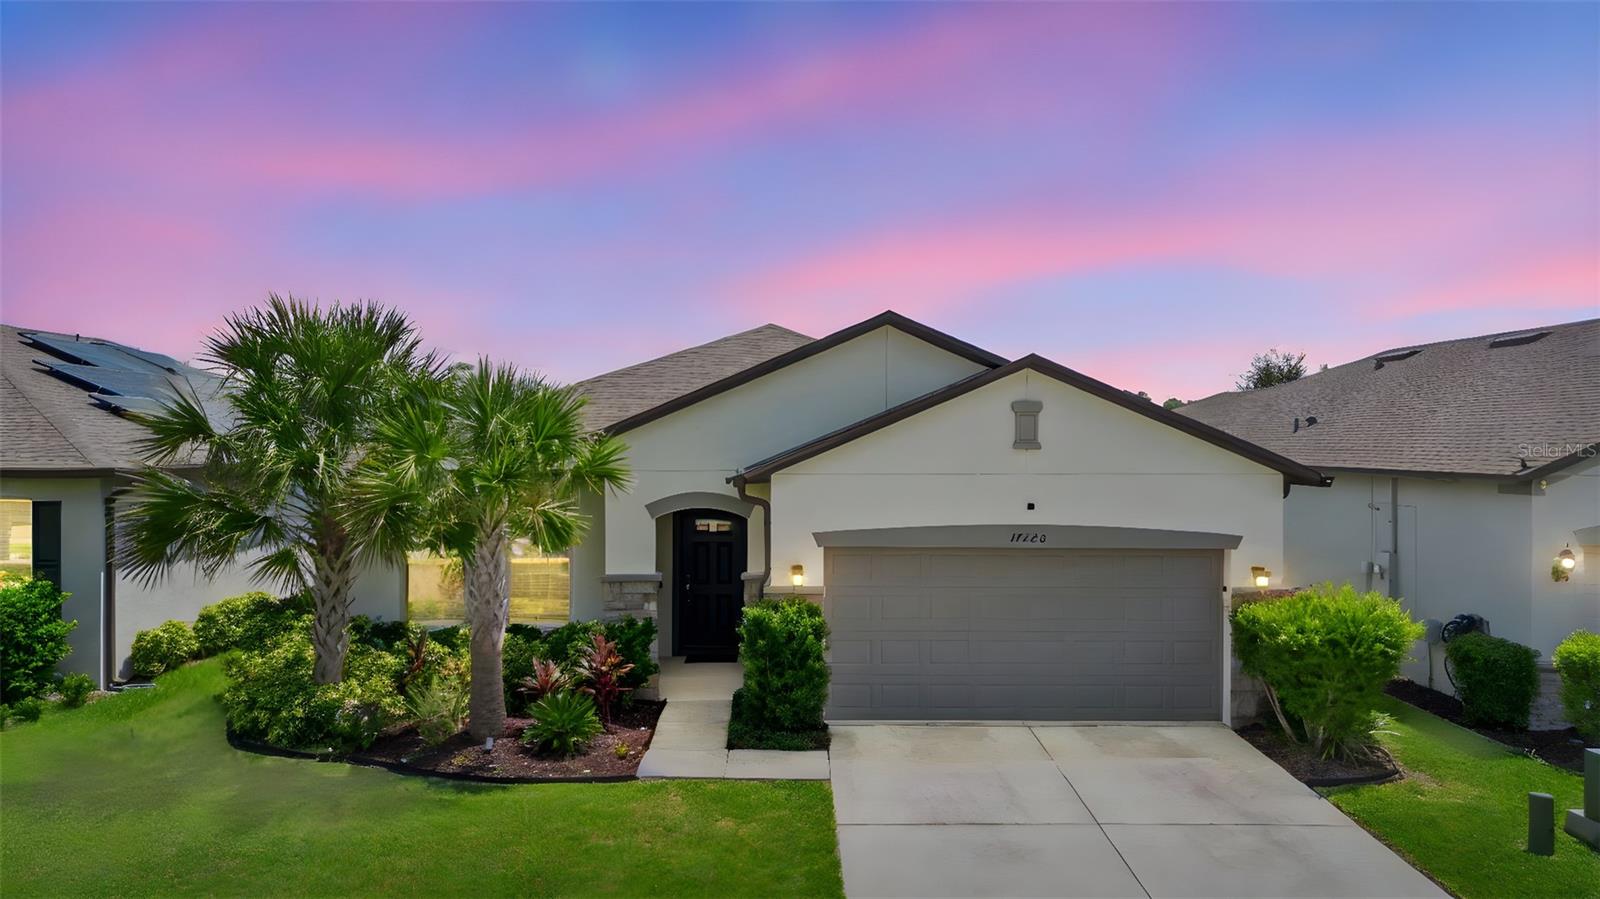
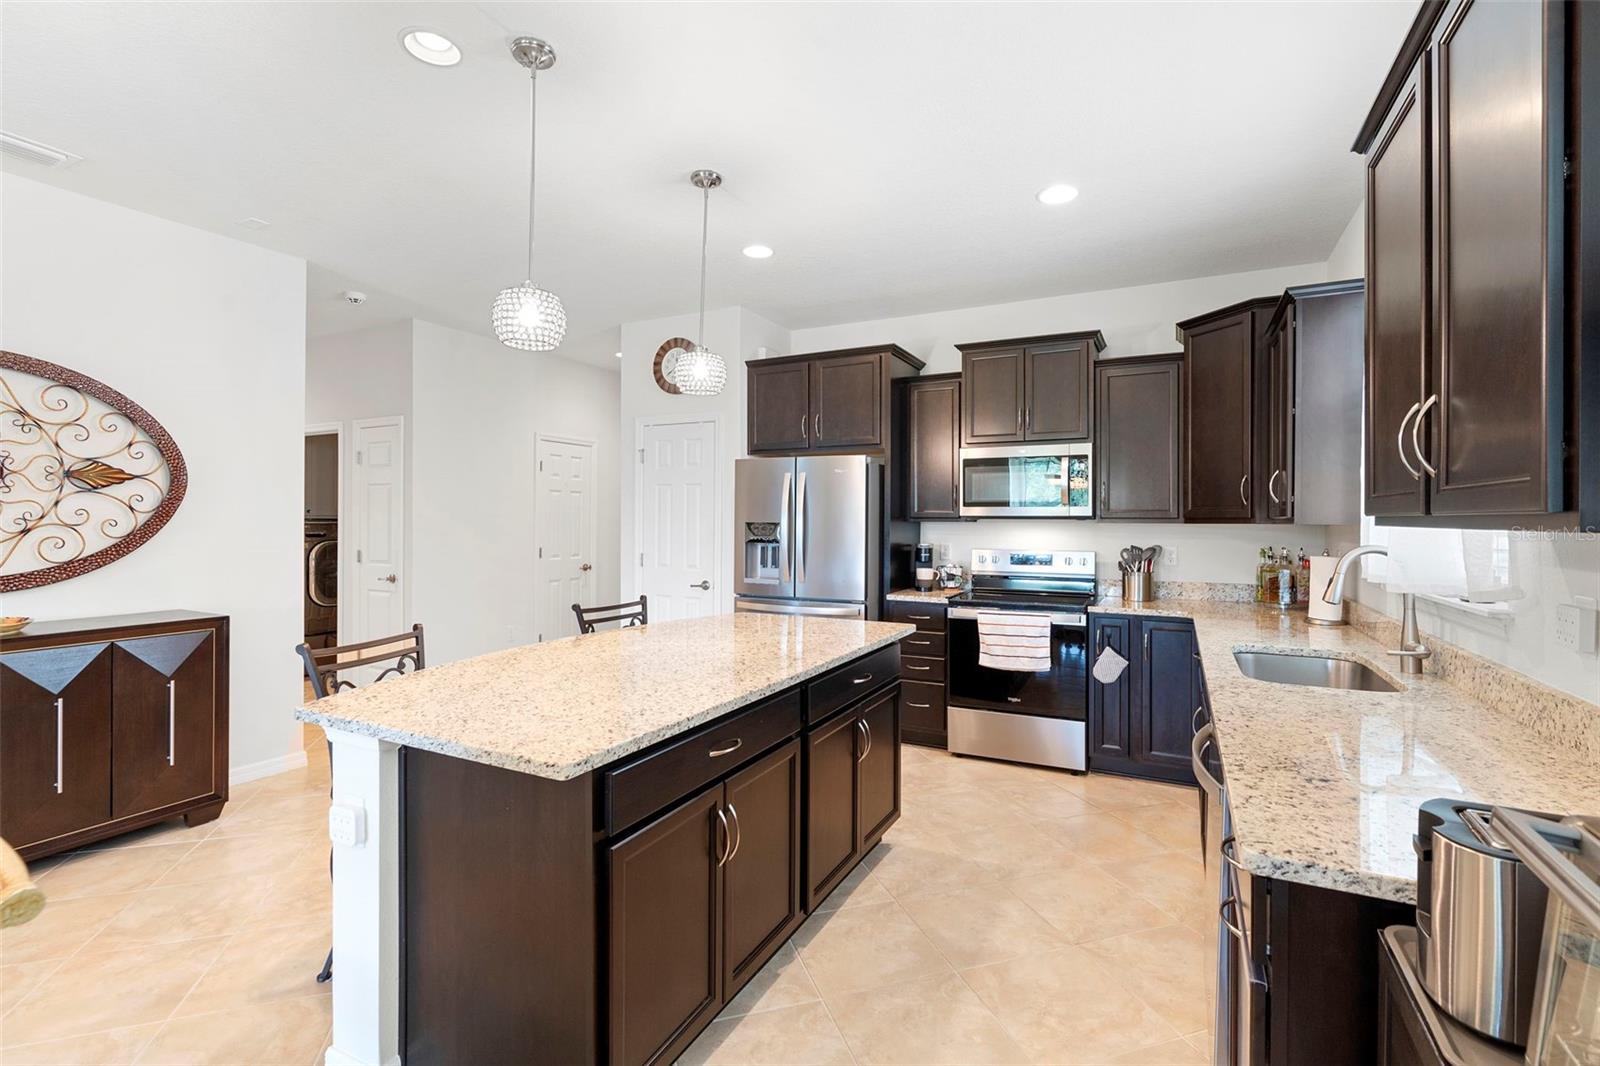
WAKE UP TO WATER VIEWS IN THIS SERENOA SHOWSTOPPER! This beautifully designed 4-BEDROOM, 3 FULL-BATH HOME offers nearly 2,000 SQUARE FEET of thoughtfully planned living space, nestled in one of CLERMONT’S MOST DESIRABLE RESORT-STYLE COMMUNITIES. From the moment you arrive, you’ll be greeted by LUSH LANDSCAPING AND ELEGANT STONE ACCENTS—just the beginning of what makes this home truly special. Step inside to a POPULAR OPEN FLOOR PLAN where you can enjoy GORGEOUS WATER VIEWS right from your living room, kitchen, and dining area. TILE FLOORING THROUGHOUT THE MAIN LIVING AREAS keeps things easy to clean and stylish, while CARPETED BEDROOMS add comfort and warmth. The spacious KITCHEN IS A DREAM, featuring 42” CABINETS WITH PULL-OUTS, a LAZY SUSAN, GRANITE COUNTERTOPS, a WATER FILTRATION SYSTEM, a LARGE ISLAND with STYLISH PENDANT LIGHTS—perfect for entertaining or casual family meals. The 4TH BEDROOM is ideal for guests or multi-generational living, offering LARGE WINDOWS THAT BRING IN BEAUTIFUL NATURAL LIGHT, along with a PRIVATE ENSUITE BATH for added privacy and comfort. The PRIMARY SUITE is a peaceful retreat with a BEAUTIFUL CEILING FAN, a LARGE WALK-IN CLOSET, and a PRIMARY BATHROOM featuring a TILED SHOWER AND DOUBLE VANITY. Plus, enjoy TRANQUIL WATER VIEWS RIGHT FROM YOUR BEDROOM WINDOW—a perfect way to start and end each day. The LAUNDRY ROOM is thoughtfully upgraded with CABINET STORAGE, a DOUBLE WASHER PERFECT FOR BOTH SMALL AND LARGE LOADS, and a UTILITY SINK. Step outside to your SCREENED-IN PATIO WITH A CEILING FAN, where you’ll love starting your day with GORGEOUS SUNRISES OVER THE WATER—a peaceful space to relax and take in the natural beauty. If you’ve been dreaming about having your own pool, this backyard has plenty of space to make it happen. Additional features include a 2-CAR GARAGE WITH A 220V ELECTRIC CAR CHARGER, a WHOLE-HOME WATER SOFTENER, GUTTERS ALREADY INSTALLED FOR ADDED HOME AND LANDSCAPE PROTECTION, and a ROOF THAT’S ONLY 2 YEARS OLD, along with THOUGHTFUL TOUCHES THROUGHOUT. Beyond the home, CLERMONT OFFERS A LIFESTYLE UNLIKE ANYWHERE ELSE IN CENTRAL FLORIDA—RICH WITH ROLLING HILLS, SCENIC LAKES, WALKING AND BIKING TRAILS, OUTDOOR ADVENTURES, CHAMPIONSHIP GOLF, SHOPPING, DINING, AND LOCAL ENTERTAINMENT. It’s no wonder Clermont has been named one of the TOP 15 LAKE TOWNS IN AMERICA and recognized by Southern Living as one of the BEST PLACES TO RETIRE. And exciting news—SAWGRASS BAY BLVD IS OPENING SOON JUST 1.1 MILES AWAY, making your drive to DISNEY FASTER THAN EVER and placing you just moments from WINTER GARDEN, major stores, restaurants, and more. All of this is located in SERENOA, a community packed with amazing amenities including a RESORT-STYLE ZERO-ENTRY POOL, SPLASH PARK, CLUBHOUSE, FITNESS CENTER, WALKING TRAILS, AND A DOG PARK. It’s an ACTIVE NEIGHBORHOOD perfect for all lifestyles. If you're searching for your FOREVER HOME, this home delivers VALUE, COMFORT, AND VIEWS YOU’LL LOVE COMING HOME TO.
Build Your Team
Quickly find investor-friendly professionals who can help you succeed in real estate investing at any stage of the investing journey.


Agents
Match with investor-friendly agents who can help you find, analyze, and close your next deal


Lenders
Get the best funding…find investor-friendly lenders who specialize in your deal strategy


Property Managers
Transition to passive investing. Find a trusted property management partnership that lasts.


Tax Pros & Accountants
Taxes and financial reporting made easy—find experts to create tax savings strategies, file taxes, and more
Location
Property Details
Parking
- Description: Finished
- Details: Driveway, Garage Door Opener, Attached
- Garage Spaces: 2
- Spaces Total: 0
Bedroom Information
- # of Bedrooms: 4
Bathroom Information
- # of Baths (Full): 3
- # of Baths (Total): 3.0
Interior Features
- # of Rooms: 8
- # of Stories: 1
Exterior Features
- Exterior Walls Materials: Brick Veneer
- Foundation: Slab
- Roof Material: Shingle
HOA
- Has HOA: Yes
- Association: FS Residential David Landry
- HOA Fee: $123/monthly
Land Information
- Land Use: Residential
- Land Use Subtype: Single Family Residential
Lot Information
- Parcel ID: 132426010000033600
- Lot Size: 6249 sqft
Property Information
- Property Type: Single Family Residence
- Style: Florida
- Year Built: 2018
Tax Information
- Annual Tax: $6,051
Utilities
- Water & Sewer: Public
- Heating: Central, Electric
- Cooling: Central Air
Location
- County: Lake
Listing Details
Investment Summary
- Monthly Cash Flow
- -$1,199
- Cap Rate
- 2.9%
- Cash-on-Cash Return
- -13.9%
- Debt Coverage Ratio
- 0.48
- Internal Rate of Return (5 years)
- -9.5%
Cash Flow
Net Operating Income (NOI) minus mortgage payments.
Calculation:
NOI - Mortgage Payments
Cap Rate (Market Value)
Capitalization Rate is a rate of return that compares the yearly Net Operating Income (NOI) to the market value.
Calculation:
NOI / Market Value
Cash-on-Cash Return (CoC)
Annual Cash Flow / Cash Invested
Calculation:
Annual cash flow divided by initial cash invested.
Debt Coverage Ratio (DCR)
Net Operating Income (NOI) divided by total debt payments.
Calculation:
NOI / Total Debt Payments
Internal Rate of Return (IRR)
A metric for assessing profitability over time. IRR is the discount rate at which the net present value (NPV) of all future cash flows (positive and negative) from an investment equals zero — including both periodic cash flow (such as rent) and a projected sale at the end of the holding period. It represents the expected annualized return, accounting for income, expenses, and the recovery of capital through a future sale.
Purchase Details
Purchase PriceThe price paid for the property. Purchase price:
| $448,500 |
|---|---|
Amount FinancedThe amount of the purchase financed through a loan. Amount financed:
| -$358,800 |
Down paymentThe initial payment made towards the purchase. Down payment:
| $89,700 |
Closing CostsFees and expenses associated with purchasing a property, typically ranging from 2% to 5% of the home’s purchase price, paid at the end of a home purchase to cover services like lending, title transfer, and taxes. Closing costs:
| $13,455 |
Rehab CostsCosts incurred to repair or improve the property, including: roof, flooring, exterior siding, kitchen, exterior paint, bathrooms, etc. Rehab costs:
| $0 |
Initial Cash InvestedThe total initial cash invested in the property. Calculation:Down payment + Buying costs + Rehab costs Initial cash invested:
| $103,155 |
Square Feet (SQFT)The total square footage of the property. Square feet:
| 1,990 |
Cost Per Square FootCost per square foot of the property. Calculation:Purchase Price / Square Feet Cost per square foot:
| $225 |
Monthly Rent Per Square FootMonthly rent divided by the number of square feet. This ratio helps investors compare rental income efficiency across properties, markets, and unit sizes Calculation:Monthly Rent / Square Feet Monthly rent per square foot:
| $1.26 |
Financing Details
Loan AmountThe total sum of money borrowed from a lender to finance a property purchase. Calculation:Purchase Price - Down Payment
Loan amount:
| $358,800 |
|---|---|
Loan to Value Ratio (LTV)Loan amount divided by the market value of the property. Calculation:Loan Amount / Market Value
Loan to value ratio:
| 80.0% |
Loan TypeThe type of loan (e.g., fixed, adjustable).
Loan type:
| Amortizing |
TermThe loan repayment period in years.
Term:
| 30 years |
Interest RateThe percentage a lender charges on the borrowed amount of a loan, determining the cost of borrowing money.
Interest rate:
| 6.625% |
Principal & Interest (PI)The principal is the portion of the loan payment that reduces the loan balance. The interest is the lender's charge for borrowing money. Calculation:(P * r * (1 + r) ** n) / ((1 + r) ** n - 1) Where:
P = Loan amount (principal)
Principal & interest:
| $2,297 |
Property TaxesAnnual taxes levied by local governments on real estate properties. These taxes fund public services like schools, roads, and emergency services.
Property tax:
| $504 |
InsuranceThe costs for insurance coverage to protect against financial losses due to risks like fire, natural disasters, theft, liability, or tenant-related damages. Calculation:Assumes 7% of gross rental income, unless insurance rates are specified.
Insurance:
| $175 |
Private Mortgage Insurance (PMI)A fee that borrowers pay when they take out a conventional loan with a loan-to-value (LTV) ratio above 80%.
Private mortgage insurance (PMI):
| $0 |
Monthly PaymentThe fixed amount a borrower pays each month to repay a loan. It typically includes principal and interest (P&I) and may also cover property taxes, insurance, HOA fees, and PMI if escrowed. Monthly payment:
| $2,976 |
Operating Income
| % Rent | Monthly | Yearly | |
|---|---|---|---|
Gross RentThe total rental income received from tenants before deducting any expenses. Includes base rent, late fees, pet fees, parking fees, and other recurring charges.
Gross rent:
| $2,500 | $30,000 | |
Vacancy LossExpected loss of rent due to vacancies.
Vacancy loss:
(6%)
| 6% | -$150 | -$1,800 |
Operating IncomeGross rental income minus vacancy loss. Calculation:Gross rent - Vacancy loss
Operating income:
| $2,350 | $28,200 |
Operating Expenses
| % Rent | Monthly | Yearly | |
|---|---|---|---|
Property TaxesAnnual taxes levied by local governments on real estate properties. These taxes fund public services like schools, roads, and emergency services. | 20% | -$504 | -$6,051 |
InsuranceThe costs for insurance coverage to protect against financial losses due to risks like fire, natural disasters, theft, liability, or tenant-related damages. Calculation:Assumes 7% of gross rental income, unless insurance rates are specified. | 7% | -$175 | -$2,100 |
Property ManagementThe costs associated with hiring a property manager to handle the day-to-day operations of a rental property. Includes management fees, leasing fes, eviction fees, etc. Calculation:Assumes 8% of gross rental income. | 8% | -$200 | -$2,400 |
Repairs & MaintenanceOngoing costs for routine upkeep and minor fixes needed to keep a property in good working condition. Calculation:Assumes 5% of gross rental income. Varies by property age and condition. | 5% | -$125 | -$1,500 |
Capital ExpensesLarge, infrequent costs for major improvements or replacements, like a new roof, HVAC system, or appliances. Calculation:Assumes 5% of gross rental income. Varies by property age. | 5% | -$125 | -$1,500 |
HOA FeesRegular dues paid to a Homeowners Association for community maintenance, amenities, and management. Similar fees include: Condo Association Fees, Co-op Maintenance Fees, etc. | 5% | -$123 | -$1,476 |
Operating ExpensesRecurring costs required to maintain and manage a rental property, including property taxes, insurance, maintenance, repairs, utilities (if paid by the owner), property management fees, and other day-to-day expenses. Calculation:Insurance + Property Taxes + Property Management + Repairs & Maintenance + Capital Expenditures + HOA Fees | 50% | -$1,252 | -$15,027 |
Cash Flow
| Monthly | Yearly | |
|---|---|---|
Net Operating Income (NOI)The income generated from a property after deducting all operating expenses but before deducting mortgage payments, taxes, and capital expenditures. Calculation:Gross Operating Income - Operating Expenses
Net operating income:
| $1,098 | $13,176 |
Mortgage PaymentThe fixed amount a borrower pays each month to repay a loan. It typically includes principal and interest (P&I) and may also cover property taxes, insurance, HOA fees, and PMI if escrowed. | -$2,297 | -$27,564 |
Cash FlowNet Operating Income (NOI) minus mortgage payments. Calculation:NOI - Mortgage Payments | -$1,199 | -$14,388 |