$589,000
Investment Summary
We noticed that HOA fees are missing—this is a standard expense and should be considered in your estimate.
- Monthly Cash Flow
- -$1,118
- Cap Rate
- 3.9%
- Cash-on-Cash Return
- -9.9%
- Debt Coverage Ratio
- 0.63
- Internal Rate of Return (5 years)
- -5.6%
Cash Flow
Net Operating Income (NOI) minus mortgage payments.
Calculation:
NOI - Mortgage Payments
Cap Rate (Market Value)
Capitalization Rate is a rate of return that compares the yearly Net Operating Income (NOI) to the market value.
Calculation:
NOI / Market Value
Cash-on-Cash Return (CoC)
Annual Cash Flow / Cash Invested
Calculation:
Annual cash flow divided by initial cash invested.
Debt Coverage Ratio (DCR)
Net Operating Income (NOI) divided by total debt payments.
Calculation:
NOI / Total Debt Payments
Internal Rate of Return (IRR)
A metric for assessing profitability over time. IRR is the discount rate at which the net present value (NPV) of all future cash flows (positive and negative) from an investment equals zero — including both periodic cash flow (such as rent) and a projected sale at the end of the holding period. It represents the expected annualized return, accounting for income, expenses, and the recovery of capital through a future sale.
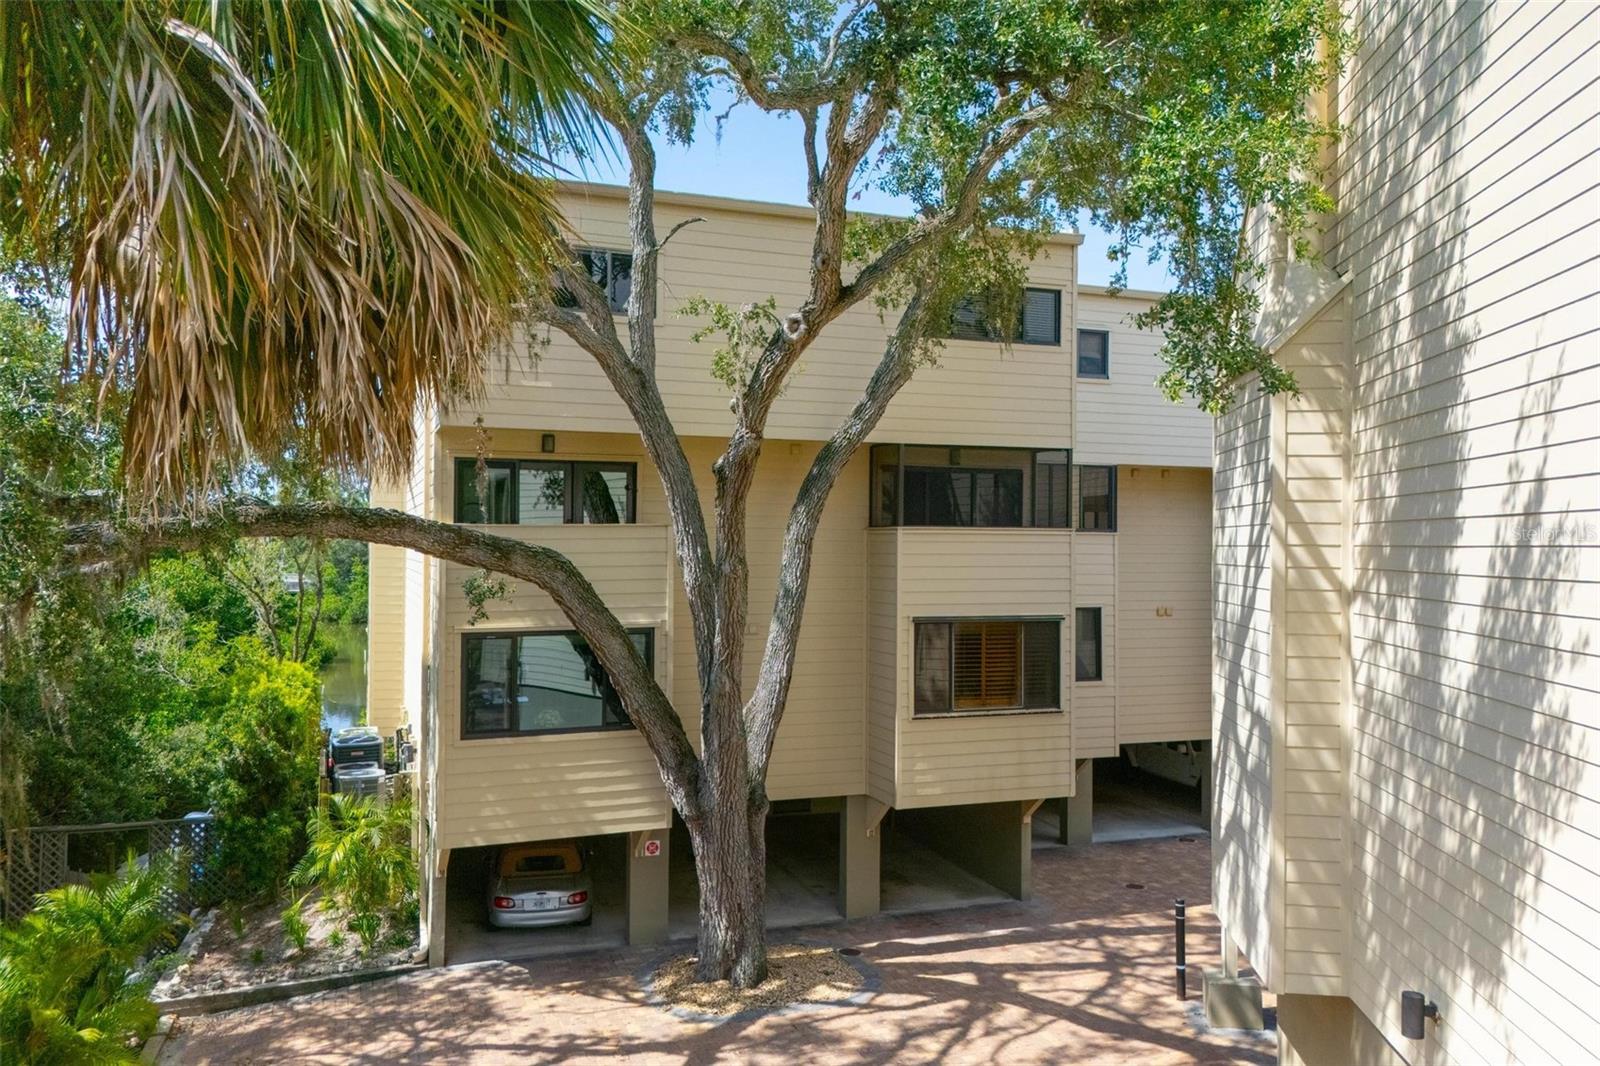
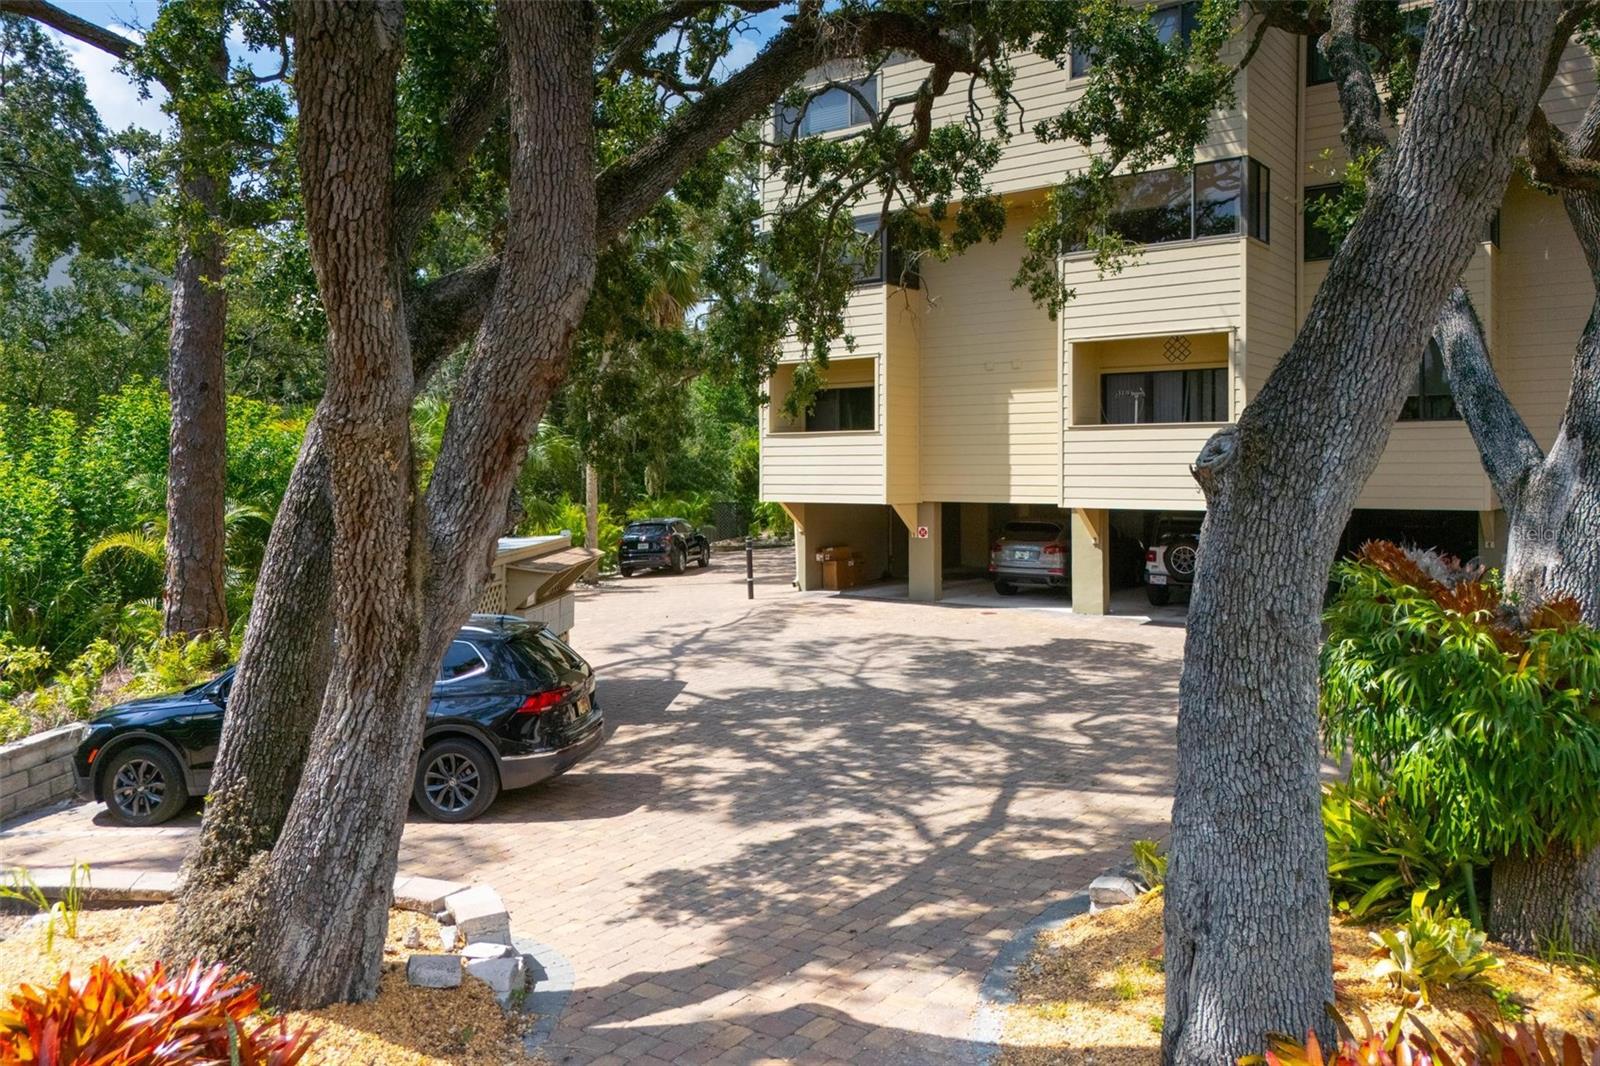
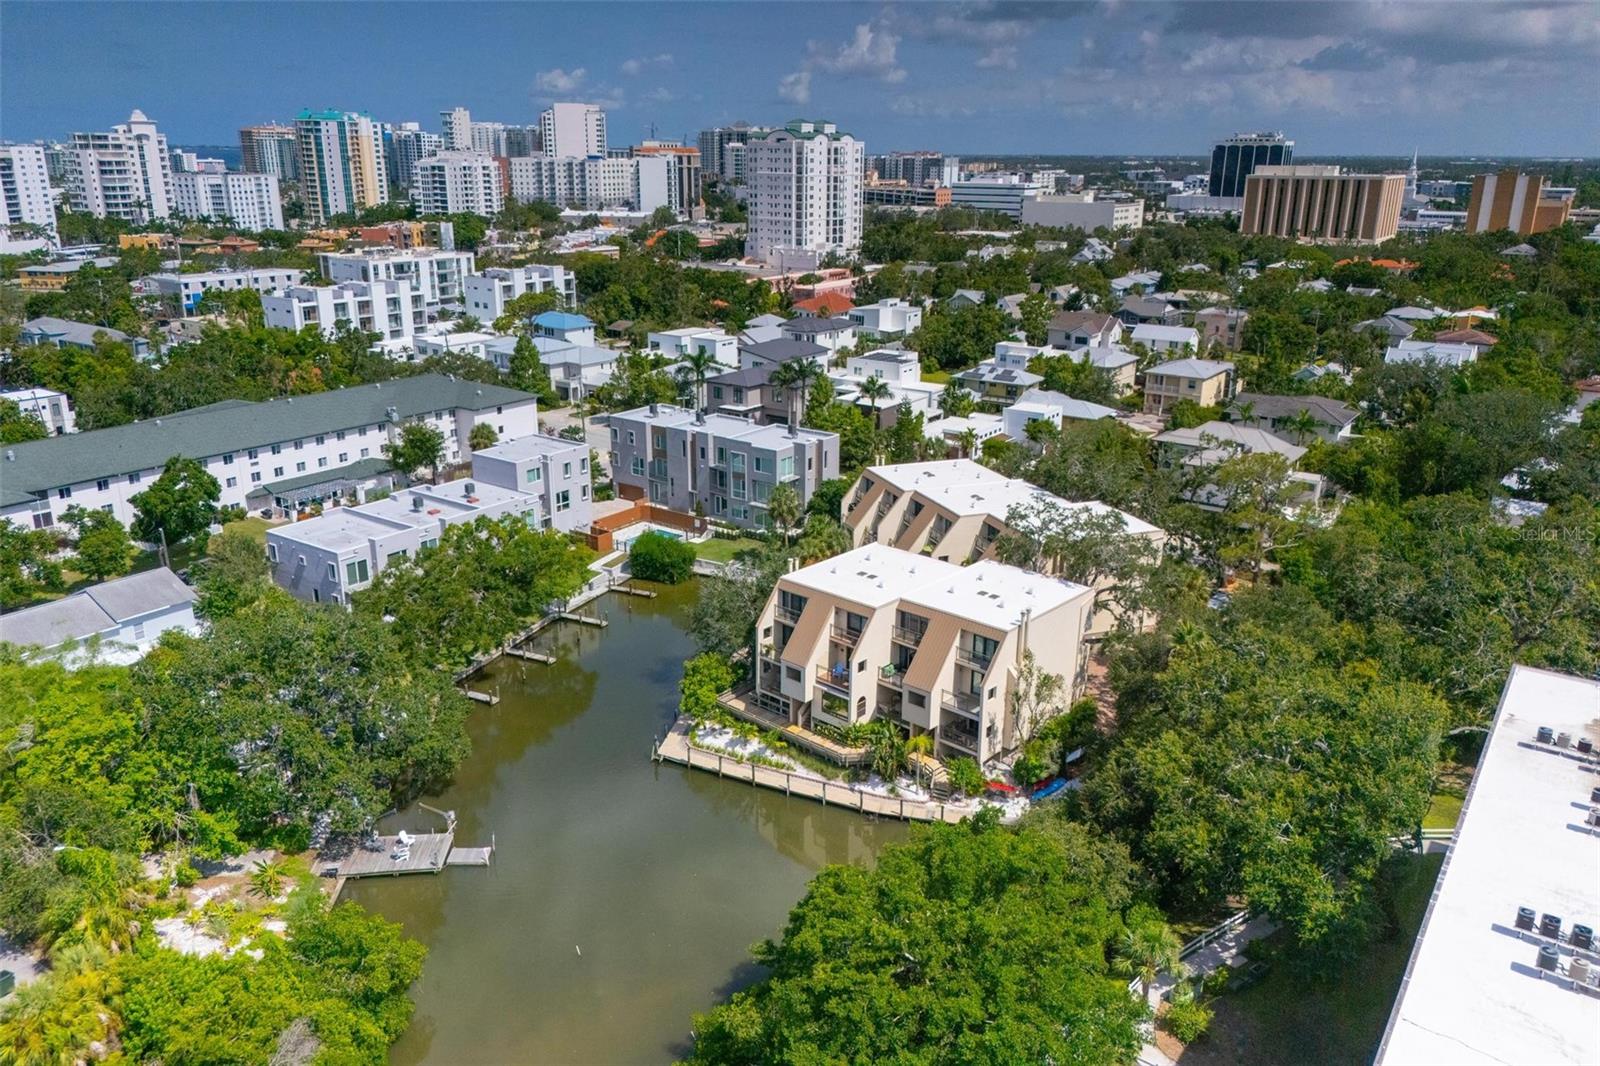
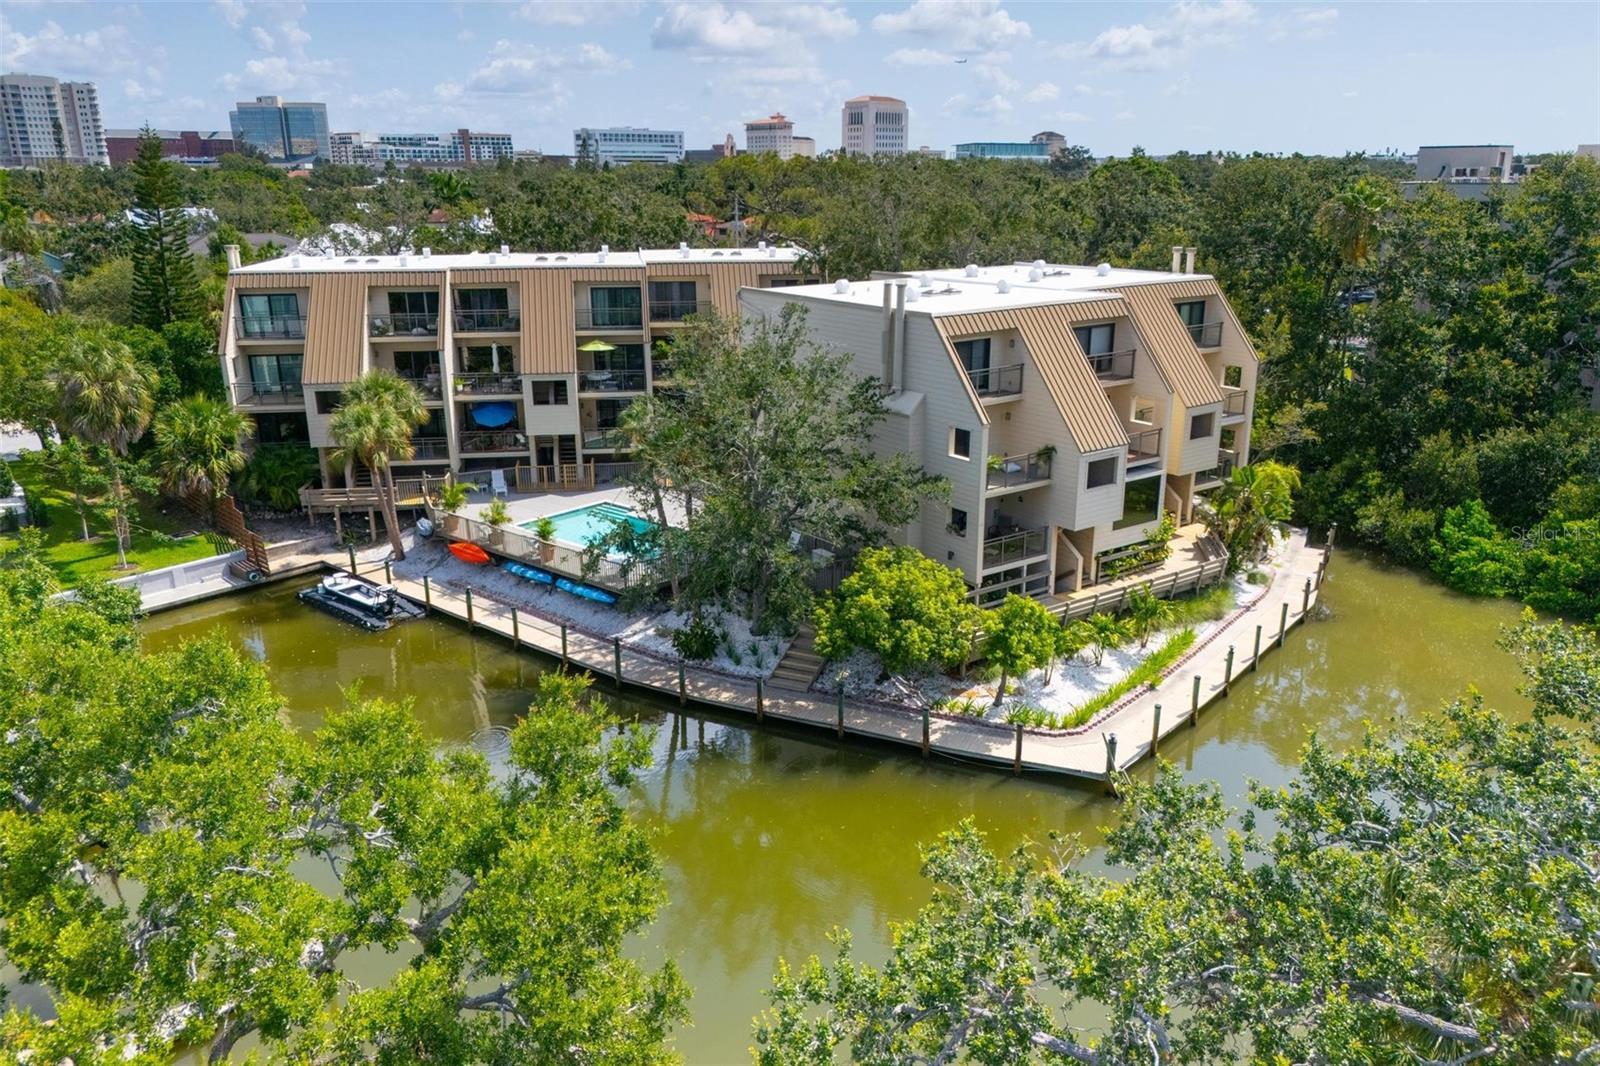
Property Description
Hudson Oaks offers true waterfront living in the heart of downtown Sarasota, set in a lush and tranquil setting with water views and boating access. This beautifully updated 2-bedroom, 2-bath, two-story condo is part of a hidden gem community tucked between historic Laurel Park and vibrant Burns Court. You’re just minutes from Sarasota’s top restaurants, boutique shops, Selby Gardens, the Bayfront, and a short ride to Lido Beach and St. Armands Circle. Hudson Oaks offers a blend of waterfront serenity and downtown convenience. Residents enjoy access to private boat docks, a kayak launch, swimming pool, grilling area, and a pedestrian bridge that connects directly to Laurel Park. The Hudson Bayou is a protected waterway with small boat access to Sarasota Bay—ideal for kayaking, paddleboarding, or simply taking in the views. Inside, the home features a split-bedroom layout with both bedrooms located upstairs for privacy. The primary suite includes a walk-in closet and a private covered balcony with beautiful views of the water. The en-suite bathroom has been tastefully renovated with an upgraded vanity and a walk-in tiled shower with a glass door. The second bedroom is also spacious and filled with natural light. A fully updated guest bathroom with a modern vanity and tiled walk-in shower completes the upper level. Downstairs, the open-concept living and dining areas are bright and airy, with large sliding glass doors leading to a balcony that overlooks the bayou—perfect for relaxing or entertaining. The updated kitchen features granite countertops, pull-out shelving, stainless steel appliances, a subway tile backsplash, and a pantry closet. A large center island offers additional prep space and room for casual seating. The layout is open to the living area and offers direct access to the fully screened-in balcony off the kitchen with a peaceful view of the pool, offering a separate outdoor space to enjoy. Recent upgrades include a new roof (2020), kitchen renovation (January 2025), and refreshed bathrooms with new vanities, sinks, faucets, and toilets. All windows and sliding doors come with clear hurricane panels, which are included in the sale. This condo also comes with the largest storage room in the building—perfect for bikes, beach gear, or seasonal items—and a covered carport with an EV hookup, exclusive to this unit in Building B. A floating dock is also included with the purchase. The HOA is financially strong and fully compliant with Florida’s updated SIRS (Structural Integrity Reserve Study) requirements, with a licensed reserve study specialist having completed the analysis. Schedule your private showing today and experience this rare opportunity for waterfront living in downtown Sarasota.
Build Your Team
Quickly find investor-friendly professionals who can help you succeed in real estate investing at any stage of the investing journey.


Agents
Match with investor-friendly agents who can help you find, analyze, and close your next deal


Lenders
Get the best funding…find investor-friendly lenders who specialize in your deal strategy


Property Managers
Transition to passive investing. Find a trusted property management partnership that lasts.


Tax Pros & Accountants
Taxes and financial reporting made easy—find experts to create tax savings strategies, file taxes, and more
Location
Property Details
Parking
- Description: Assigned, Covered, Guest, Off Street, Under Building
- Details: Assigned, Covered, Guest, Off Street, Basement
- Garage Spaces: 0
- Spaces Total: 0
Bedroom Information
- # of Bedrooms: 2
Bathroom Information
- # of Baths (Full): 2
- # of Baths (Total): 3.0
Interior Features
- # of Rooms: 7
- # of Stories: 2
Exterior Features
- Exterior Walls Materials: Wood Siding
- Roof Type: Flat
- Roof Material: Shingle
- Pool Community: Yes
HOA
- Association: Polaris Property Mgmt
Land Information
- Land Use: Residential
- Land Use Subtype: Condominium Unit
Lot Information
- Parcel ID: 2036023012
- Lot Size: 0 sqft
Property Information
- Property Type: Condominium
- Year Built: 1984
Tax Information
- Annual Tax: $3,702
Utilities
- Water & Sewer: Public
- Heating: Central, Electric
- Cooling: Central Air
Location
- County: Sarasota
Listing Details
Investment Summary
We noticed that HOA fees are missing—this is a standard expense and should be considered in your estimate.
- Monthly Cash Flow
- -$1,118
- Cap Rate
- 3.9%
- Cash-on-Cash Return
- -9.9%
- Debt Coverage Ratio
- 0.63
- Internal Rate of Return (5 years)
- -5.6%
Cash Flow
Net Operating Income (NOI) minus mortgage payments.
Calculation:
NOI - Mortgage Payments
Cap Rate (Market Value)
Capitalization Rate is a rate of return that compares the yearly Net Operating Income (NOI) to the market value.
Calculation:
NOI / Market Value
Cash-on-Cash Return (CoC)
Annual Cash Flow / Cash Invested
Calculation:
Annual cash flow divided by initial cash invested.
Debt Coverage Ratio (DCR)
Net Operating Income (NOI) divided by total debt payments.
Calculation:
NOI / Total Debt Payments
Internal Rate of Return (IRR)
A metric for assessing profitability over time. IRR is the discount rate at which the net present value (NPV) of all future cash flows (positive and negative) from an investment equals zero — including both periodic cash flow (such as rent) and a projected sale at the end of the holding period. It represents the expected annualized return, accounting for income, expenses, and the recovery of capital through a future sale.
Purchase Details
Purchase PriceThe price paid for the property. Purchase price:
| $589,000 |
|---|---|
Amount FinancedThe amount of the purchase financed through a loan. Amount financed:
| -$471,200 |
Down paymentThe initial payment made towards the purchase. Down payment:
| $117,800 |
Closing CostsFees and expenses associated with purchasing a property, typically ranging from 2% to 5% of the home’s purchase price, paid at the end of a home purchase to cover services like lending, title transfer, and taxes. Closing costs:
| $17,670 |
Rehab CostsCosts incurred to repair or improve the property, including: roof, flooring, exterior siding, kitchen, exterior paint, bathrooms, etc. Rehab costs:
| $0 |
Initial Cash InvestedThe total initial cash invested in the property. Calculation:Down payment + Buying costs + Rehab costs Initial cash invested:
| $135,470 |
Square Feet (SQFT)The total square footage of the property. Square feet:
| 1,264 |
Cost Per Square FootCost per square foot of the property. Calculation:Purchase Price / Square Feet Cost per square foot:
| $466 |
Monthly Rent Per Square FootMonthly rent divided by the number of square feet. This ratio helps investors compare rental income efficiency across properties, markets, and unit sizes Calculation:Monthly Rent / Square Feet Monthly rent per square foot:
| $2.53 |
Financing Details
Loan AmountThe total sum of money borrowed from a lender to finance a property purchase. Calculation:Purchase Price - Down Payment
Loan amount:
| $471,200 |
|---|---|
Loan to Value Ratio (LTV)Loan amount divided by the market value of the property. Calculation:Loan Amount / Market Value
Loan to value ratio:
| 80.0% |
Loan TypeThe type of loan (e.g., fixed, adjustable).
Loan type:
| Amortizing |
TermThe loan repayment period in years.
Term:
| 30 years |
Interest RateThe percentage a lender charges on the borrowed amount of a loan, determining the cost of borrowing money.
Interest rate:
| 6.625% |
Principal & Interest (PI)The principal is the portion of the loan payment that reduces the loan balance. The interest is the lender's charge for borrowing money. Calculation:(P * r * (1 + r) ** n) / ((1 + r) ** n - 1) Where:
P = Loan amount (principal)
Principal & interest:
| $3,017 |
Property TaxesAnnual taxes levied by local governments on real estate properties. These taxes fund public services like schools, roads, and emergency services.
Property tax:
| $309 |
InsuranceThe costs for insurance coverage to protect against financial losses due to risks like fire, natural disasters, theft, liability, or tenant-related damages. Calculation:Assumes 7% of gross rental income, unless insurance rates are specified.
Insurance:
| $224 |
Private Mortgage Insurance (PMI)A fee that borrowers pay when they take out a conventional loan with a loan-to-value (LTV) ratio above 80%.
Private mortgage insurance (PMI):
| $0 |
Monthly PaymentThe fixed amount a borrower pays each month to repay a loan. It typically includes principal and interest (P&I) and may also cover property taxes, insurance, HOA fees, and PMI if escrowed. Monthly payment:
| $3,550 |
Operating Income
| % Rent | Monthly | Yearly | |
|---|---|---|---|
Gross RentThe total rental income received from tenants before deducting any expenses. Includes base rent, late fees, pet fees, parking fees, and other recurring charges.
Gross rent:
| $3,200 | $38,400 | |
Vacancy LossExpected loss of rent due to vacancies.
Vacancy loss:
(6%)
| 6% | -$192 | -$2,304 |
Operating IncomeGross rental income minus vacancy loss. Calculation:Gross rent - Vacancy loss
Operating income:
| $3,008 | $36,096 |
Operating Expenses
| % Rent | Monthly | Yearly | |
|---|---|---|---|
Property TaxesAnnual taxes levied by local governments on real estate properties. These taxes fund public services like schools, roads, and emergency services. | 10% | -$309 | -$3,703 |
InsuranceThe costs for insurance coverage to protect against financial losses due to risks like fire, natural disasters, theft, liability, or tenant-related damages. Calculation:Assumes 7% of gross rental income, unless insurance rates are specified. | 7% | -$224 | -$2,688 |
Property ManagementThe costs associated with hiring a property manager to handle the day-to-day operations of a rental property. Includes management fees, leasing fes, eviction fees, etc. Calculation:Assumes 8% of gross rental income. | 8% | -$256 | -$3,072 |
Repairs & MaintenanceOngoing costs for routine upkeep and minor fixes needed to keep a property in good working condition. Calculation:Assumes 5% of gross rental income. Varies by property age and condition. | 5% | -$160 | -$1,920 |
Capital ExpensesLarge, infrequent costs for major improvements or replacements, like a new roof, HVAC system, or appliances. Calculation:Assumes 5% of gross rental income. Varies by property age. | 5% | -$160 | -$1,920 |
HOA FeesRegular dues paid to a Homeowners Association for community maintenance, amenities, and management. Similar fees include: Condo Association Fees, Co-op Maintenance Fees, etc. | n/a | n/a | n/a |
Operating ExpensesRecurring costs required to maintain and manage a rental property, including property taxes, insurance, maintenance, repairs, utilities (if paid by the owner), property management fees, and other day-to-day expenses. Calculation:Insurance + Property Taxes + Property Management + Repairs & Maintenance + Capital Expenditures + HOA Fees | 35% | -$1,109 | -$13,303 |
Cash Flow
| Monthly | Yearly | |
|---|---|---|
Net Operating Income (NOI)The income generated from a property after deducting all operating expenses but before deducting mortgage payments, taxes, and capital expenditures. Calculation:Gross Operating Income - Operating Expenses
Net operating income:
| $1,899 | $22,788 |
Mortgage PaymentThe fixed amount a borrower pays each month to repay a loan. It typically includes principal and interest (P&I) and may also cover property taxes, insurance, HOA fees, and PMI if escrowed. | -$3,017 | -$36,204 |
Cash FlowNet Operating Income (NOI) minus mortgage payments. Calculation:NOI - Mortgage Payments | -$1,118 | -$13,416 |