

$699,900
Investment Summary
- Monthly Cash Flow
- -$1,461
- Cap Rate
- 3.2%
- Cash-on-Cash Return
- -10.9%
- Debt Coverage Ratio
- 0.56
- Internal Rate of Return (5 years)
- -6.5%
Cash Flow
Net Operating Income (NOI) minus mortgage payments.
Calculation:
NOI - Mortgage Payments
Cap Rate (Market Value)
Capitalization Rate is a rate of return that compares the yearly Net Operating Income (NOI) to the market value.
Calculation:
NOI / Market Value
Cash-on-Cash Return (CoC)
Annual Cash Flow / Cash Invested
Calculation:
Annual cash flow divided by initial cash invested.
Debt Coverage Ratio (DCR)
Net Operating Income (NOI) divided by total debt payments.
Calculation:
NOI / Total Debt Payments
Internal Rate of Return (IRR)
A metric for assessing profitability over time. IRR is the discount rate at which the net present value (NPV) of all future cash flows (positive and negative) from an investment equals zero — including both periodic cash flow (such as rent) and a projected sale at the end of the holding period. It represents the expected annualized return, accounting for income, expenses, and the recovery of capital through a future sale.
Property Description
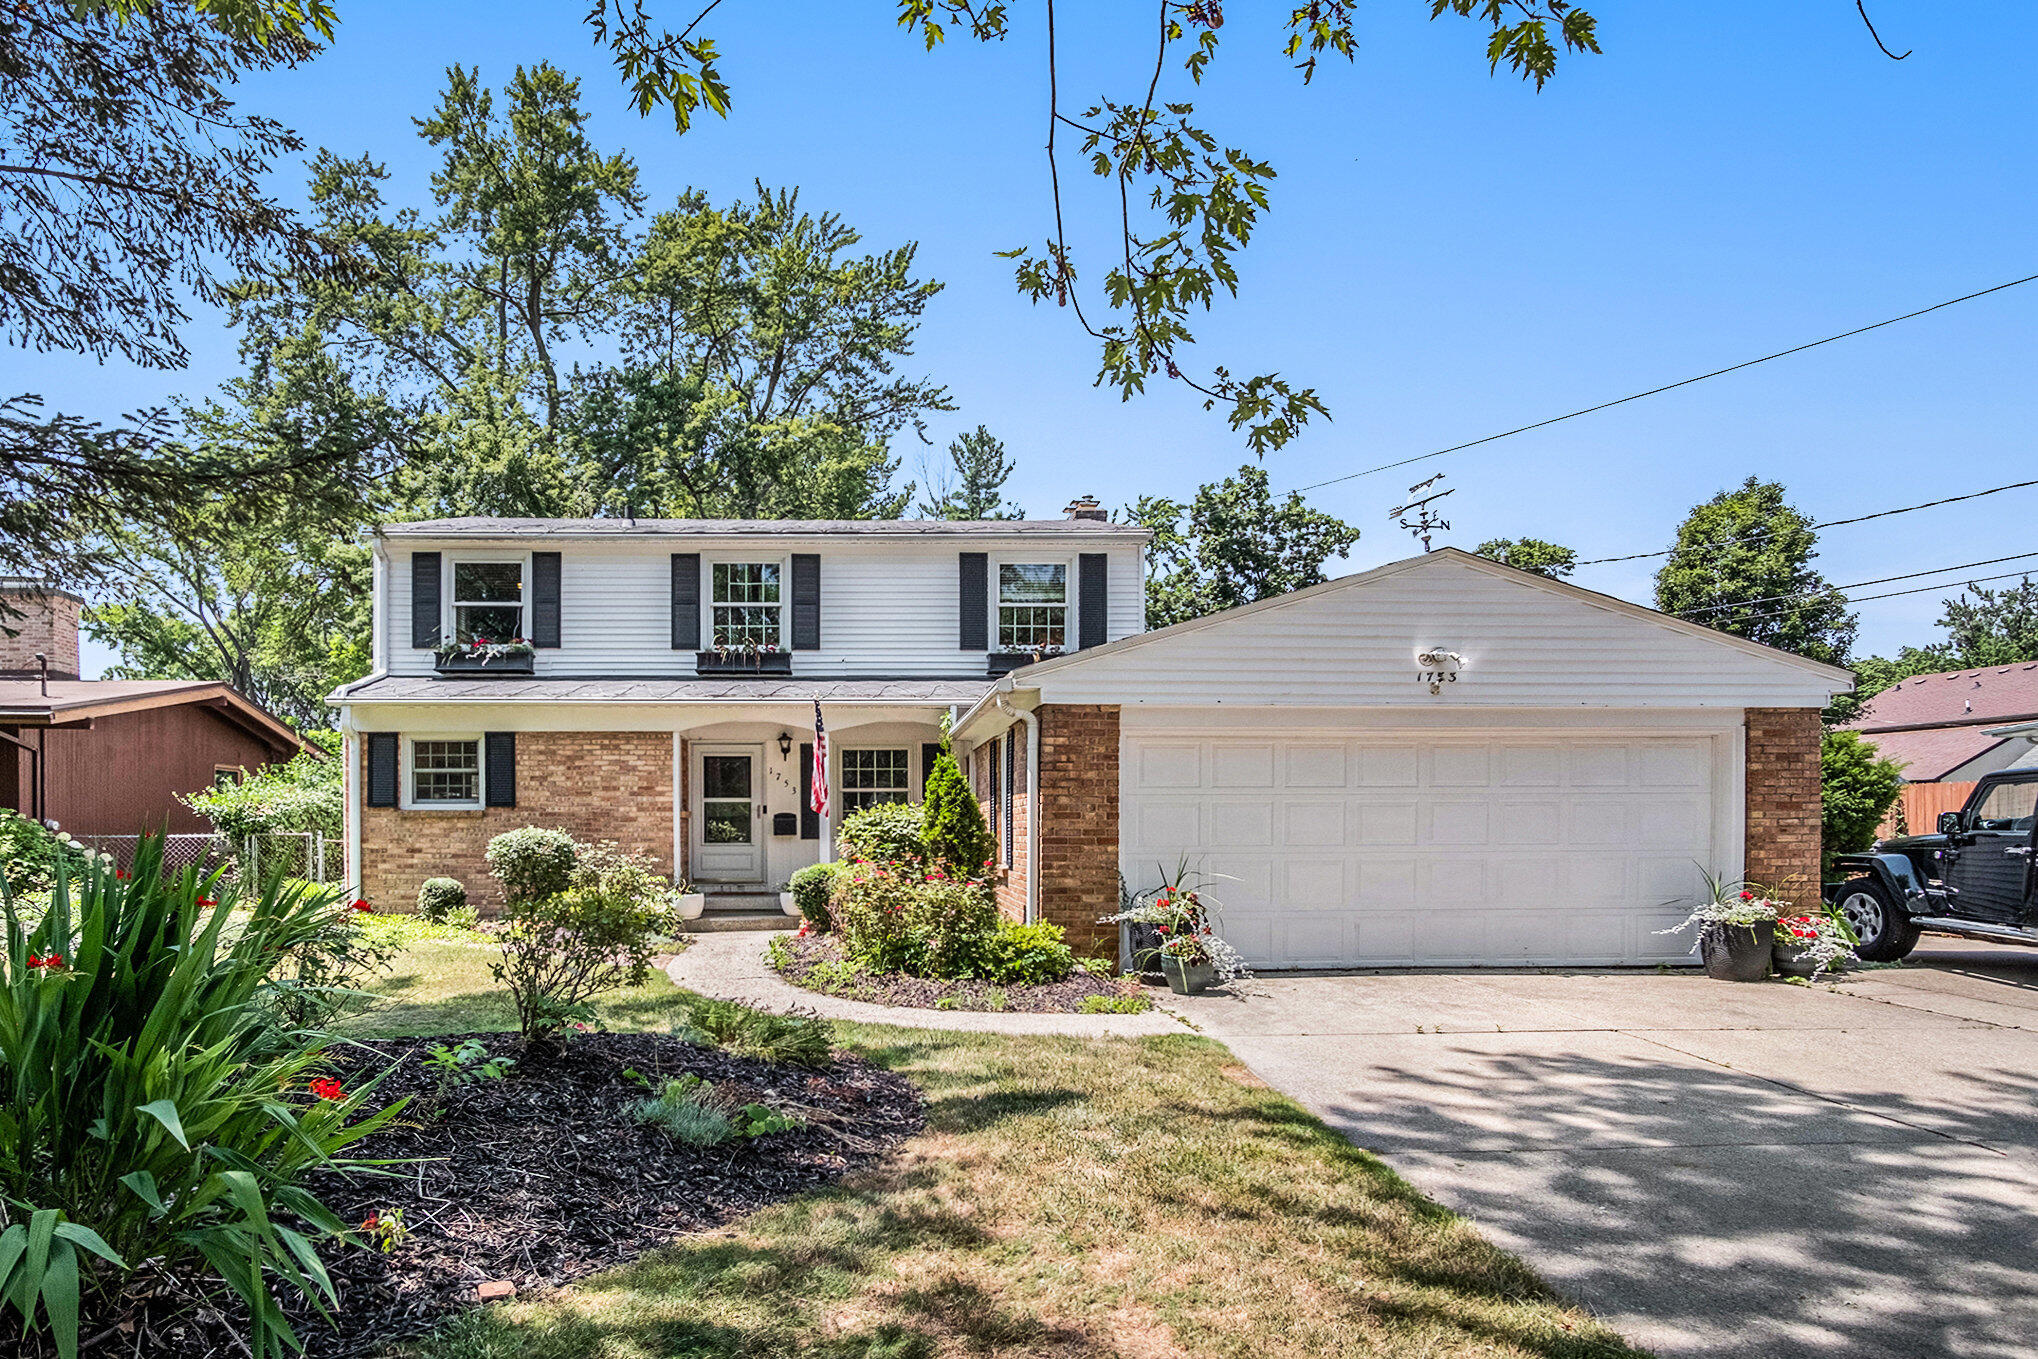
Welcome to 1753 Breton Road SE, an elegant and spacious 4 bedroom, 2.5 bathroom home in the heart of East Grand Rapids, one of West Michigan's most sought after communities. With over 3,000 finished square feet, this property blends timeless character with thoughtful updates, offering exceptional living space just minutes from the area's most popular parks, shops, and schools. The kitchen features stainless steel appliances, granite countertops, and a pantry, providing both style and functionality. At the front of the home, the main living room showcases hardwood floors and a classic brick fireplace, creating a warm and welcoming space. Toward the back of the home, a second sitting area includes another wood burning fireplace and connects to a stunning, two story atrium with skylights that fill the space with natural light year round. A private den on the main floor offers a quiet space for work or study, and an updated half bath adds modern convenience. Upstairs, you will find four bedrooms and two full bathrooms, including a spacious primary suite with a private ensuite and a cozy sitting area that overlooks the beautifully landscaped backyard. A unique spiral staircase in the primary suite connects to the rear living area on the main floor, adding architectural charm and a functional connection between the levels. The home sits on a rare, third of an acre lot, providing privacy and space that is difficult to find in this part of the city. The backyard is professionally landscaped, offering a quiet and inviting retreat perfect for outdoor gatherings or peaceful relaxation. The East Grand Rapids School District is consistently ranked among the best in the state, offering exceptional academics, highly regarded athletics, and strong community support. According to Niche.com, the district ranks number 3 for Best School Districts for Athletes in Michigan, number 10 for Districts with the Best Teachers, and number 14 overall. People are drawn to this district not just for its accolades, but for the vibrant, supportive environment it provides students of all ages. Located just minutes from Reeds Lake, John Collins Park, Gaslight Village, and Breton Village Shopping Center, the home is perfectly positioned for both convenience and lifestyle. Enjoy nearby access to boutique shops, grocery stores, fitness studios, and locally loved restaurants. Whether you're taking in lake views, grabbing coffee in the village, or enjoying seasonal events around town, this is East Grand Rapids living at its best. 1753 Breton Road SE delivers the perfect combination of space, comfort, and location in one of Michigan's most vibrant and established neighborhoods.
Build Your Team
Quickly find investor-friendly professionals who can help you succeed in real estate investing at any stage of the investing journey.


Agents
Match with investor-friendly agents who can help you find, analyze, and close your next deal


Lenders
Get the best funding…find investor-friendly lenders who specialize in your deal strategy


Property Managers
Transition to passive investing. Find a trusted property management partnership that lasts.


Tax Pros & Accountants
Taxes and financial reporting made easy—find experts to create tax savings strategies, file taxes, and more
Location
Property Details
Parking
- Description: Attached, GarageFacesFront, GarageDoorOpener, Paved
- Details: Garage Faces Front, Garage Door Opener, Attached, Concrete
- Garage Spaces: 2
- Spaces Total: 0
Bedroom Information
- # of Bedrooms: 4
Bathroom Information
- # of Baths (Full): 2
- # of Baths (Partial): 1
- # of Baths (Total): 3.0
Interior Features
- # of Rooms: 13
- # of Stories: 2
- Basement: Yes
- Basement Description: Full, Partially Finished
- Fireplace: Yes
Exterior Features
- Roof Material: Composition
Land Information
- Land Use: Residential
- Land Use Subtype: Single Family Residential
Lot Information
- Parcel ID: 411804434015
- Lot Size: 12894 sqft
Property Information
- Property Type: Single Family Residence
- Style: Traditional
- Year Built: 1958
Tax Information
- Annual Tax: $10,905
Utilities
- Water & Sewer: Public
- Heating: Natural Gas, Forced Air
- Cooling: Central Air
Location
- County: Kent
Listing Details
Investment Summary
- Monthly Cash Flow
- -$1,461
- Cap Rate
- 3.2%
- Cash-on-Cash Return
- -10.9%
- Debt Coverage Ratio
- 0.56
- Internal Rate of Return (5 years)
- -6.5%
Cash Flow
Net Operating Income (NOI) minus mortgage payments.
Calculation:
NOI - Mortgage Payments
Cap Rate (Market Value)
Capitalization Rate is a rate of return that compares the yearly Net Operating Income (NOI) to the market value.
Calculation:
NOI / Market Value
Cash-on-Cash Return (CoC)
Annual Cash Flow / Cash Invested
Calculation:
Annual cash flow divided by initial cash invested.
Debt Coverage Ratio (DCR)
Net Operating Income (NOI) divided by total debt payments.
Calculation:
NOI / Total Debt Payments
Internal Rate of Return (IRR)
A metric for assessing profitability over time. IRR is the discount rate at which the net present value (NPV) of all future cash flows (positive and negative) from an investment equals zero — including both periodic cash flow (such as rent) and a projected sale at the end of the holding period. It represents the expected annualized return, accounting for income, expenses, and the recovery of capital through a future sale.
Purchase Details
Purchase PriceThe price paid for the property. Purchase price:
| $699,900 |
|---|---|
Amount FinancedThe amount of the purchase financed through a loan. Amount financed:
| -$559,920 |
Down paymentThe initial payment made towards the purchase. Down payment:
| $139,980 |
Closing CostsFees and expenses associated with purchasing a property, typically ranging from 2% to 5% of the home’s purchase price, paid at the end of a home purchase to cover services like lending, title transfer, and taxes. Closing costs:
| $20,997 |
Rehab CostsCosts incurred to repair or improve the property, including: roof, flooring, exterior siding, kitchen, exterior paint, bathrooms, etc. Rehab costs:
| $0 |
Initial Cash InvestedThe total initial cash invested in the property. Calculation:Down payment + Buying costs + Rehab costs Initial cash invested:
| $160,977 |
Square Feet (SQFT)The total square footage of the property. Square feet:
| 2,916 |
Cost Per Square FootCost per square foot of the property. Calculation:Purchase Price / Square Feet Cost per square foot:
| $240 |
Monthly Rent Per Square FootMonthly rent divided by the number of square feet. This ratio helps investors compare rental income efficiency across properties, markets, and unit sizes Calculation:Monthly Rent / Square Feet Monthly rent per square foot:
| $1.37 |
Financing Details
Loan AmountThe total sum of money borrowed from a lender to finance a property purchase. Calculation:Purchase Price - Down Payment
Loan amount:
| $559,920 |
|---|---|
Loan to Value Ratio (LTV)Loan amount divided by the market value of the property. Calculation:Loan Amount / Market Value
Loan to value ratio:
| 80.0% |
Loan TypeThe type of loan (e.g., fixed, adjustable).
Loan type:
| Amortizing |
TermThe loan repayment period in years.
Term:
| 30 years |
Interest RateThe percentage a lender charges on the borrowed amount of a loan, determining the cost of borrowing money.
Interest rate:
| 5.875% |
Principal & Interest (PI)The principal is the portion of the loan payment that reduces the loan balance. The interest is the lender's charge for borrowing money. Calculation:(P * r * (1 + r) ** n) / ((1 + r) ** n - 1) Where:
P = Loan amount (principal)
Principal & interest:
| $3,312 |
Property TaxesAnnual taxes levied by local governments on real estate properties. These taxes fund public services like schools, roads, and emergency services.
Property tax:
| $909 |
InsuranceThe costs for insurance coverage to protect against financial losses due to risks like fire, natural disasters, theft, liability, or tenant-related damages. Calculation:Assumes 7% of gross rental income, unless insurance rates are specified.
Insurance:
| $280 |
Private Mortgage Insurance (PMI)A fee that borrowers pay when they take out a conventional loan with a loan-to-value (LTV) ratio above 80%.
Private mortgage insurance (PMI):
| $0 |
Monthly PaymentThe fixed amount a borrower pays each month to repay a loan. It typically includes principal and interest (P&I) and may also cover property taxes, insurance, HOA fees, and PMI if escrowed. Monthly payment:
| $4,501 |
Operating Income
| % Rent | Monthly | Yearly | |
|---|---|---|---|
Gross RentThe total rental income received from tenants before deducting any expenses. Includes base rent, late fees, pet fees, parking fees, and other recurring charges.
Gross rent:
| $4,000 | $48,000 | |
Vacancy LossExpected loss of rent due to vacancies.
Vacancy loss:
(6%)
| 6% | -$240 | -$2,880 |
Operating IncomeGross rental income minus vacancy loss. Calculation:Gross rent - Vacancy loss
Operating income:
| $3,760 | $45,120 |
Operating Expenses
| % Rent | Monthly | Yearly | |
|---|---|---|---|
Property TaxesAnnual taxes levied by local governments on real estate properties. These taxes fund public services like schools, roads, and emergency services. | 23% | -$909 | -$10,905 |
InsuranceThe costs for insurance coverage to protect against financial losses due to risks like fire, natural disasters, theft, liability, or tenant-related damages. Calculation:Assumes 7% of gross rental income, unless insurance rates are specified. | 7% | -$280 | -$3,360 |
Property ManagementThe costs associated with hiring a property manager to handle the day-to-day operations of a rental property. Includes management fees, leasing fes, eviction fees, etc. Calculation:Assumes 8% of gross rental income. | 8% | -$320 | -$3,840 |
Repairs & MaintenanceOngoing costs for routine upkeep and minor fixes needed to keep a property in good working condition. Calculation:Assumes 5% of gross rental income. Varies by property age and condition. | 5% | -$200 | -$2,400 |
Capital ExpensesLarge, infrequent costs for major improvements or replacements, like a new roof, HVAC system, or appliances. Calculation:Assumes 5% of gross rental income. Varies by property age. | 5% | -$200 | -$2,400 |
HOA FeesRegular dues paid to a Homeowners Association for community maintenance, amenities, and management. Similar fees include: Condo Association Fees, Co-op Maintenance Fees, etc. | n/a | n/a | n/a |
Operating ExpensesRecurring costs required to maintain and manage a rental property, including property taxes, insurance, maintenance, repairs, utilities (if paid by the owner), property management fees, and other day-to-day expenses. Calculation:Insurance + Property Taxes + Property Management + Repairs & Maintenance + Capital Expenditures + HOA Fees | 48% | -$1,909 | -$22,905 |
Cash Flow
| Monthly | Yearly | |
|---|---|---|
Net Operating Income (NOI)The income generated from a property after deducting all operating expenses but before deducting mortgage payments, taxes, and capital expenditures. Calculation:Gross Operating Income - Operating Expenses
Net operating income:
| $1,851 | $22,212 |
Mortgage PaymentThe fixed amount a borrower pays each month to repay a loan. It typically includes principal and interest (P&I) and may also cover property taxes, insurance, HOA fees, and PMI if escrowed. | -$3,312 | -$39,744 |
Cash FlowNet Operating Income (NOI) minus mortgage payments. Calculation:NOI - Mortgage Payments | -$1,461 | -$17,532 |