49506 Investment Properties for Sale
Browse homes for sale and investment properties in 49506. Refine your search by price, property type, or more.
Best cash flowing properties in 49506

Active
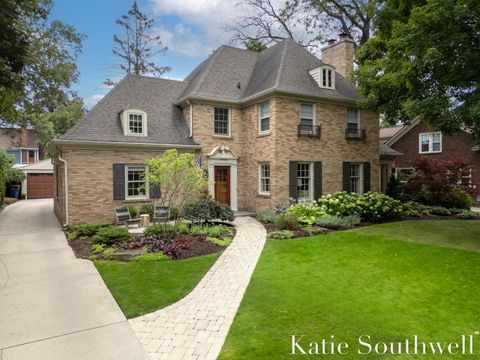
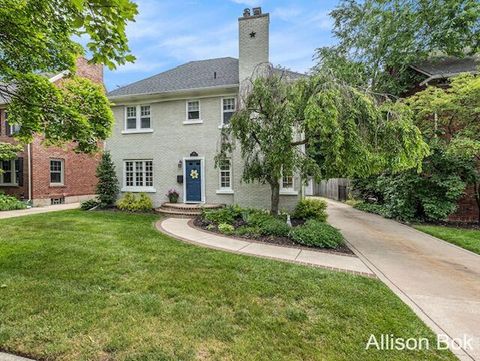
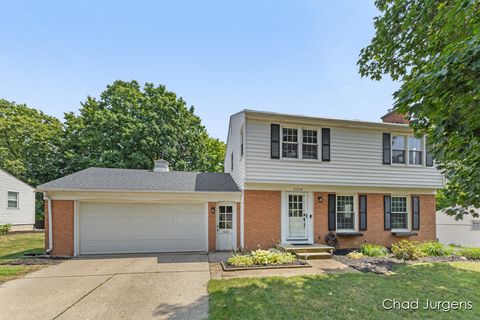
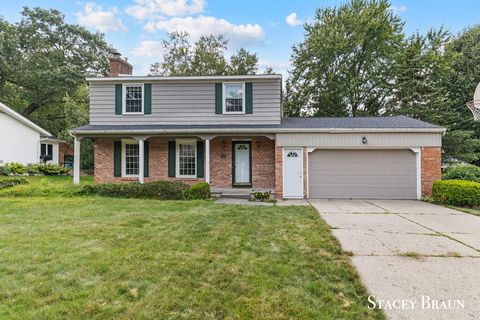
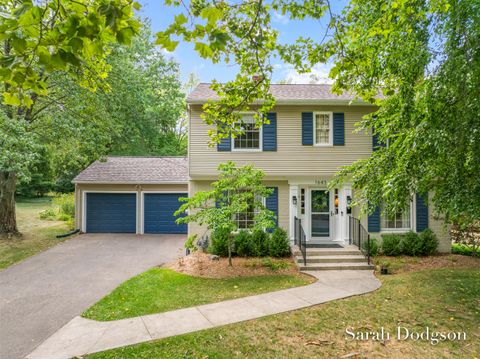
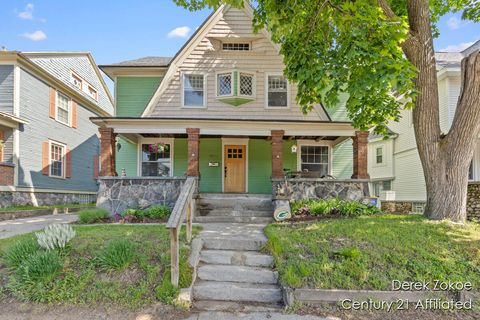
$250,000
3
bds
|
2
ba
|
2,378
sqft
|
built
1924
1136 Underwood Ave SE, Grand Rapids, MI 49506
$126
Cash flow
2.6%
Cash-on-Cash Return
6.8%
Cap rate
0.9%
Rent to Value Ratio

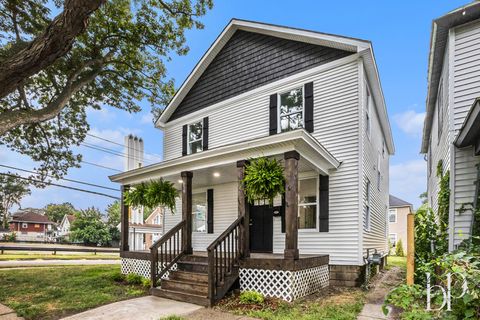
Active
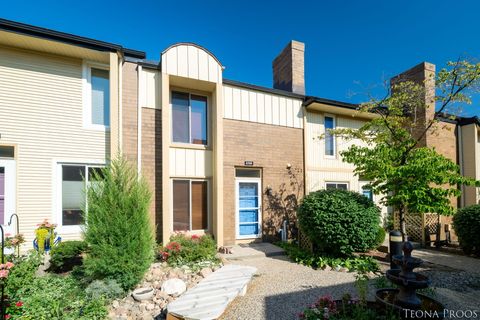
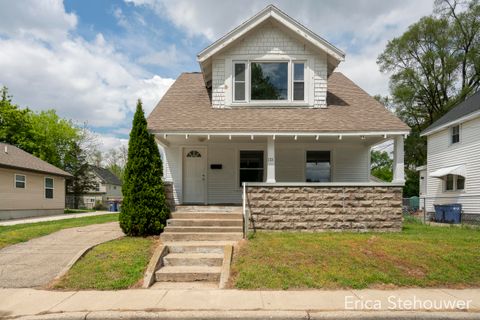
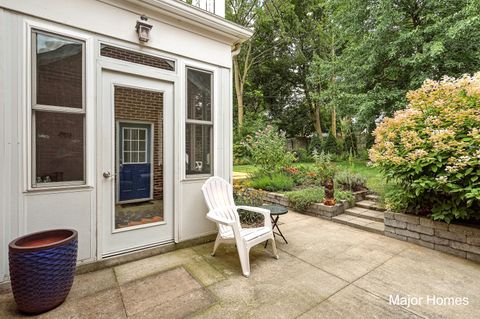
$280,000
4
bds
|
3
ba
|
2,111
sqft
|
built
1925
1035 Fuller Ave SE, Grand Rapids, MI 49506
$-115
Cash flow
-2.1%
Cash-on-Cash Return
5.7%
Cap rate
0.8%
Rent to Value Ratio
50 out of 62 properties for sale in 49506
Limited Results Shown
Create a free account, or log in to reveal all property listings and enjoy the complete experience.
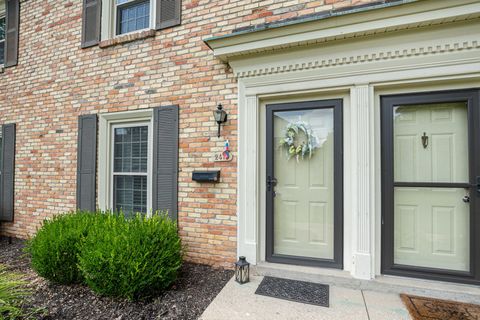
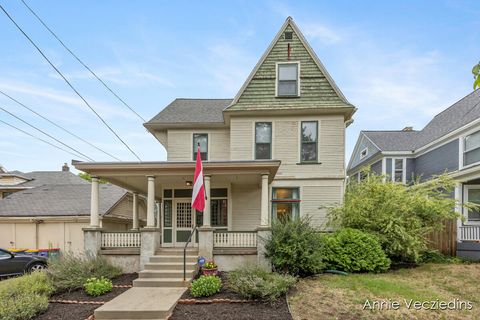
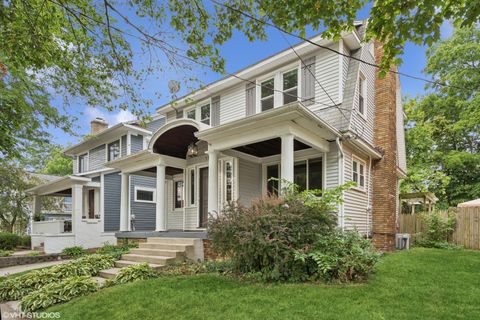
Active
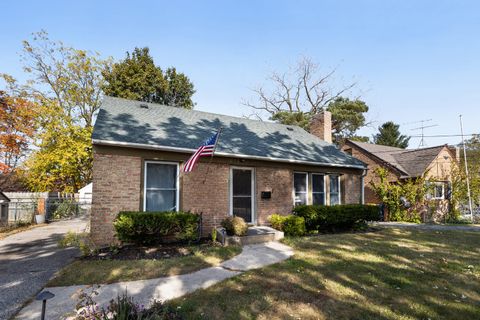
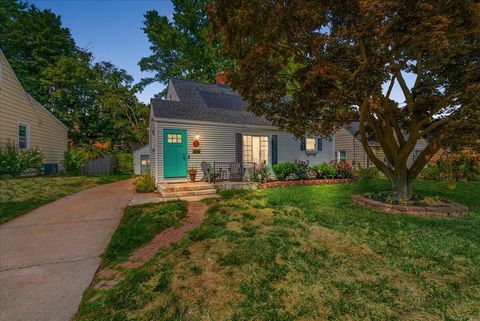
$240,000
2
bds
|
2
ba
|
1,036
sqft
|
built
1967
2470 Abbington Dr SE, Grand Rapids, MI 49506
$-558
Cash flow
-12.1%
Cash-on-Cash Return
3.4%
Cap rate
0.8%
Rent to Value Ratio
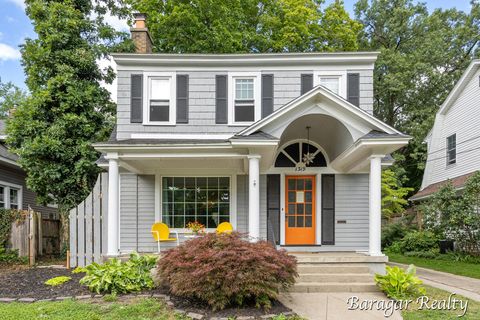
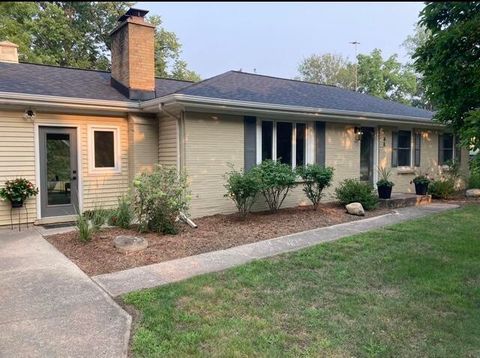
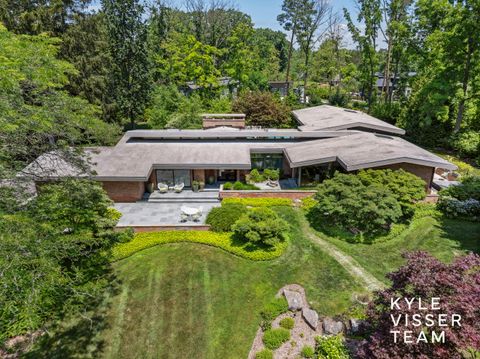
Active
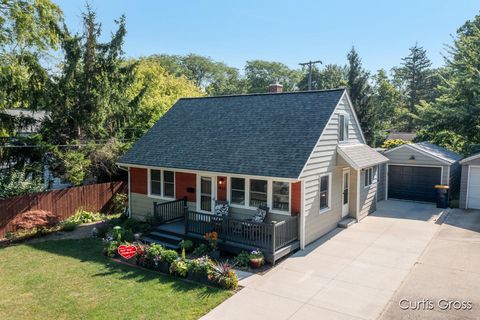
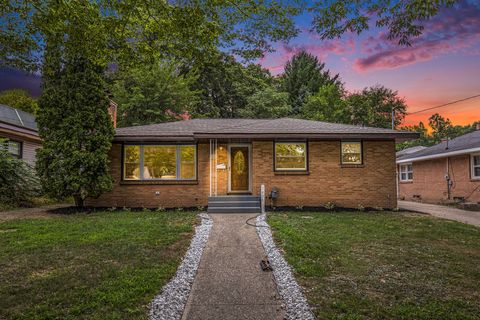
$360,000
3
bds
|
2
ba
|
1,485
sqft
|
built
1934
1319 Allerton Ave SE, Grand Rapids, MI 49506
$-431
Cash flow
-6.2%
Cash-on-Cash Return
4.7%
Cap rate
0.6%
Rent to Value Ratio
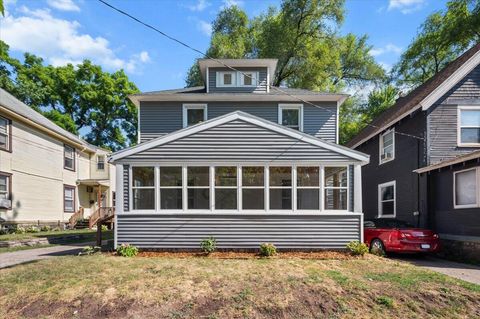
Active
$290,000
4
bds
|
0
ba
|
0
sqft
|
built
1900
1125 Thomas St SE, Grand Rapids, MI 49506
$-460
Cash flow
-8.3%
Cash-on-Cash Return
4.2%
Cap rate
0.8%
Rent to Value Ratio
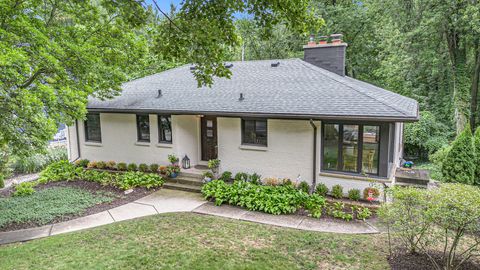
Active
$570,000
3
bds
|
3
ba
|
2,252
sqft
|
built
1953
2760 Hall St SE, Grand Rapids, MI 49506
$-1,318
Cash flow
-12.1%
Cash-on-Cash Return
3.4%
Cap rate
0.6%
Rent to Value Ratio
Active
$1,585,000
4
bds
|
4
ba
|
3,672
sqft
|
built
1929
958 Pinecrest Ave SE, Grand Rapids, MI 49506
$-6,602
Cash flow
-21.7%
Cash-on-Cash Return
1.1%
Cap rate
0.3%
Rent to Value Ratio
Active
$210,000
2
bds
|
2
ba
|
1,416
sqft
|
built
1972
2709 Modoc Trl SE, Grand Rapids, MI 49506
$-626
Cash flow
-15.6%
Cash-on-Cash Return
2.6%
Cap rate
0.8%
Rent to Value Ratio

Active
$349,900
3
bds
|
2
ba
|
1,022
sqft
|
built
1900
656 Gladstone Dr SE, Grand Rapids, MI 49506
$-677
Cash flow
-10.1%
Cash-on-Cash Return
3.8%
Cap rate
0.6%
Rent to Value Ratio

Active
$319,900
3
bds
|
2
ba
|
1,685
sqft
|
built
1925
1248 Fisk Rd SE, Grand Rapids, MI 49506
$-289
Cash flow
-4.7%
Cash-on-Cash Return
5.1%
Cap rate
0.8%
Rent to Value Ratio
Active
$349,900
3
bds
|
1
ba
|
1,241
sqft
|
built
1951
1813 Kreiser St SE, Grand Rapids, MI 49506
$-413
Cash flow
-6.2%
Cash-on-Cash Return
4.7%
Cap rate
0.7%
Rent to Value Ratio
Active
$385,000
3
bds
|
1
ba
|
1,493
sqft
|
built
1950
1432 Eastlawn Rd SE, East Grand Rapids, MI 49506
$-559
Cash flow
-7.6%
Cash-on-Cash Return
4.4%
Cap rate
0.6%
Rent to Value Ratio

Active
$699,900
4
bds
|
3
ba
|
2,916
sqft
|
built
1958
1753 Breton Rd SE, East Grand Rapids, MI 49506
$-1,734
Cash flow
-12.9%
Cash-on-Cash Return
3.2%
Cap rate
0.6%
Rent to Value Ratio
Active
$549,900
4
bds
|
3
ba
|
1,981
sqft
|
built
1926
828 Cadillac Dr SE, Grand Rapids, MI 49506
$-974
Cash flow
-9.2%
Cash-on-Cash Return
4.0%
Cap rate
0.6%
Rent to Value Ratio
Active
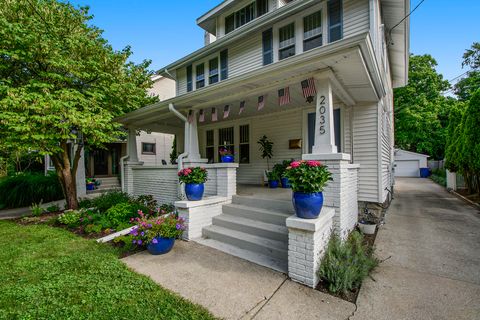
$560,000
3
bds
|
2
ba
|
1,674
sqft
|
built
1919
2035 Wealthy St SE, Grand Rapids, MI 49506
$-1,762
Cash flow
-16.4%
Cash-on-Cash Return
2.4%
Cap rate
0.4%
Rent to Value Ratio
Active
$300,000
3
bds
|
3
ba
|
1,556
sqft
|
built
1953
1513 Sylvan Ave SE, Grand Rapids, MI 49506
$-227
Cash flow
-3.9%
Cash-on-Cash Return
5.2%
Cap rate
0.7%
Rent to Value Ratio
Active
$1,295,000
5
bds
|
4
ba
|
3,886
sqft
|
built
1926
859 Orchard Ave SE, Grand Rapids, MI 49506
$-5,551
Cash flow
-22.4%
Cash-on-Cash Return
1.0%
Cap rate
0.2%
Rent to Value Ratio
Active
$429,900
3
bds
|
2
ba
|
2,113
sqft
|
built
1960
2158 Cambridge Dr SE, Grand Rapids, MI 49506
$-802
Cash flow
-9.7%
Cash-on-Cash Return
3.9%
Cap rate
0.6%
Rent to Value Ratio
Active
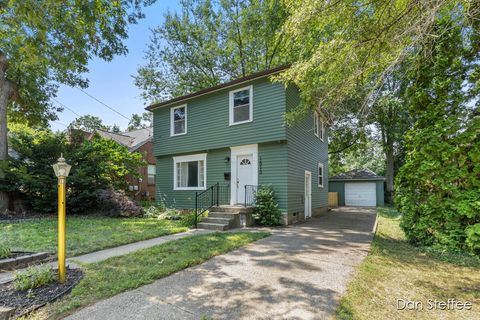
$274,900
3
bds
|
2
ba
|
1,440
sqft
|
built
1910
659 Dolbee Ave SE, Grand Rapids, MI 49506
$-523
Cash flow
-9.9%
Cash-on-Cash Return
3.9%
Cap rate
0.5%
Rent to Value Ratio
Active
$399,900
4
bds
|
2
ba
|
2,159
sqft
|
built
1900
811 Fairmount St SE, Grand Rapids, MI 49506
$-411
Cash flow
-5.4%
Cash-on-Cash Return
4.9%
Cap rate
0.7%
Rent to Value Ratio

Active
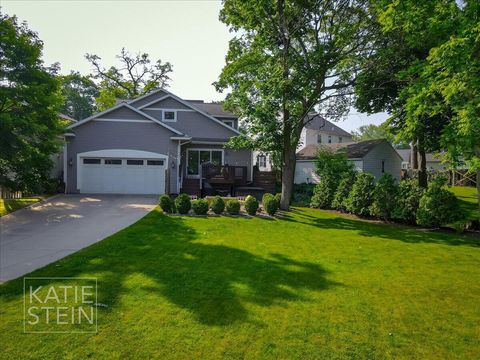
$455,000
4
bds
|
3
ba
|
2,682
sqft
|
built
1961
2212 Shawnee Dr SE, Grand Rapids, MI 49506
$-757
Cash flow
-8.7%
Cash-on-Cash Return
4.2%
Cap rate
0.6%
Rent to Value Ratio
Active
$475,000
3
bds
|
2
ba
|
1,744
sqft
|
built
1953
48 Elmhurst Dr SE, Grand Rapids, MI 49506
$-1,631
Cash flow
-17.9%
Cash-on-Cash Return
2.0%
Cap rate
0.5%
Rent to Value Ratio
Active
$375,000
4
bds
|
2
ba
|
1,792
sqft
|
built
1963
2357 Cambridge Dr SE, Grand Rapids, MI 49506
$-547
Cash flow
-7.6%
Cash-on-Cash Return
4.4%
Cap rate
0.6%
Rent to Value Ratio

Active
$369,900
4
bds
|
3
ba
|
2,082
sqft
|
built
1963
1857 Avondale Dr SE, Grand Rapids, MI 49506
$-358
Cash flow
-5.0%
Cash-on-Cash Return
5.0%
Cap rate
0.7%
Rent to Value Ratio
Active
$190,000
3
bds
|
1
ba
|
1,250
sqft
|
built
1922
1101 Bemis St SE, Grand Rapids, MI 49506
$-5,714
Cash flow
-156.9%
Cash-on-Cash Return
-29.9%
Cap rate
0.9%
Rent to Value Ratio
Active
$359,000
4
bds
|
3
ba
|
2,246
sqft
|
built
1940
1819 Sylvan Ave SE, Grand Rapids, MI 49506
$-374
Cash flow
-5.4%
Cash-on-Cash Return
4.9%
Cap rate
0.7%
Rent to Value Ratio
Active
$319,900
3
bds
|
1
ba
|
1,684
sqft
|
built
1955
1434 Sylvan Ave SE, Grand Rapids, MI 49506
$-562
Cash flow
-9.2%
Cash-on-Cash Return
4.0%
Cap rate
0.6%
Rent to Value Ratio
Active
$495,000
4
bds
|
2
ba
|
2,323
sqft
|
built
1958
1643 Gorham Dr SE, Grand Rapids, MI 49506
$-907
Cash flow
-9.6%
Cash-on-Cash Return
3.9%
Cap rate
0.6%
Rent to Value Ratio
Active
$750,000
4
bds
|
3
ba
|
3,005
sqft
|
built
1941
1543 Mackinaw Rd SE, Grand Rapids, MI 49506
$-2,216
Cash flow
-15.4%
Cash-on-Cash Return
2.6%
Cap rate
0.5%
Rent to Value Ratio

Active
$449,000
3
bds
|
2
ba
|
1,290
sqft
|
built
1909
725 Gladstone Dr SE, Grand Rapids, MI 49506
$-1,254
Cash flow
-14.6%
Cash-on-Cash Return
2.8%
Cap rate
0.5%
Rent to Value Ratio

Active
$250,000
bds
|
0
ba
|
0
sqft
|
built
1905
318 Diamond Ave SE, Grand Rapids, MI 49506
$-332
Cash flow
-6.9%
Cash-on-Cash Return
4.6%
Cap rate
0.9%
Rent to Value Ratio
Active
$515,000
3
bds
|
3
ba
|
2,206
sqft
|
built
1925
715 Gladstone Dr SE, Grand Rapids, MI 49506
$-1,049
Cash flow
-10.6%
Cash-on-Cash Return
3.7%
Cap rate
0.7%
Rent to Value Ratio

Active
$434,000
4
bds
|
2
ba
|
1,744
sqft
|
built
1910
240 Calkins Ave SE, Grand Rapids, MI 49506
$-718
Cash flow
-8.6%
Cash-on-Cash Return
4.2%
Cap rate
0.6%
Rent to Value Ratio
Active
$2,995,000
4
bds
|
4
ba
|
4,550
sqft
|
built
1957
130 Robinwood Ave SE, Grand Rapids, MI 49506
$-13,146
Cash flow
-22.9%
Cash-on-Cash Return
0.9%
Cap rate
0.2%
Rent to Value Ratio
Active
$2,995,000
4
bds
|
4
ba
|
4,376
sqft
|
built
1970
3150 Manhattan Ln SE, East Grand Rapids, MI 49506
$-16,188
Cash flow
-28.2%
Cash-on-Cash Return
-0.3%
Cap rate
0.3%
Rent to Value Ratio

Active
$6,800,000
5
bds
|
9
ba
|
11,652
sqft
|
built
1995
1995 San Lu Rae Dr SE, Grand Rapids, MI 49506
$-39,165
Cash flow
-30.0%
Cash-on-Cash Return
-0.8%
Cap rate
0.1%
Rent to Value Ratio
Active
$619,000
3
bds
|
2
ba
|
2,210
sqft
|
built
1950
1052 Santa Cruz Dr SE, East Grand Rapids, MI 49506
$-1,933
Cash flow
-16.3%
Cash-on-Cash Return
2.4%
Cap rate
0.5%
Rent to Value Ratio
Active
$460,000
3
bds
|
2
ba
|
1,870
sqft
|
built
1940
1115 Keneberry Way SE, East Grand Rapids, MI 49506
$-897
Cash flow
-10.2%
Cash-on-Cash Return
3.8%
Cap rate
0.7%
Rent to Value Ratio
Active
$749,000
4
bds
|
3
ba
|
2,803
sqft
|
built
1885
3 Woodward Ln SE, Grand Rapids, MI 49506
$-2,456
Cash flow
-17.1%
Cash-on-Cash Return
2.2%
Cap rate
0.3%
Rent to Value Ratio
Active
$325,000
4
bds
|
2
ba
|
1,896
sqft
|
built
1900
1237 Wealthy St SE, Grand Rapids, MI 49506
$-325
Cash flow
-5.2%
Cash-on-Cash Return
4.9%
Cap rate
0.8%
Rent to Value Ratio