$647,000
Investment Summary
- Monthly Cash Flow
- -$1,733
- Cap Rate
- 2.9%
- Cash-on-Cash Return
- -14.0%
- Debt Coverage Ratio
- 0.48
- Internal Rate of Return (5 years)
- -9.5%
Cash Flow
Net Operating Income (NOI) minus mortgage payments.
Calculation:
NOI - Mortgage Payments
Cap Rate (Market Value)
Capitalization Rate is a rate of return that compares the yearly Net Operating Income (NOI) to the market value.
Calculation:
NOI / Market Value
Cash-on-Cash Return (CoC)
Annual Cash Flow / Cash Invested
Calculation:
Annual cash flow divided by initial cash invested.
Debt Coverage Ratio (DCR)
Net Operating Income (NOI) divided by total debt payments.
Calculation:
NOI / Total Debt Payments
Internal Rate of Return (IRR)
A metric for assessing profitability over time. IRR is the discount rate at which the net present value (NPV) of all future cash flows (positive and negative) from an investment equals zero — including both periodic cash flow (such as rent) and a projected sale at the end of the holding period. It represents the expected annualized return, accounting for income, expenses, and the recovery of capital through a future sale.
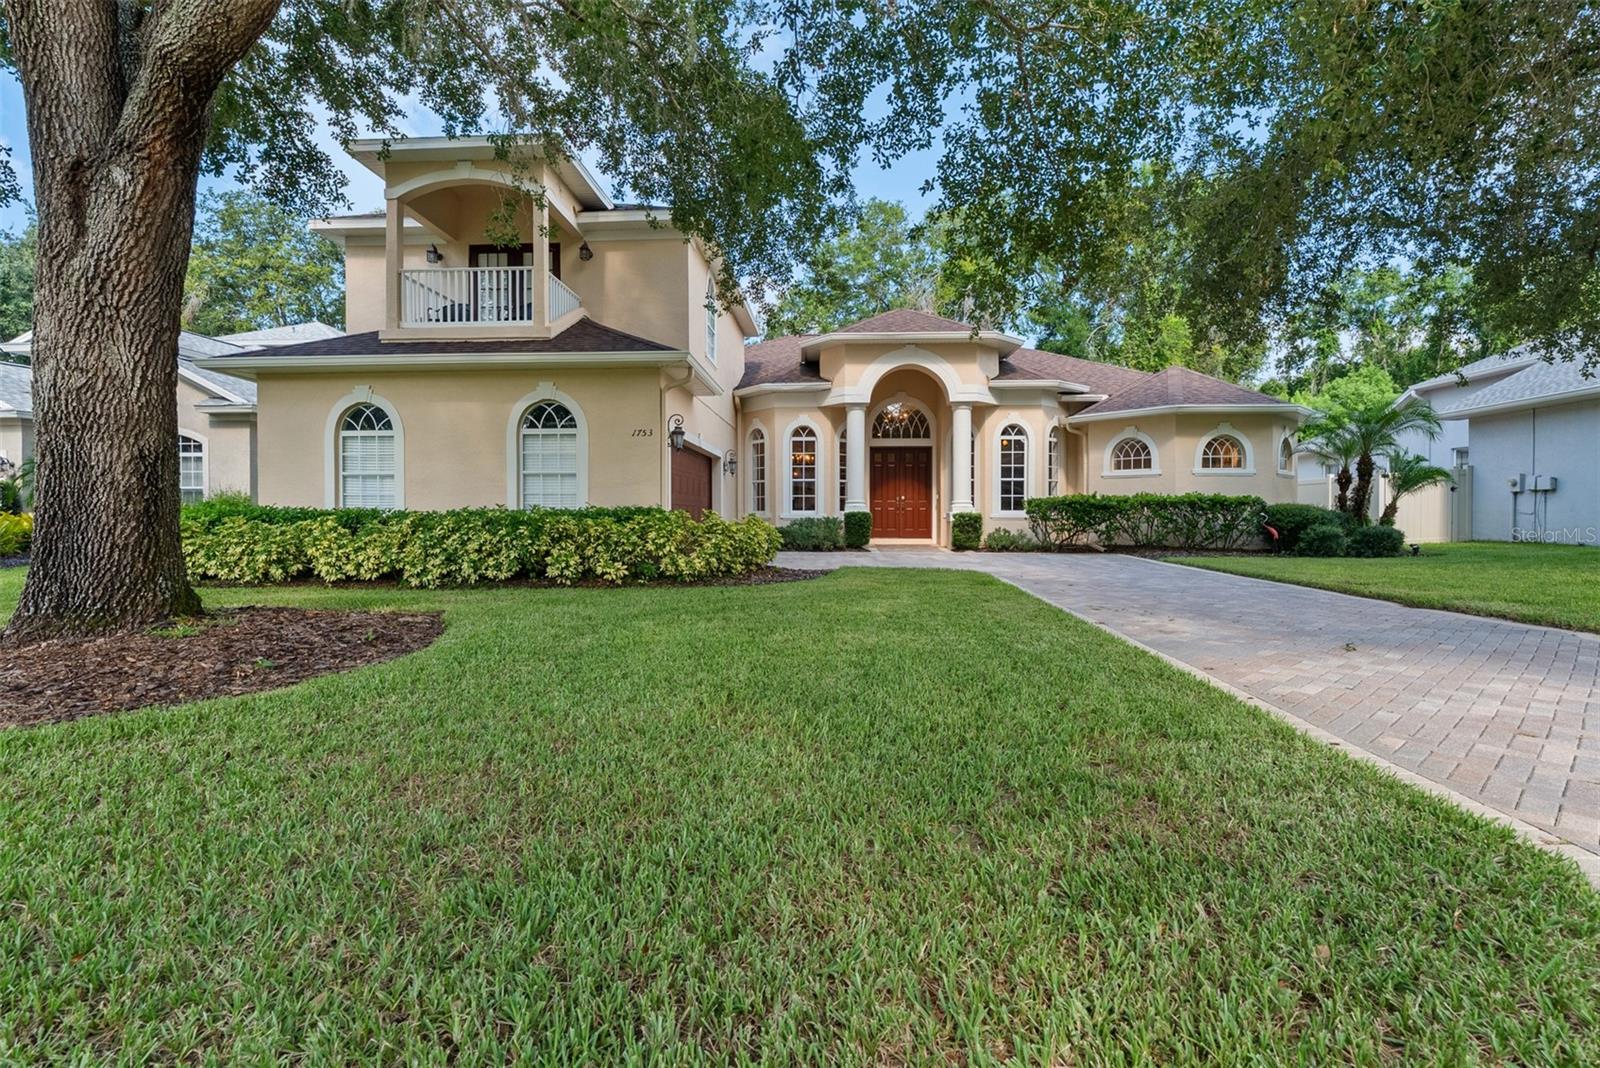
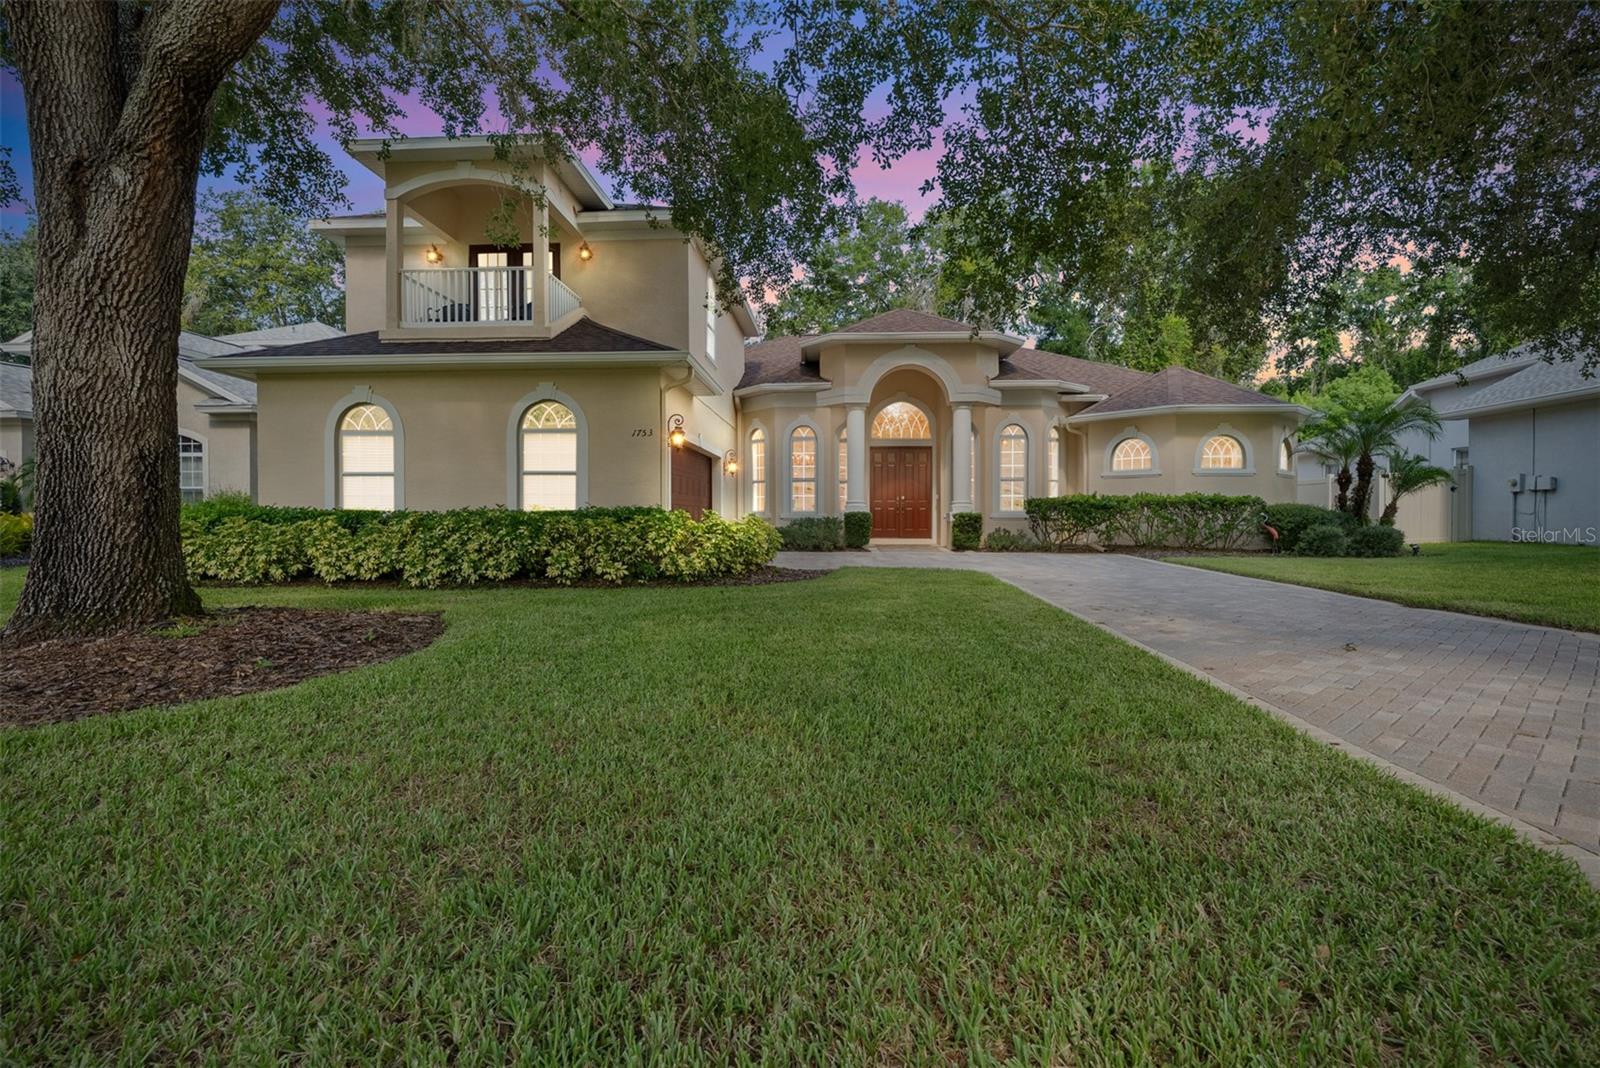
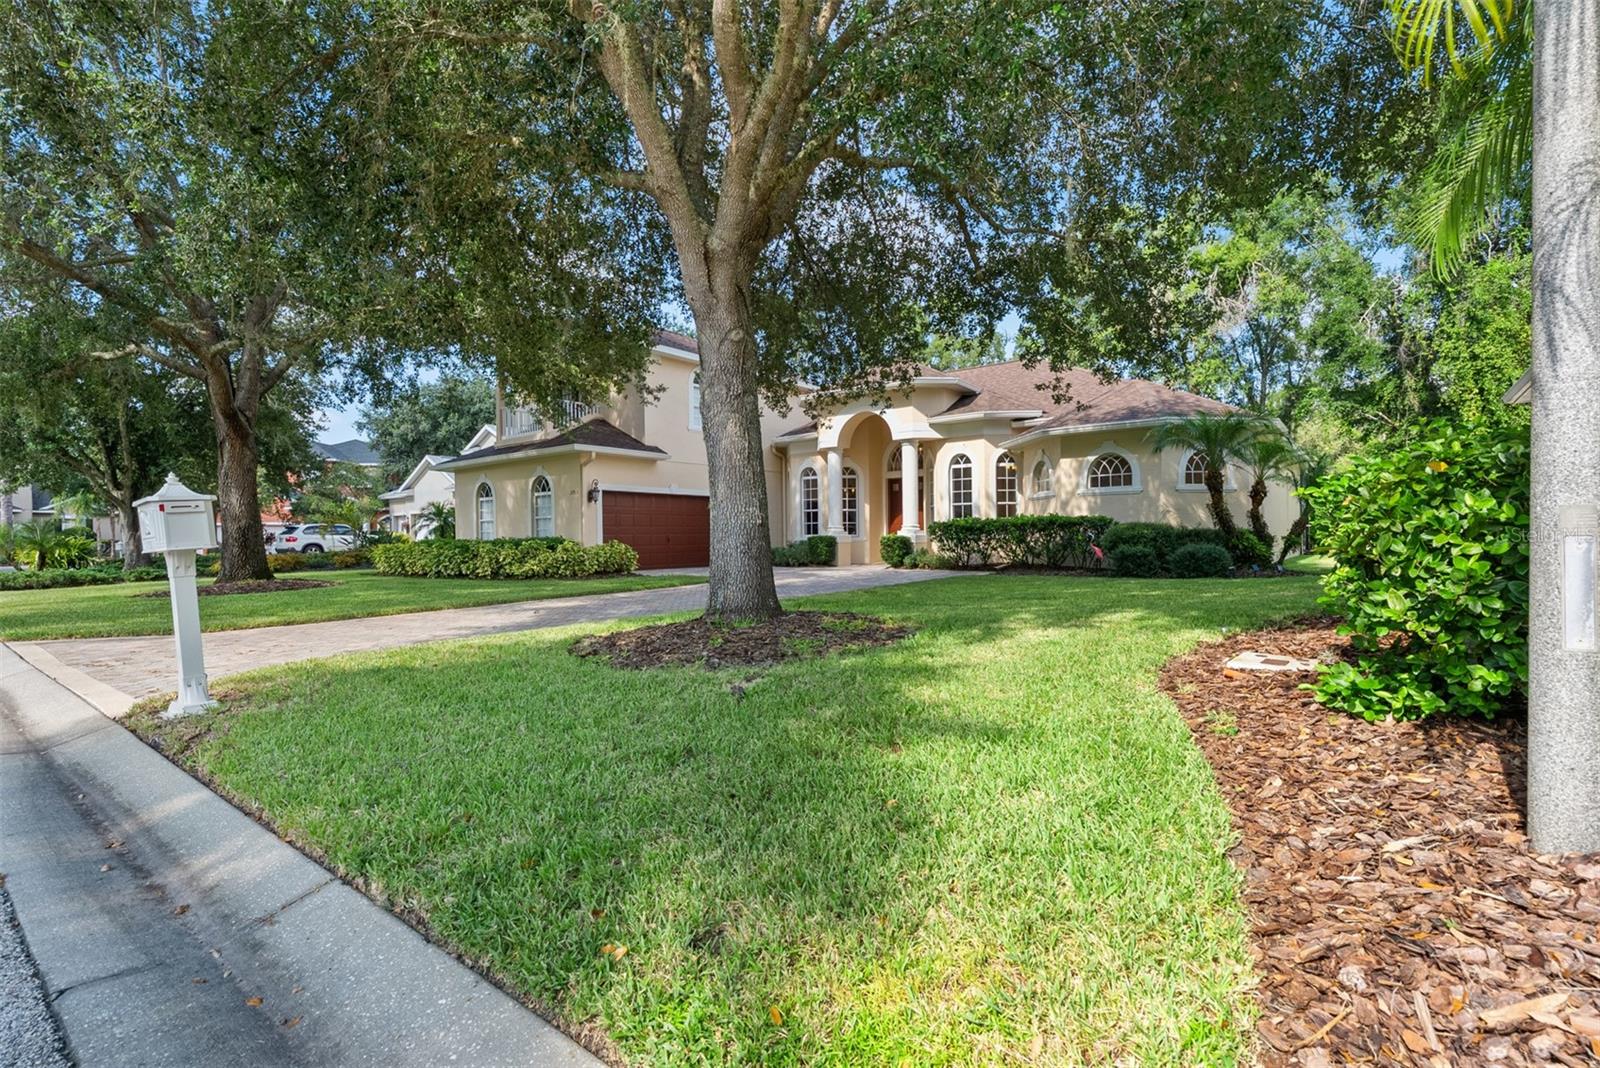
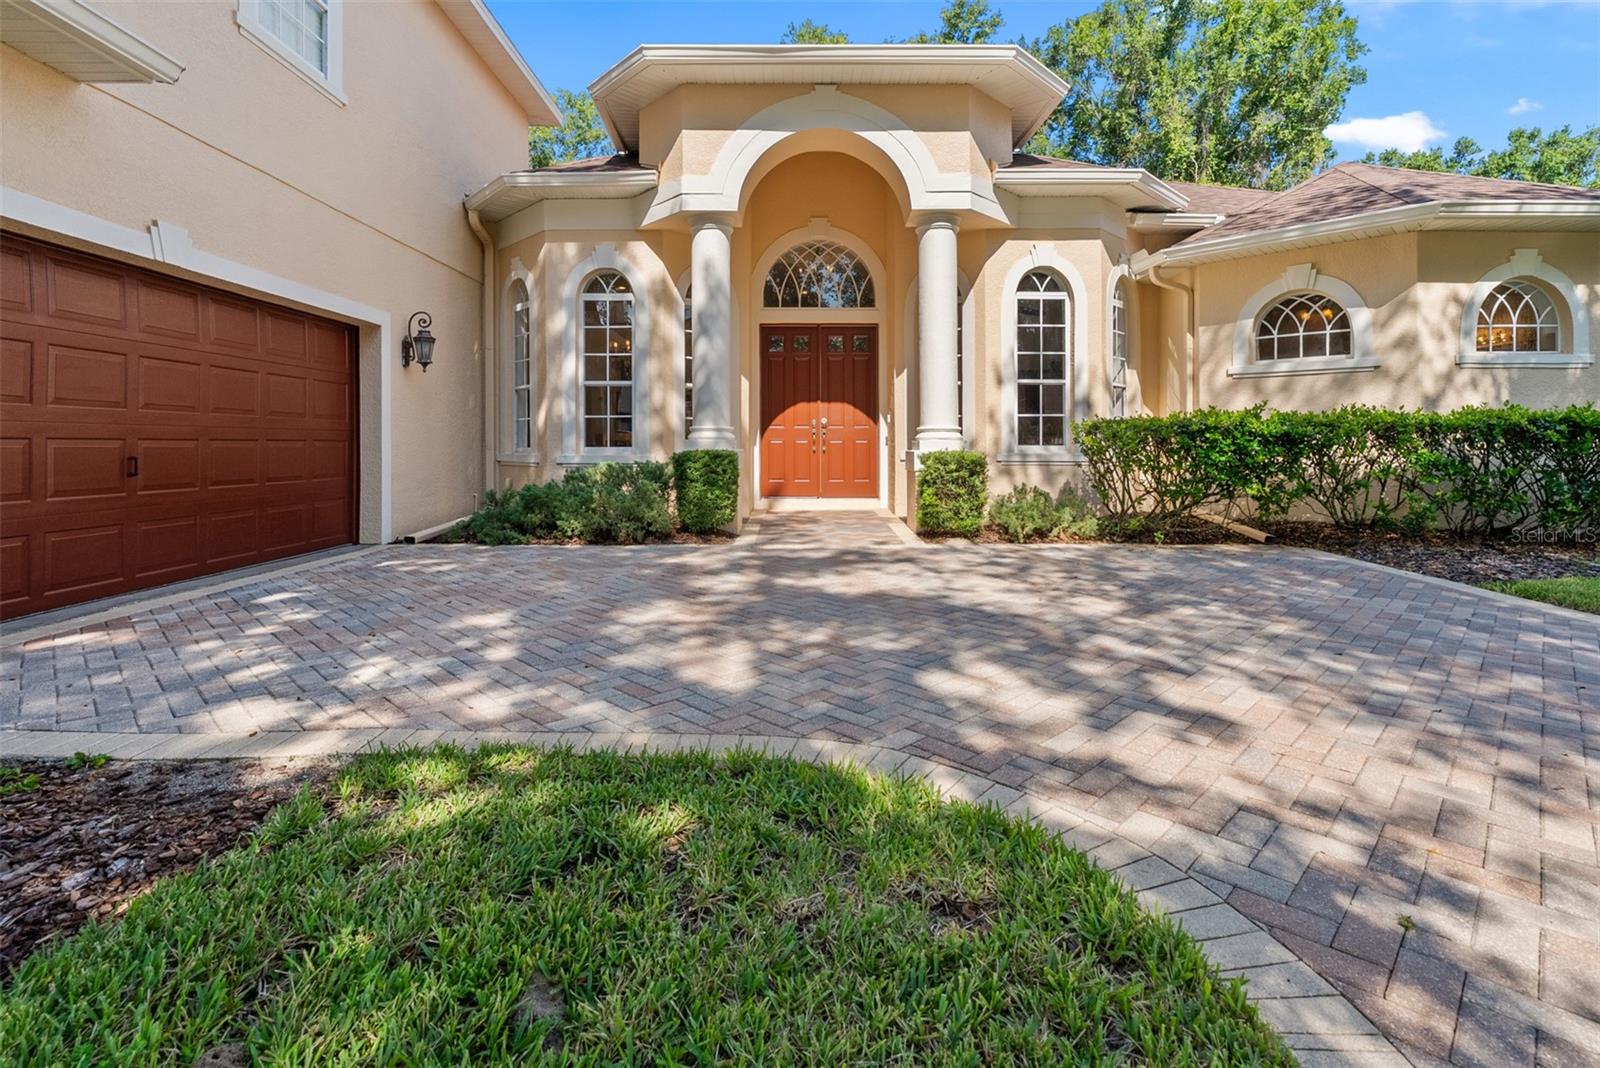
Property Description
Location, layout and an elevated Florida lifestyle. If this is your dream, welcome home! Tucked within Highland Oaks Preserve, a quiet, gated community of only 36 homes with NO CDD fee, and NO FLOOD ZONE REQUIREMENT. Step inside to discover a bright, open layout within nearly 3,000 square feet of interior living space. A wall of glass doors opens onto the covered lanai and screened pool area to further expand the living experience. The heart of the home is the gourmet kitchen, featuring wood-look tile flooring, granite countertops, stainless steel appliances a center prep island and full pantry. The 42” overhead cabinets are trimmed with crown molding. A cozy seating area is the perfect space for guests to relax and chat while your inner Martha Stewart takes over. If you prefer a more formal setting, the dining room will easily accommodate a 10-12 person table. Thoughtful design is evident as all common rooms overlook the screened, saltwater pool and outdoor living area in a way it feels as if the home hugs the outdoor space, lending a level of privacy not commonly found. All areas within the home flow seamlessly into one another—ideal for entertaining or relaxed everyday living. Whether you work remotely or just need a space to close the 8 foot double doors and call your own, look no further as this home offers a perfect space for a home office, craft room or playroom. The primary suite has a recessed private entry leading to a bedroom area large enough for seating and relaxation in addition to a king bed. The ensuite bathroom is a WOW with two sided walk-in entry with dual showers. The centrally placed soaking bathtub separates two sink and vanity areas with plentiful counter and cabinet space. Did we mention the closets are custom designed by California Closets? The split floor plan with two additional downstairs bedrooms and full bath allow for privacy for all. The second level of the home is a spacious 17’x14’ ensuite perfect for extended guests, or returning college student, complete with a private bath, walk-in closet and Juliet balcony. The laundry room includes a front load washer and dryer and is conveniently located at the interior entry from the garage. Additional amenities of the home include a paver driveway leading to a side entry oversized 2 car garage, central vacuum, zoned irrigation, 5 ton HVAC replaced in 2020. Convenient to I-75, and minutes from Tampa Premium Outlets offering top brand shopping, dining and events. Downtown Tampa is 35 minutes for sporting events, arts and entertainment in addition to Tampa International Airport. Homes within Highland Oaks Preserve historically sell quickly with this being the only home currently available. We look forward to seeing you!
Build Your Team
Quickly find investor-friendly professionals who can help you succeed in real estate investing at any stage of the investing journey.


Agents
Match with investor-friendly agents who can help you find, analyze, and close your next deal


Lenders
Get the best funding…find investor-friendly lenders who specialize in your deal strategy


Property Managers
Transition to passive investing. Find a trusted property management partnership that lasts.


Tax Pros & Accountants
Taxes and financial reporting made easy—find experts to create tax savings strategies, file taxes, and more
Location
Property Details
Parking
- Description: Driveway, Garage Door Opener, Oversized, Workshop in Garage
- Details: Driveway, Garage Door Opener, Garage Faces Side, Oversized, Attached
- Garage Spaces: 2
- Spaces Total: 0
Bedroom Information
- # of Bedrooms: 4
Bathroom Information
- # of Baths (Full): 3
- # of Baths (Total): 3.0
Interior Features
- # of Rooms: 13
- # of Stories: 2
Exterior Features
- Exterior Walls Materials: Stucco
- Foundation: Slab
- Roof Type: Gable
- Roof Material: Shingle
- Pool: Yes
HOA
- Has HOA: Yes
- Association: Doyle & McGrath/Nikki Burkett
- HOA Fee: $186/monthly
Land Information
- Land Use: Residential
- Land Use Subtype: Single Family Residential
Lot Information
- Parcel ID: 3226190130000000080
- Lot Size: 9200 sqft
Property Information
- Property Type: Single Family Residence
- Style: Traditional
- Year Built: 2005
Tax Information
- Annual Tax: $5,281
Utilities
- Water & Sewer: Public
- Heating: Central, Electric
- Cooling: Central Air
Location
- County: Pasco
Listing Details
Investment Summary
- Monthly Cash Flow
- -$1,733
- Cap Rate
- 2.9%
- Cash-on-Cash Return
- -14.0%
- Debt Coverage Ratio
- 0.48
- Internal Rate of Return (5 years)
- -9.5%
Cash Flow
Net Operating Income (NOI) minus mortgage payments.
Calculation:
NOI - Mortgage Payments
Cap Rate (Market Value)
Capitalization Rate is a rate of return that compares the yearly Net Operating Income (NOI) to the market value.
Calculation:
NOI / Market Value
Cash-on-Cash Return (CoC)
Annual Cash Flow / Cash Invested
Calculation:
Annual cash flow divided by initial cash invested.
Debt Coverage Ratio (DCR)
Net Operating Income (NOI) divided by total debt payments.
Calculation:
NOI / Total Debt Payments
Internal Rate of Return (IRR)
A metric for assessing profitability over time. IRR is the discount rate at which the net present value (NPV) of all future cash flows (positive and negative) from an investment equals zero — including both periodic cash flow (such as rent) and a projected sale at the end of the holding period. It represents the expected annualized return, accounting for income, expenses, and the recovery of capital through a future sale.
Purchase Details
Purchase PriceThe price paid for the property. Purchase price:
| $647,000 |
|---|---|
Amount FinancedThe amount of the purchase financed through a loan. Amount financed:
| -$517,600 |
Down paymentThe initial payment made towards the purchase. Down payment:
| $129,400 |
Closing CostsFees and expenses associated with purchasing a property, typically ranging from 2% to 5% of the home’s purchase price, paid at the end of a home purchase to cover services like lending, title transfer, and taxes. Closing costs:
| $19,410 |
Rehab CostsCosts incurred to repair or improve the property, including: roof, flooring, exterior siding, kitchen, exterior paint, bathrooms, etc. Rehab costs:
| $0 |
Initial Cash InvestedThe total initial cash invested in the property. Calculation:Down payment + Buying costs + Rehab costs Initial cash invested:
| $148,810 |
Square Feet (SQFT)The total square footage of the property. Square feet:
| 2,975 |
Cost Per Square FootCost per square foot of the property. Calculation:Purchase Price / Square Feet Cost per square foot:
| $217 |
Monthly Rent Per Square FootMonthly rent divided by the number of square feet. This ratio helps investors compare rental income efficiency across properties, markets, and unit sizes Calculation:Monthly Rent / Square Feet Monthly rent per square foot:
| $1.08 |
Financing Details
Loan AmountThe total sum of money borrowed from a lender to finance a property purchase. Calculation:Purchase Price - Down Payment
Loan amount:
| $517,600 |
|---|---|
Loan to Value Ratio (LTV)Loan amount divided by the market value of the property. Calculation:Loan Amount / Market Value
Loan to value ratio:
| 80.0% |
Loan TypeThe type of loan (e.g., fixed, adjustable).
Loan type:
| Amortizing |
TermThe loan repayment period in years.
Term:
| 30 years |
Interest RateThe percentage a lender charges on the borrowed amount of a loan, determining the cost of borrowing money.
Interest rate:
| 6.625% |
Principal & Interest (PI)The principal is the portion of the loan payment that reduces the loan balance. The interest is the lender's charge for borrowing money. Calculation:(P * r * (1 + r) ** n) / ((1 + r) ** n - 1) Where:
P = Loan amount (principal)
Principal & interest:
| $3,314 |
Property TaxesAnnual taxes levied by local governments on real estate properties. These taxes fund public services like schools, roads, and emergency services.
Property tax:
| $440 |
InsuranceThe costs for insurance coverage to protect against financial losses due to risks like fire, natural disasters, theft, liability, or tenant-related damages. Calculation:Assumes 7% of gross rental income, unless insurance rates are specified.
Insurance:
| $224 |
Private Mortgage Insurance (PMI)A fee that borrowers pay when they take out a conventional loan with a loan-to-value (LTV) ratio above 80%.
Private mortgage insurance (PMI):
| $0 |
Monthly PaymentThe fixed amount a borrower pays each month to repay a loan. It typically includes principal and interest (P&I) and may also cover property taxes, insurance, HOA fees, and PMI if escrowed. Monthly payment:
| $3,978 |
Operating Income
| % Rent | Monthly | Yearly | |
|---|---|---|---|
Gross RentThe total rental income received from tenants before deducting any expenses. Includes base rent, late fees, pet fees, parking fees, and other recurring charges.
Gross rent:
| $3,200 | $38,400 | |
Vacancy LossExpected loss of rent due to vacancies.
Vacancy loss:
(6%)
| 6% | -$192 | -$2,304 |
Operating IncomeGross rental income minus vacancy loss. Calculation:Gross rent - Vacancy loss
Operating income:
| $3,008 | $36,096 |
Operating Expenses
| % Rent | Monthly | Yearly | |
|---|---|---|---|
Property TaxesAnnual taxes levied by local governments on real estate properties. These taxes fund public services like schools, roads, and emergency services. | 14% | -$440 | -$5,281 |
InsuranceThe costs for insurance coverage to protect against financial losses due to risks like fire, natural disasters, theft, liability, or tenant-related damages. Calculation:Assumes 7% of gross rental income, unless insurance rates are specified. | 7% | -$224 | -$2,688 |
Property ManagementThe costs associated with hiring a property manager to handle the day-to-day operations of a rental property. Includes management fees, leasing fes, eviction fees, etc. Calculation:Assumes 8% of gross rental income. | 8% | -$256 | -$3,072 |
Repairs & MaintenanceOngoing costs for routine upkeep and minor fixes needed to keep a property in good working condition. Calculation:Assumes 5% of gross rental income. Varies by property age and condition. | 5% | -$160 | -$1,920 |
Capital ExpensesLarge, infrequent costs for major improvements or replacements, like a new roof, HVAC system, or appliances. Calculation:Assumes 5% of gross rental income. Varies by property age. | 5% | -$160 | -$1,920 |
HOA FeesRegular dues paid to a Homeowners Association for community maintenance, amenities, and management. Similar fees include: Condo Association Fees, Co-op Maintenance Fees, etc. | 6% | -$187 | -$2,244 |
Operating ExpensesRecurring costs required to maintain and manage a rental property, including property taxes, insurance, maintenance, repairs, utilities (if paid by the owner), property management fees, and other day-to-day expenses. Calculation:Insurance + Property Taxes + Property Management + Repairs & Maintenance + Capital Expenditures + HOA Fees | 45% | -$1,427 | -$17,125 |
Cash Flow
| Monthly | Yearly | |
|---|---|---|
Net Operating Income (NOI)The income generated from a property after deducting all operating expenses but before deducting mortgage payments, taxes, and capital expenditures. Calculation:Gross Operating Income - Operating Expenses
Net operating income:
| $1,581 | $18,972 |
Mortgage PaymentThe fixed amount a borrower pays each month to repay a loan. It typically includes principal and interest (P&I) and may also cover property taxes, insurance, HOA fees, and PMI if escrowed. | -$3,314 | -$39,768 |
Cash FlowNet Operating Income (NOI) minus mortgage payments. Calculation:NOI - Mortgage Payments | -$1,733 | -$20,796 |