


$585,000
Investment Summary
- Monthly Cash Flow
- -$1,844
- Cap Rate
- 1.9%
- Cash-on-Cash Return
- -16.4%
- Debt Coverage Ratio
- 0.33
- Internal Rate of Return (5 years)
- -11.9%
Cash Flow
Net Operating Income (NOI) minus mortgage payments.
Calculation:
NOI - Mortgage Payments
Cap Rate (Market Value)
Capitalization Rate is a rate of return that compares the yearly Net Operating Income (NOI) to the market value.
Calculation:
NOI / Market Value
Cash-on-Cash Return (CoC)
Annual Cash Flow / Cash Invested
Calculation:
Annual cash flow divided by initial cash invested.
Debt Coverage Ratio (DCR)
Net Operating Income (NOI) divided by total debt payments.
Calculation:
NOI / Total Debt Payments
Internal Rate of Return (IRR)
A metric for assessing profitability over time. IRR is the discount rate at which the net present value (NPV) of all future cash flows (positive and negative) from an investment equals zero — including both periodic cash flow (such as rent) and a projected sale at the end of the holding period. It represents the expected annualized return, accounting for income, expenses, and the recovery of capital through a future sale.
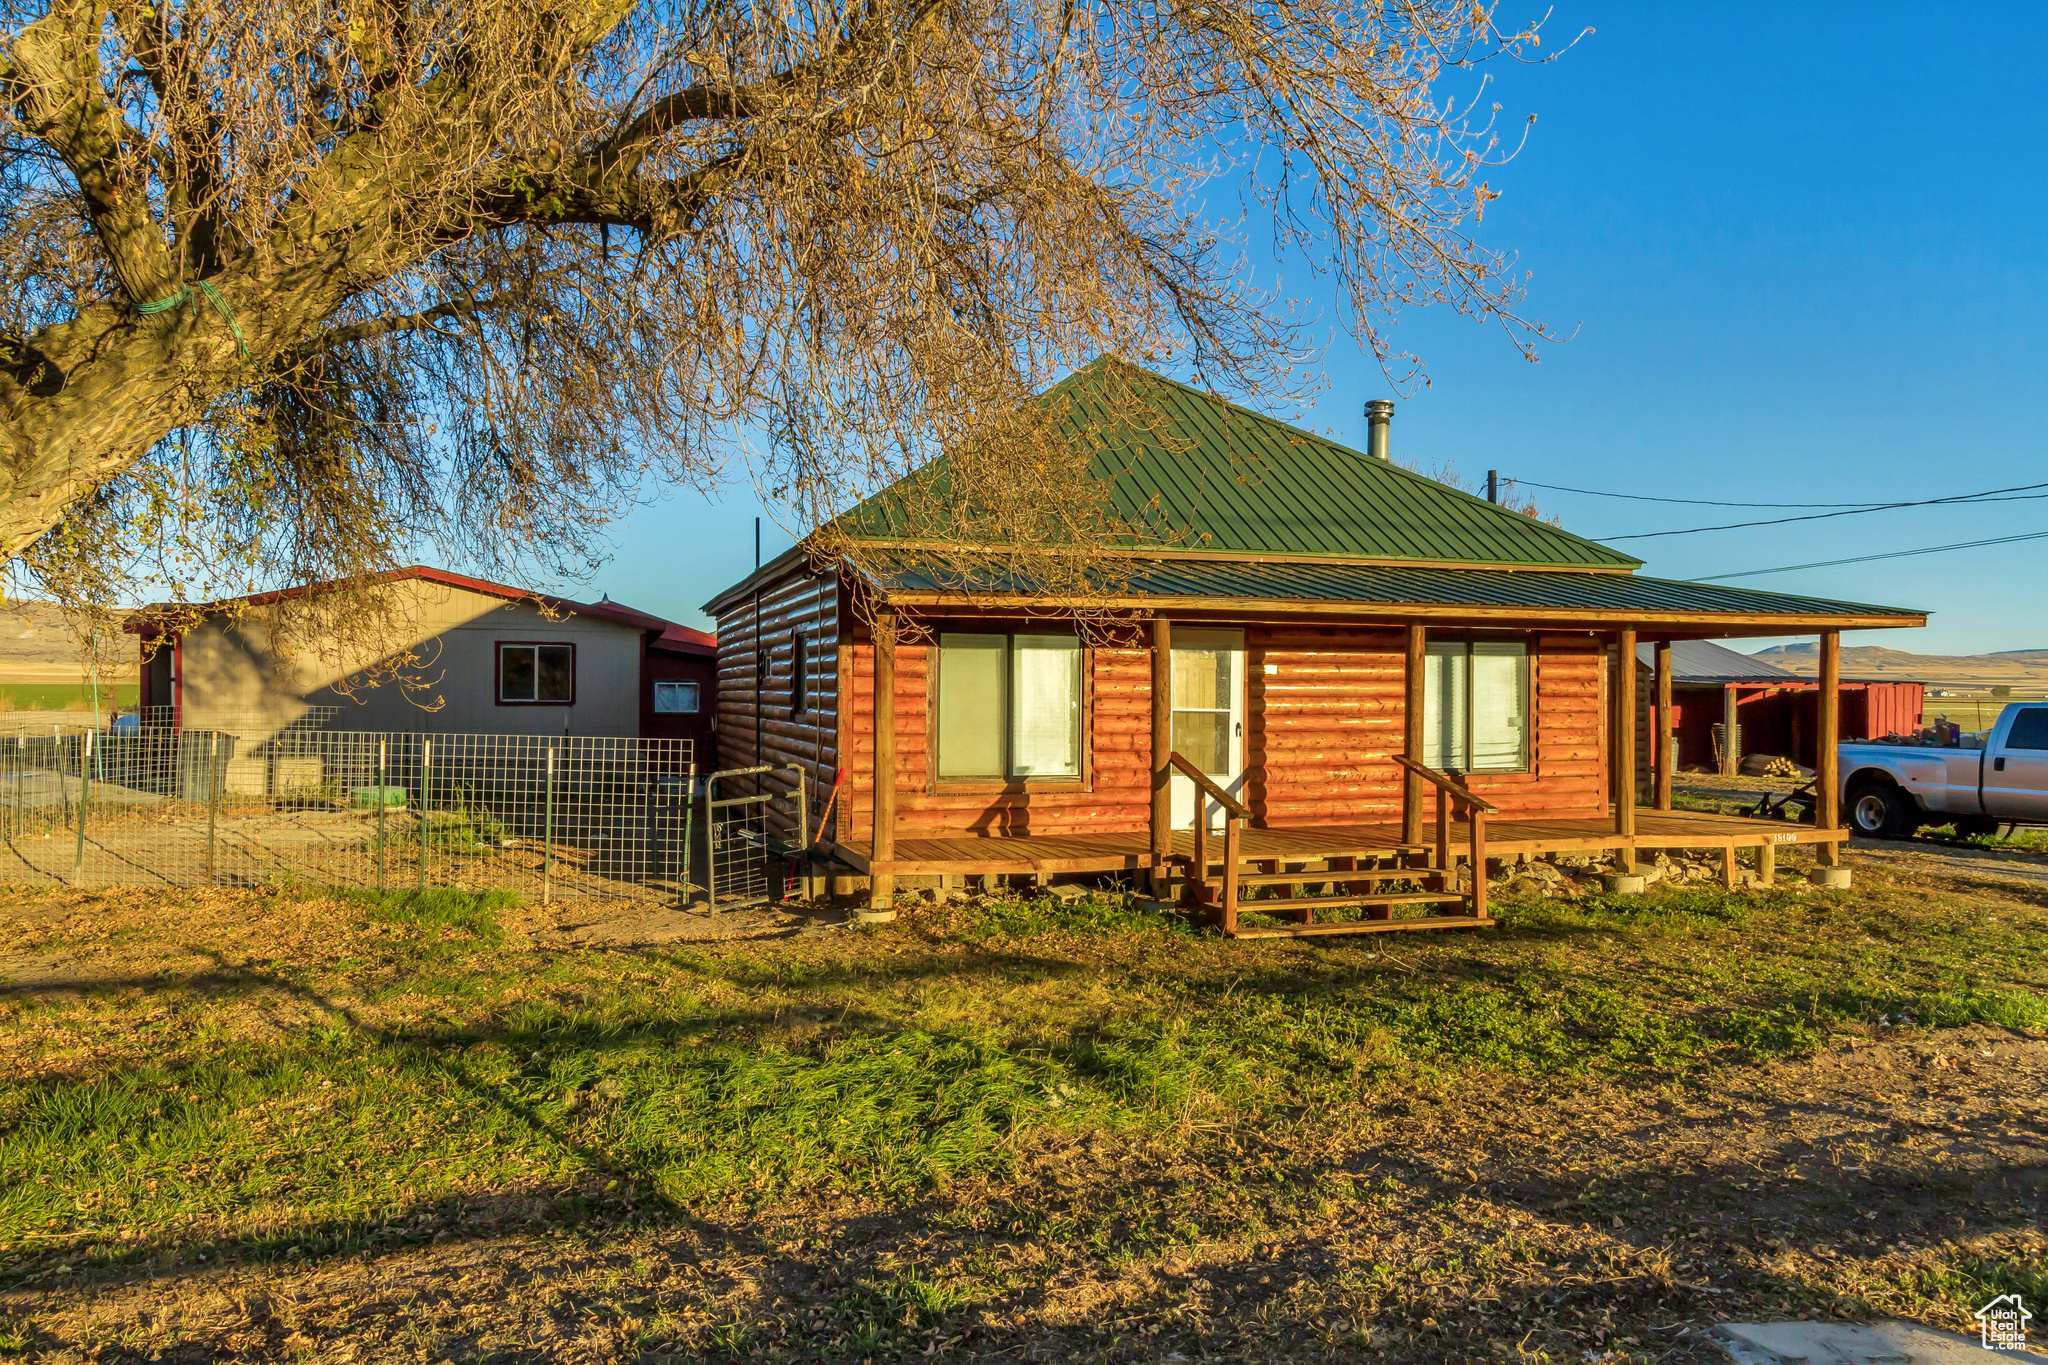
Property Description
Two homes for the price of one! This 2.83-acre hobby farm has room for all your vehicles, trailers, tools, toys, and animals and brings in rental income to offset your monthly mortgage. The West home is low maintenance with log siding a metal roof and an incredible covered wrap-around porch to watch the sunset on. The West home is approximately 1,300 square feet. It has two bedrooms and one bathroom. It has a massive walk-in shower, a wood-burning fireplace, a laundry room, a dedicated hot water heater, a dedicated power meter, a dedicated electric central furnace, and a dedicated culinary water connection from Ukon Water Company in Fielding. The East home is approximately 2,000 square feet. It has five bedrooms and two bathrooms. It has a huge living room/kitchen area with vaulted ceilings, a laundry room, a giant mudroom, a dedicated hot water heater, a dedicated propane central furnace, a dedicated power meter, and a dedicated culinary water connection from Ukon Water Company in Fielding. A full remodel was recently completed, which included a new kitchen, new bathrooms, new fixtures, new paint, and new flooring throughout. There are a total of four different pasture areas, there is a detached two-car garage with power and an automatic door opener, a second detached 25X25 one-car garage with a combined shop that has power, a massive 60x50 barn with power, a chicken coop, a 45X40 workshop with HVAC, dedicated power meter, water, etc, and two sturdy livestock shelters in the pastures to keep your animals out of the weather. In the East pasture, there is an underground water well with a solid pump house, and included in the sale is water right #29-3776 at 4.77 ACFT, including .82 acres of irrigation water and 5 ELUs of stock water. The property has previously hosted cattle, horses, sheep, goats, chickens, ducks, turkeys, a peacock, and pigs. The property is currently being used as a rental investment, and there is professional property management in place. The property manager is willing to stay on with a new owner upon request. The West home is currently leased until 06/30/2026, and the monthly gross revenue is $1,450.00 per month. The East home is currently leased until 09/30/2026 , and the monthly gross revenue is $1,575.00 per month. The barn is currently leased at $300 per month. Annual gross income is just shy of $40,000 per year. All current leases can be canceled with a 30-day notice upon the sale. The new owner could also occupy a portion of the property and lease out the rest. Parcel 07-028-0004 is adjacent to the M&J Mobile Home Community, including Parcel 07-028-0016 and 07-028-0003. See also WFRMLS# 2046270, WFRMLS# 2046271, WFRMLS# 2046285, WFRMLS# 2046301, WFRMLS# 2046317, WFRMLS# 2046318, WFRMLS# 2046319
Build Your Team
Quickly find investor-friendly professionals who can help you succeed in real estate investing at any stage of the investing journey.


Agents
Match with investor-friendly agents who can help you find, analyze, and close your next deal


Lenders
Get the best funding…find investor-friendly lenders who specialize in your deal strategy


Property Managers
Transition to passive investing. Find a trusted property management partnership that lasts.


Tax Pros & Accountants
Taxes and financial reporting made easy—find experts to create tax savings strategies, file taxes, and more
Location
Property Details
Parking
- Details: Covered, RV Access/Parking
- Garage Spaces: 2
- Spaces Total: 2
Bedroom Information
- # of Bedrooms: 7
Bathroom Information
- # of Baths (Full): 2
- # of Baths (Total): 3.0
Interior Features
- # of Rooms: 17
- # of Stories: 2
- Basement: Yes
- Basement Description: None
- Fireplace: Yes
Exterior Features
- Exterior Walls Materials: Wood
- Roof Material: Asphalt, Metal
Land Information
- Land Use: Residential
- Land Use Subtype: Single Family Residential
Lot Information
- Parcel ID: 070280004
- Lot Size: 123274 sqft
Property Information
- Property Type: Single Family Residence
- Style: Rambler/Ranch
- Year Built: 1980
Tax Information
- Annual Tax: $2,159
Utilities
- Water & Sewer: Private, Well
- Heating: Central, Natural Gas, Wood Stove, Forced Air, Wood
- Cooling: None
Location
- County: Box Elder
Listing Details
Investment Summary
- Monthly Cash Flow
- -$1,844
- Cap Rate
- 1.9%
- Cash-on-Cash Return
- -16.4%
- Debt Coverage Ratio
- 0.33
- Internal Rate of Return (5 years)
- -11.9%
Cash Flow
Net Operating Income (NOI) minus mortgage payments.
Calculation:
NOI - Mortgage Payments
Cap Rate (Market Value)
Capitalization Rate is a rate of return that compares the yearly Net Operating Income (NOI) to the market value.
Calculation:
NOI / Market Value
Cash-on-Cash Return (CoC)
Annual Cash Flow / Cash Invested
Calculation:
Annual cash flow divided by initial cash invested.
Debt Coverage Ratio (DCR)
Net Operating Income (NOI) divided by total debt payments.
Calculation:
NOI / Total Debt Payments
Internal Rate of Return (IRR)
A metric for assessing profitability over time. IRR is the discount rate at which the net present value (NPV) of all future cash flows (positive and negative) from an investment equals zero — including both periodic cash flow (such as rent) and a projected sale at the end of the holding period. It represents the expected annualized return, accounting for income, expenses, and the recovery of capital through a future sale.
Purchase Details
Purchase PriceThe price paid for the property. Purchase price:
| $585,000 |
|---|---|
Amount FinancedThe amount of the purchase financed through a loan. Amount financed:
| -$468,000 |
Down paymentThe initial payment made towards the purchase. Down payment:
| $117,000 |
Closing CostsFees and expenses associated with purchasing a property, typically ranging from 2% to 5% of the home’s purchase price, paid at the end of a home purchase to cover services like lending, title transfer, and taxes. Closing costs:
| $17,550 |
Rehab CostsCosts incurred to repair or improve the property, including: roof, flooring, exterior siding, kitchen, exterior paint, bathrooms, etc. Rehab costs:
| $0 |
Initial Cash InvestedThe total initial cash invested in the property. Calculation:Down payment + Buying costs + Rehab costs Initial cash invested:
| $134,550 |
Square Feet (SQFT)The total square footage of the property. Square feet:
| 3,300 |
Cost Per Square FootCost per square foot of the property. Calculation:Purchase Price / Square Feet Cost per square foot:
| $177 |
Monthly Rent Per Square FootMonthly rent divided by the number of square feet. This ratio helps investors compare rental income efficiency across properties, markets, and unit sizes Calculation:Monthly Rent / Square Feet Monthly rent per square foot:
| $0.48 |
Financing Details
Loan AmountThe total sum of money borrowed from a lender to finance a property purchase. Calculation:Purchase Price - Down Payment
Loan amount:
| $468,000 |
|---|---|
Loan to Value Ratio (LTV)Loan amount divided by the market value of the property. Calculation:Loan Amount / Market Value
Loan to value ratio:
| 80.0% |
Loan TypeThe type of loan (e.g., fixed, adjustable).
Loan type:
| Amortizing |
TermThe loan repayment period in years.
Term:
| 30 years |
Interest RateThe percentage a lender charges on the borrowed amount of a loan, determining the cost of borrowing money.
Interest rate:
| 5.875% |
Principal & Interest (PI)The principal is the portion of the loan payment that reduces the loan balance. The interest is the lender's charge for borrowing money. Calculation:(P * r * (1 + r) ** n) / ((1 + r) ** n - 1) Where:
P = Loan amount (principal)
Principal & interest:
| $2,768 |
Property TaxesAnnual taxes levied by local governments on real estate properties. These taxes fund public services like schools, roads, and emergency services.
Property tax:
| $180 |
InsuranceThe costs for insurance coverage to protect against financial losses due to risks like fire, natural disasters, theft, liability, or tenant-related damages. Calculation:Assumes 7% of gross rental income, unless insurance rates are specified.
Insurance:
| $112 |
Private Mortgage Insurance (PMI)A fee that borrowers pay when they take out a conventional loan with a loan-to-value (LTV) ratio above 80%.
Private mortgage insurance (PMI):
| $0 |
Monthly PaymentThe fixed amount a borrower pays each month to repay a loan. It typically includes principal and interest (P&I) and may also cover property taxes, insurance, HOA fees, and PMI if escrowed. Monthly payment:
| $3,060 |
Operating Income
| % Rent | Monthly | Yearly | |
|---|---|---|---|
Gross RentThe total rental income received from tenants before deducting any expenses. Includes base rent, late fees, pet fees, parking fees, and other recurring charges.
Gross rent:
| $1,600 | $19,200 | |
Vacancy LossExpected loss of rent due to vacancies.
Vacancy loss:
(6%)
| 6% | -$96 | -$1,152 |
Operating IncomeGross rental income minus vacancy loss. Calculation:Gross rent - Vacancy loss
Operating income:
| $1,504 | $18,048 |
Operating Expenses
| % Rent | Monthly | Yearly | |
|---|---|---|---|
Property TaxesAnnual taxes levied by local governments on real estate properties. These taxes fund public services like schools, roads, and emergency services. | 11% | -$180 | -$2,159 |
InsuranceThe costs for insurance coverage to protect against financial losses due to risks like fire, natural disasters, theft, liability, or tenant-related damages. Calculation:Assumes 7% of gross rental income, unless insurance rates are specified. | 7% | -$112 | -$1,344 |
Property ManagementThe costs associated with hiring a property manager to handle the day-to-day operations of a rental property. Includes management fees, leasing fes, eviction fees, etc. Calculation:Assumes 8% of gross rental income. | 8% | -$128 | -$1,536 |
Repairs & MaintenanceOngoing costs for routine upkeep and minor fixes needed to keep a property in good working condition. Calculation:Assumes 5% of gross rental income. Varies by property age and condition. | 5% | -$80 | -$960 |
Capital ExpensesLarge, infrequent costs for major improvements or replacements, like a new roof, HVAC system, or appliances. Calculation:Assumes 5% of gross rental income. Varies by property age. | 5% | -$80 | -$960 |
HOA FeesRegular dues paid to a Homeowners Association for community maintenance, amenities, and management. Similar fees include: Condo Association Fees, Co-op Maintenance Fees, etc. | n/a | n/a | n/a |
Operating ExpensesRecurring costs required to maintain and manage a rental property, including property taxes, insurance, maintenance, repairs, utilities (if paid by the owner), property management fees, and other day-to-day expenses. Calculation:Insurance + Property Taxes + Property Management + Repairs & Maintenance + Capital Expenditures + HOA Fees | 36% | -$580 | -$6,959 |
Cash Flow
| Monthly | Yearly | |
|---|---|---|
Net Operating Income (NOI)The income generated from a property after deducting all operating expenses but before deducting mortgage payments, taxes, and capital expenditures. Calculation:Gross Operating Income - Operating Expenses
Net operating income:
| $924 | $11,088 |
Mortgage PaymentThe fixed amount a borrower pays each month to repay a loan. It typically includes principal and interest (P&I) and may also cover property taxes, insurance, HOA fees, and PMI if escrowed. | -$2,768 | -$33,216 |
Cash FlowNet Operating Income (NOI) minus mortgage payments. Calculation:NOI - Mortgage Payments | -$1,844 | -$22,128 |