$565,000
Investment Summary
- Monthly Cash Flow
- -$1,218
- Cap Rate
- 3.6%
- Cash-on-Cash Return
- -11.2%
- Debt Coverage Ratio
- 0.58
- Internal Rate of Return (5 years)
- -6.9%
Cash Flow
Net Operating Income (NOI) minus mortgage payments.
Calculation:
NOI - Mortgage Payments
Cap Rate (Market Value)
Capitalization Rate is a rate of return that compares the yearly Net Operating Income (NOI) to the market value.
Calculation:
NOI / Market Value
Cash-on-Cash Return (CoC)
Annual Cash Flow / Cash Invested
Calculation:
Annual cash flow divided by initial cash invested.
Debt Coverage Ratio (DCR)
Net Operating Income (NOI) divided by total debt payments.
Calculation:
NOI / Total Debt Payments
Internal Rate of Return (IRR)
A metric for assessing profitability over time. IRR is the discount rate at which the net present value (NPV) of all future cash flows (positive and negative) from an investment equals zero — including both periodic cash flow (such as rent) and a projected sale at the end of the holding period. It represents the expected annualized return, accounting for income, expenses, and the recovery of capital through a future sale.
Property Description
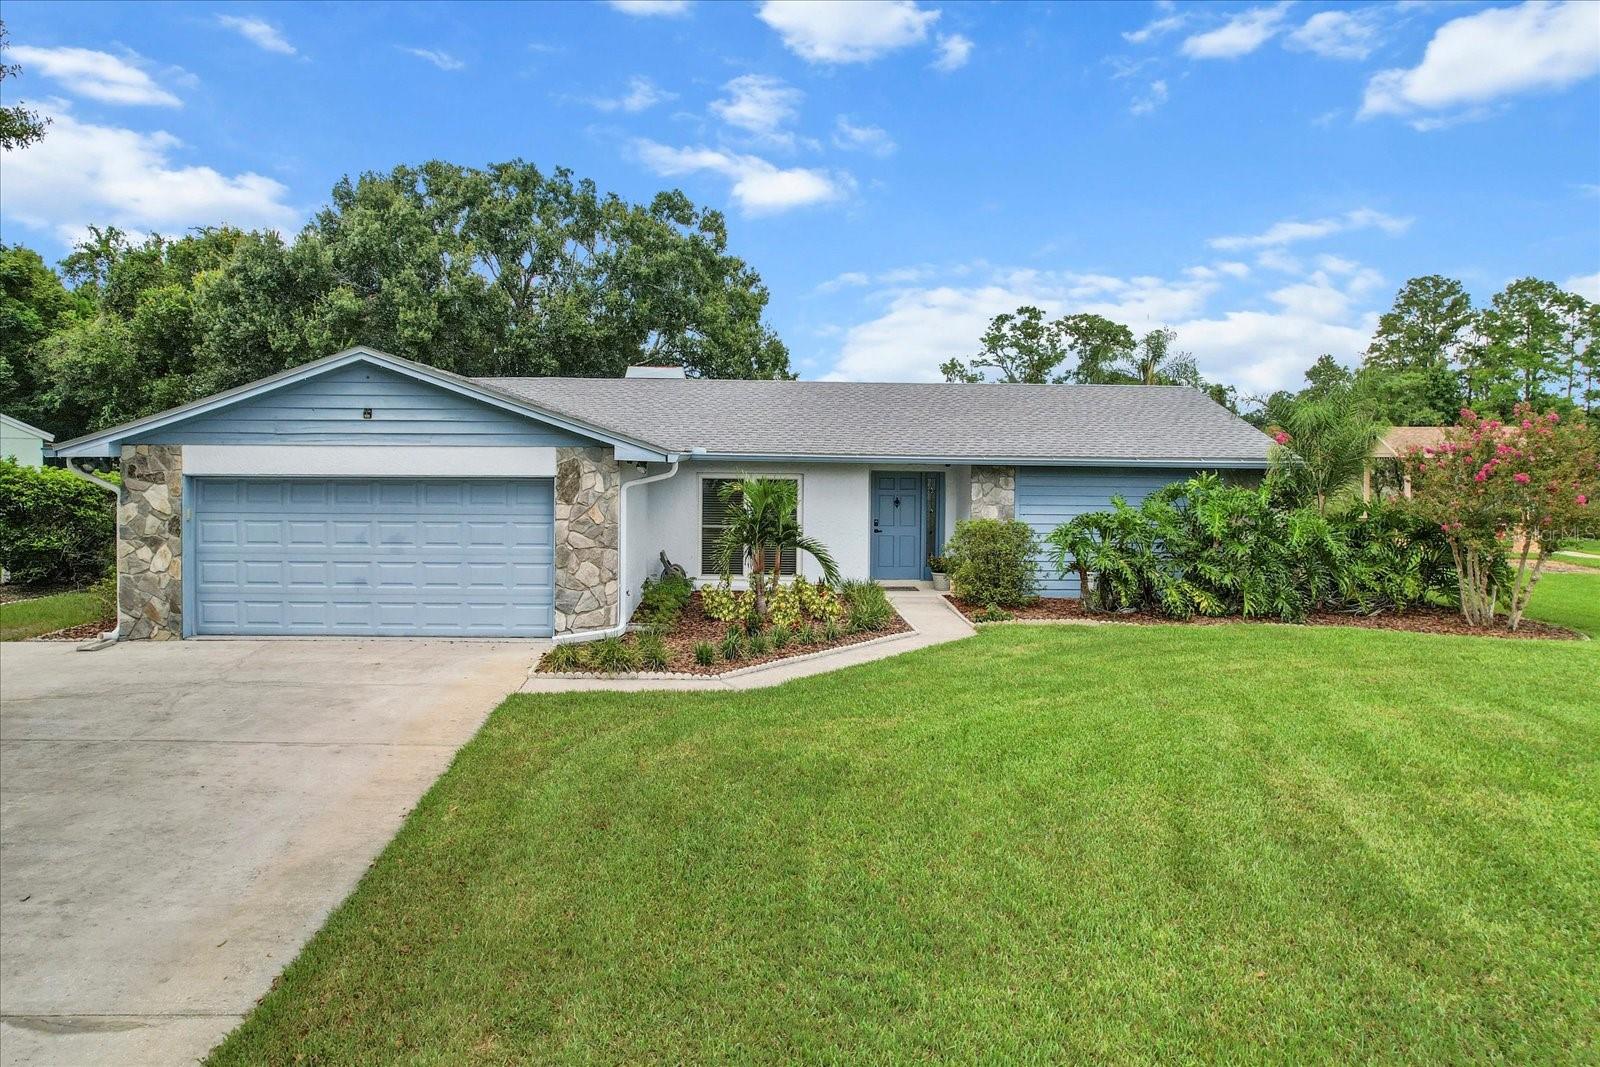
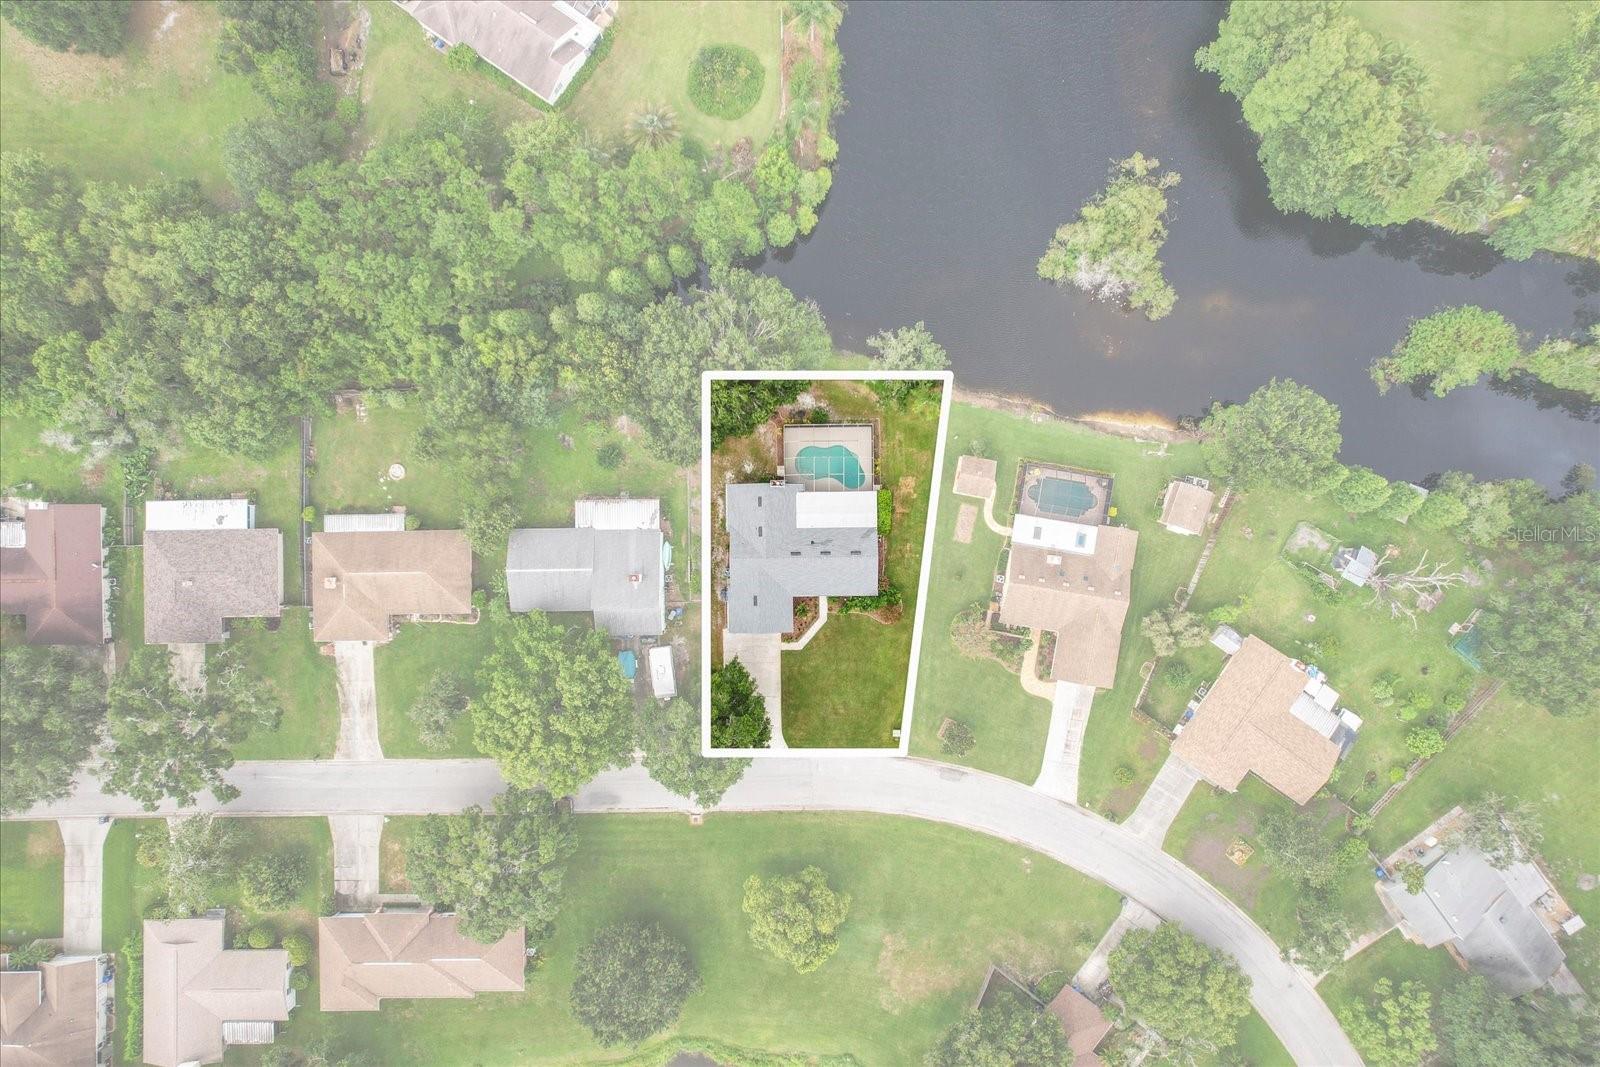
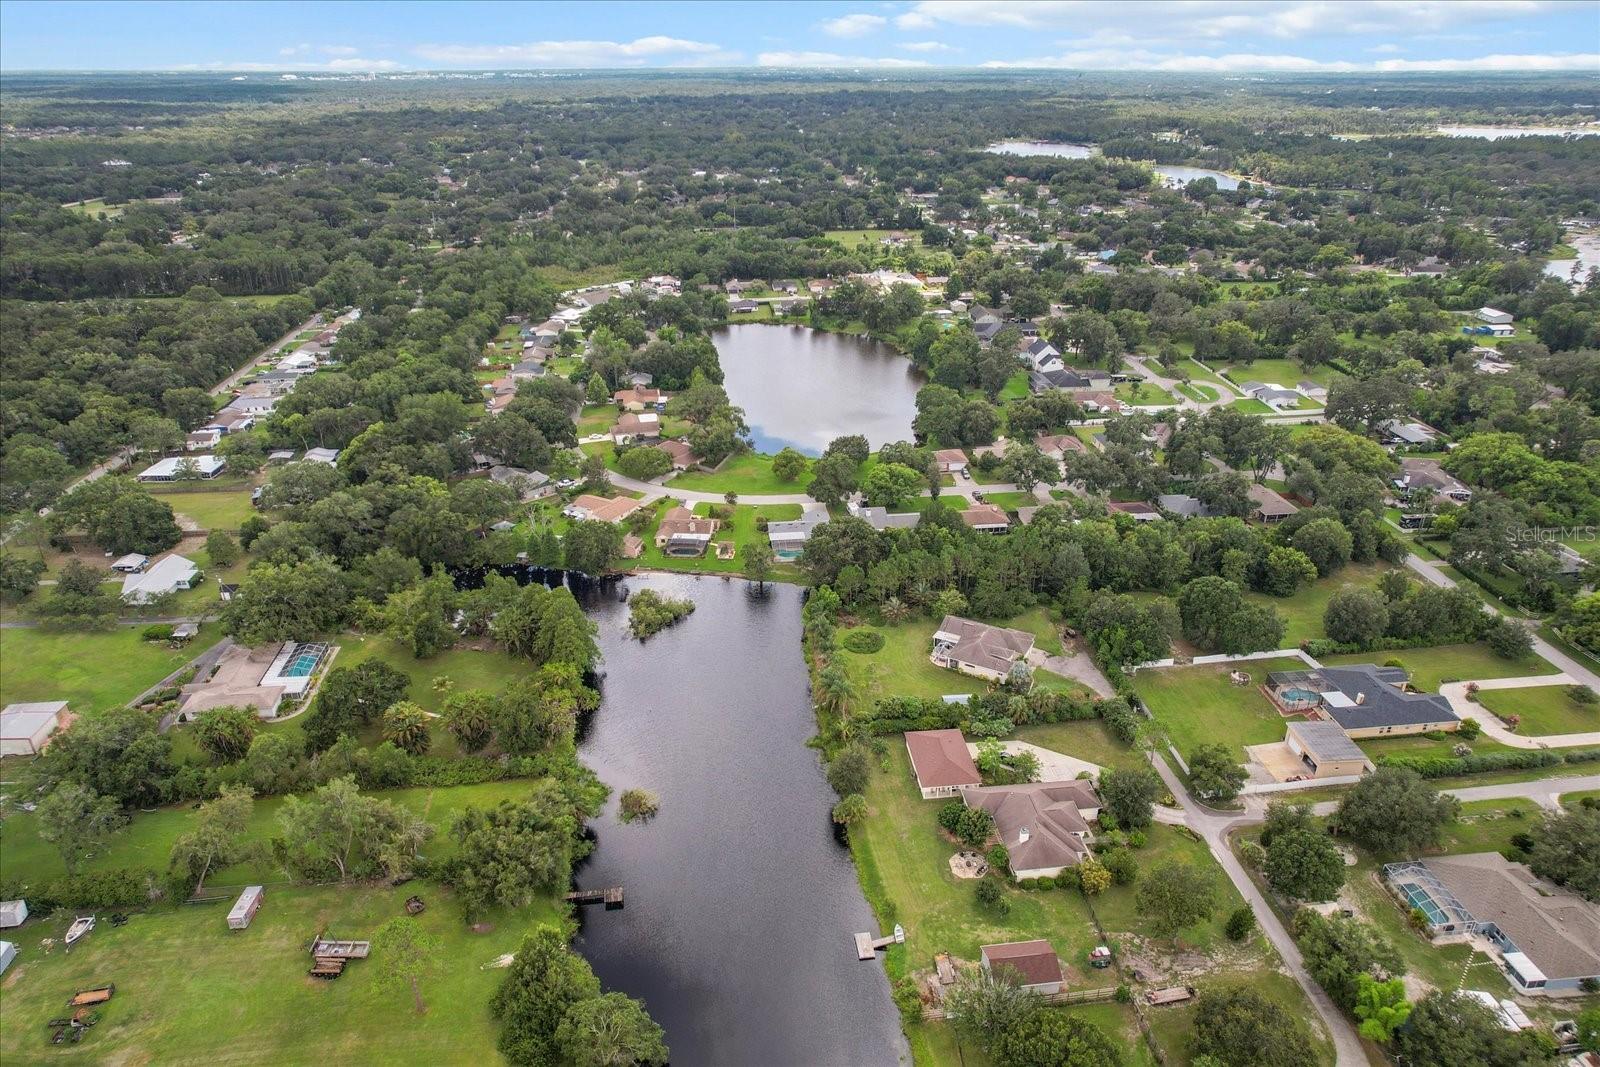
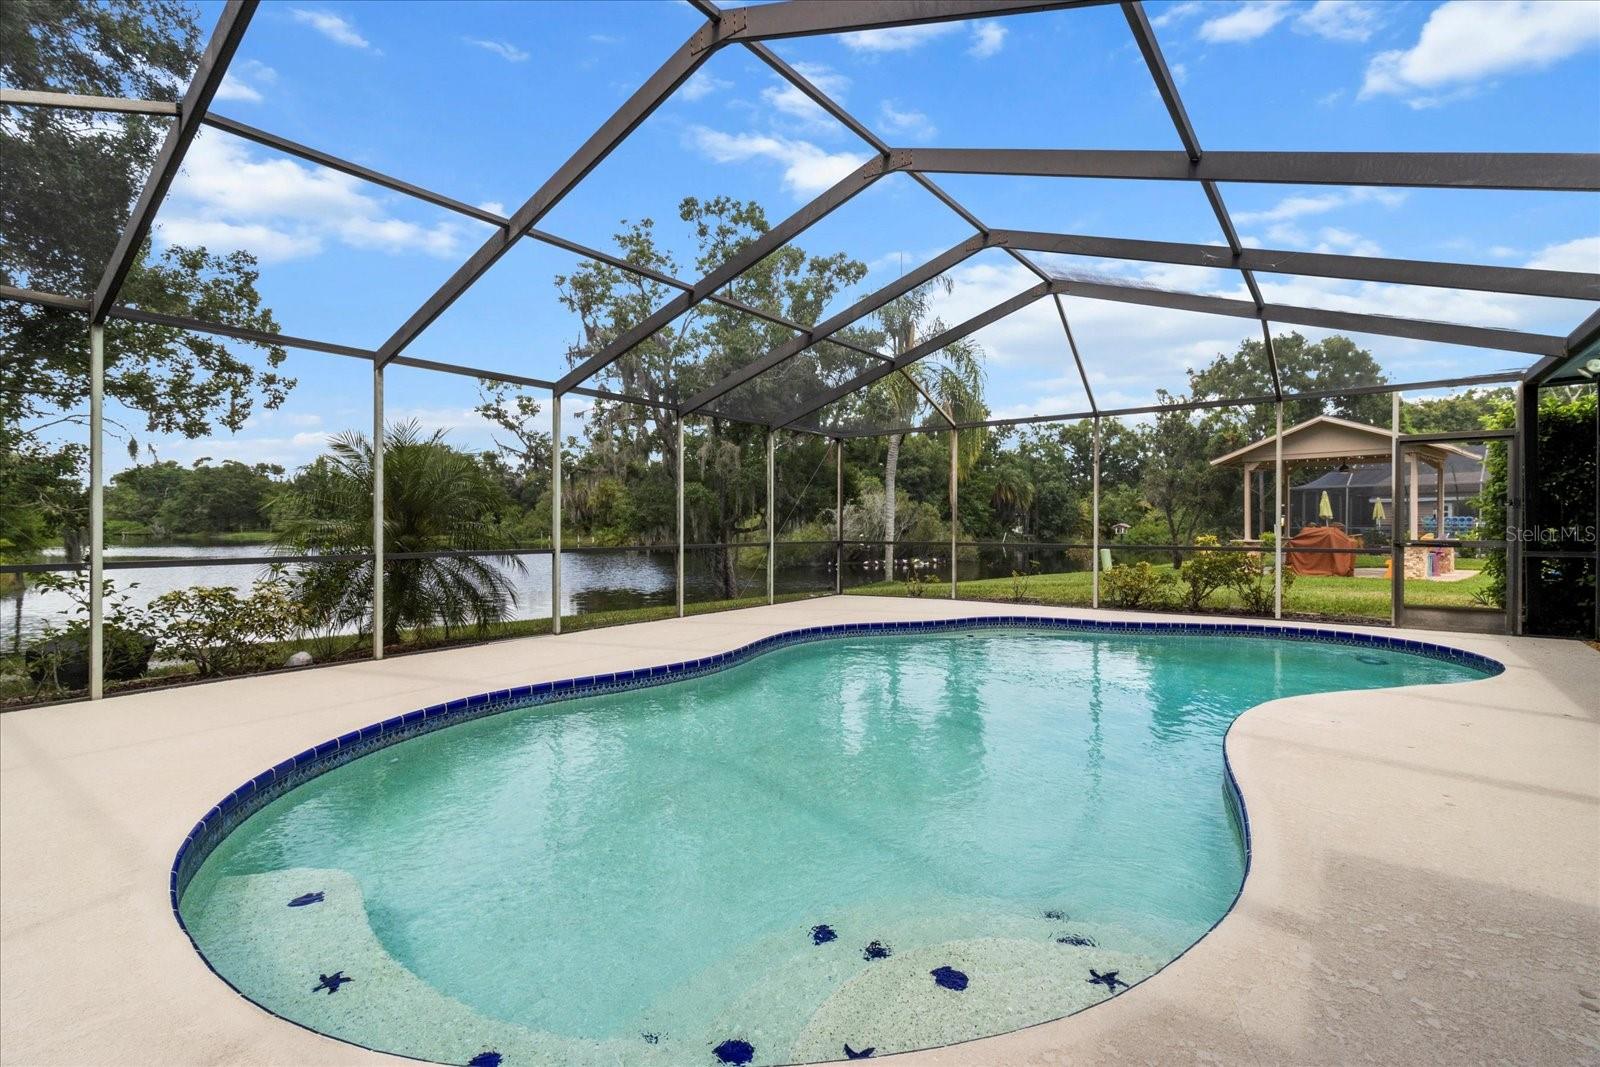
One or more photo(s) has been virtually staged. WOW!! Don’t miss this GORGEOUS updated POOL home with SPECTACULAR LAKEFRONT VIEWS- 3/2/2 POOL & Fireplace home containing almost 1800sf under air and 2730sf under roof with serene spring fed lake views from nearly every room! NO HOA, NO FLOOD ZONE, HURRICANE IMPACT WINDOWS, quiet no thru traffic street, a spacious 1/3 acre lot, HIGHLY RATED SCHOOLS, no neighbors behind or in front! The sellers have lovingly maintained this home for over 35 years and now is your chance to enjoy this special place. All big ticket items have been taken care of within the last few years for your peace of mind including the ROOF is only 2 yrs old, the Hurricane Impact Windows featurie a lifetime Transferrable warranty, newer septic/drainfield replaced, newer hot water heater, just serviced WATER SOFTENER, the POOL RESURFACED with PEBBLESHEEN, new pool light, all patio sliders have new rollers and locks replaced. FRESHLY PAINTED INTERIOR as well as ceilings resurfaced, NEW LPV flooring, baseboards, light fixtures, ceiling fans, door hardware, upgraded UV light in AC. The chef of the home will love the NEWLY UPDATED KITCHEN boasting NEW soft close cabinetry with wide crown molding, NEW recessed lighting, sleek Quartzite counters, NEW single bowl stainless sink and faucet. Separate laundry room also has extra pantry storage shelving for all the extras! Your master suite enjoys Waterviews, an ensuite with spacious walk in closet, double vanities and a nice size step in tiled shower with bench seat and heavy glass shower door. Both guest bedrooms are on the opposite side of the home for ultimate privacy with a hall bath in between. The guest bath was just updated as well with NEW modern tile, NEW bathtub and fixtures. Lots of natural light and good sized windows throughout the home for soaking in the views. The garage has NEW Epoxy Flooring with storage shelving and a workbench and Gladiator cabinets. San Rio Circle is a small enclave of homes around two spring fed lakes with only two homes having full Waterviews in back and in front of the home. A small dock could be added for fishing or take your kayak or Jon boat out. Imagine relaxing next to your large pool with a cool drink soaking in nature of beautiful birds, some fabulous sunsets or watching the little ones swim and play! Close to major highways so getting to downtown Tampa, hospitals or the airport is a breeze. Visiting beautiful sandy beaches are all easily reached in less than an hour, Bush Gardens, Tampa Zoo, Florida Aquarium, Sports Venues, golf courses, restaurants, breweries, Outlet and International Malls are all in easy reach. This won’t last long so come take a look! SPECIAL BUYER INCENTIVE! Sellers are offering a one year RATE BUY DOWN if using preferred lender so don’t forget to ask about it!
Build Your Team
Quickly find investor-friendly professionals who can help you succeed in real estate investing at any stage of the investing journey.


Agents
Match with investor-friendly agents who can help you find, analyze, and close your next deal


Lenders
Get the best funding…find investor-friendly lenders who specialize in your deal strategy


Property Managers
Transition to passive investing. Find a trusted property management partnership that lasts.


Tax Pros & Accountants
Taxes and financial reporting made easy—find experts to create tax savings strategies, file taxes, and more
Location
Property Details
Parking
- Description: Garage
- Details: Covered, Driveway, Garage Door Opener, Attached
- Garage Spaces: 2
- Spaces Total: 0
Bedroom Information
- # of Bedrooms: 3
Bathroom Information
- # of Baths (Full): 2
- # of Baths (Total): 2.0
Interior Features
- # of Rooms: 6
- # of Stories: 1
- Fireplace: Yes
Exterior Features
- Exterior Walls Materials: Stucco
- Foundation: Slab
- Roof Type: Gable or Hip
- Roof Material: Shingle
- Pool: Yes
Land Information
- Land Use: Residential
- Land Use Subtype: Single Family Residential
Lot Information
- Parcel ID: U07271919V000000000330
- Lot Size: 13524 sqft
Property Information
- Property Type: Single Family Residence
- Style: Ranch
- Year Built: 1986
Tax Information
- Annual Tax: $2,246
Utilities
- Water & Sewer: Public
- Heating: Central, Electric
- Cooling: Central Air
Location
- County: Hillsborough
Listing Details
Investment Summary
- Monthly Cash Flow
- -$1,218
- Cap Rate
- 3.6%
- Cash-on-Cash Return
- -11.2%
- Debt Coverage Ratio
- 0.58
- Internal Rate of Return (5 years)
- -6.9%
Cash Flow
Net Operating Income (NOI) minus mortgage payments.
Calculation:
NOI - Mortgage Payments
Cap Rate (Market Value)
Capitalization Rate is a rate of return that compares the yearly Net Operating Income (NOI) to the market value.
Calculation:
NOI / Market Value
Cash-on-Cash Return (CoC)
Annual Cash Flow / Cash Invested
Calculation:
Annual cash flow divided by initial cash invested.
Debt Coverage Ratio (DCR)
Net Operating Income (NOI) divided by total debt payments.
Calculation:
NOI / Total Debt Payments
Internal Rate of Return (IRR)
A metric for assessing profitability over time. IRR is the discount rate at which the net present value (NPV) of all future cash flows (positive and negative) from an investment equals zero — including both periodic cash flow (such as rent) and a projected sale at the end of the holding period. It represents the expected annualized return, accounting for income, expenses, and the recovery of capital through a future sale.
Purchase Details
Purchase PriceThe price paid for the property. Purchase price:
| $565,000 |
|---|---|
Amount FinancedThe amount of the purchase financed through a loan. Amount financed:
| -$452,000 |
Down paymentThe initial payment made towards the purchase. Down payment:
| $113,000 |
Closing CostsFees and expenses associated with purchasing a property, typically ranging from 2% to 5% of the home’s purchase price, paid at the end of a home purchase to cover services like lending, title transfer, and taxes. Closing costs:
| $16,950 |
Rehab CostsCosts incurred to repair or improve the property, including: roof, flooring, exterior siding, kitchen, exterior paint, bathrooms, etc. Rehab costs:
| $0 |
Initial Cash InvestedThe total initial cash invested in the property. Calculation:Down payment + Buying costs + Rehab costs Initial cash invested:
| $129,950 |
Square Feet (SQFT)The total square footage of the property. Square feet:
| 1,769 |
Cost Per Square FootCost per square foot of the property. Calculation:Purchase Price / Square Feet Cost per square foot:
| $319 |
Monthly Rent Per Square FootMonthly rent divided by the number of square feet. This ratio helps investors compare rental income efficiency across properties, markets, and unit sizes Calculation:Monthly Rent / Square Feet Monthly rent per square foot:
| $1.53 |
Financing Details
Loan AmountThe total sum of money borrowed from a lender to finance a property purchase. Calculation:Purchase Price - Down Payment
Loan amount:
| $452,000 |
|---|---|
Loan to Value Ratio (LTV)Loan amount divided by the market value of the property. Calculation:Loan Amount / Market Value
Loan to value ratio:
| 80.0% |
Loan TypeThe type of loan (e.g., fixed, adjustable).
Loan type:
| Amortizing |
TermThe loan repayment period in years.
Term:
| 30 years |
Interest RateThe percentage a lender charges on the borrowed amount of a loan, determining the cost of borrowing money.
Interest rate:
| 6.625% |
Principal & Interest (PI)The principal is the portion of the loan payment that reduces the loan balance. The interest is the lender's charge for borrowing money. Calculation:(P * r * (1 + r) ** n) / ((1 + r) ** n - 1) Where:
P = Loan amount (principal)
Principal & interest:
| $2,894 |
Property TaxesAnnual taxes levied by local governments on real estate properties. These taxes fund public services like schools, roads, and emergency services.
Property tax:
| $187 |
InsuranceThe costs for insurance coverage to protect against financial losses due to risks like fire, natural disasters, theft, liability, or tenant-related damages. Calculation:Assumes 7% of gross rental income, unless insurance rates are specified.
Insurance:
| $189 |
Private Mortgage Insurance (PMI)A fee that borrowers pay when they take out a conventional loan with a loan-to-value (LTV) ratio above 80%.
Private mortgage insurance (PMI):
| $0 |
Monthly PaymentThe fixed amount a borrower pays each month to repay a loan. It typically includes principal and interest (P&I) and may also cover property taxes, insurance, HOA fees, and PMI if escrowed. Monthly payment:
| $3,270 |
Operating Income
| % Rent | Monthly | Yearly | |
|---|---|---|---|
Gross RentThe total rental income received from tenants before deducting any expenses. Includes base rent, late fees, pet fees, parking fees, and other recurring charges.
Gross rent:
| $2,700 | $32,400 | |
Vacancy LossExpected loss of rent due to vacancies.
Vacancy loss:
(6%)
| 6% | -$162 | -$1,944 |
Operating IncomeGross rental income minus vacancy loss. Calculation:Gross rent - Vacancy loss
Operating income:
| $2,538 | $30,456 |
Operating Expenses
| % Rent | Monthly | Yearly | |
|---|---|---|---|
Property TaxesAnnual taxes levied by local governments on real estate properties. These taxes fund public services like schools, roads, and emergency services. | 7% | -$187 | -$2,247 |
InsuranceThe costs for insurance coverage to protect against financial losses due to risks like fire, natural disasters, theft, liability, or tenant-related damages. Calculation:Assumes 7% of gross rental income, unless insurance rates are specified. | 7% | -$189 | -$2,268 |
Property ManagementThe costs associated with hiring a property manager to handle the day-to-day operations of a rental property. Includes management fees, leasing fes, eviction fees, etc. Calculation:Assumes 8% of gross rental income. | 8% | -$216 | -$2,592 |
Repairs & MaintenanceOngoing costs for routine upkeep and minor fixes needed to keep a property in good working condition. Calculation:Assumes 5% of gross rental income. Varies by property age and condition. | 5% | -$135 | -$1,620 |
Capital ExpensesLarge, infrequent costs for major improvements or replacements, like a new roof, HVAC system, or appliances. Calculation:Assumes 5% of gross rental income. Varies by property age. | 5% | -$135 | -$1,620 |
HOA FeesRegular dues paid to a Homeowners Association for community maintenance, amenities, and management. Similar fees include: Condo Association Fees, Co-op Maintenance Fees, etc. | n/a | n/a | n/a |
Operating ExpensesRecurring costs required to maintain and manage a rental property, including property taxes, insurance, maintenance, repairs, utilities (if paid by the owner), property management fees, and other day-to-day expenses. Calculation:Insurance + Property Taxes + Property Management + Repairs & Maintenance + Capital Expenditures + HOA Fees | 32% | -$862 | -$10,347 |
Cash Flow
| Monthly | Yearly | |
|---|---|---|
Net Operating Income (NOI)The income generated from a property after deducting all operating expenses but before deducting mortgage payments, taxes, and capital expenditures. Calculation:Gross Operating Income - Operating Expenses
Net operating income:
| $1,676 | $20,112 |
Mortgage PaymentThe fixed amount a borrower pays each month to repay a loan. It typically includes principal and interest (P&I) and may also cover property taxes, insurance, HOA fees, and PMI if escrowed. | -$2,894 | -$34,728 |
Cash FlowNet Operating Income (NOI) minus mortgage payments. Calculation:NOI - Mortgage Payments | -$1,218 | -$14,616 |