$1,850,000
Investment Summary
- Monthly Cash Flow
- -$4,769
- Cap Rate
- 3.1%
- Cash-on-Cash Return
- -13.4%
- Debt Coverage Ratio
- 0.50
- Internal Rate of Return (5 years)
- -9.0%
Cash Flow
Net Operating Income (NOI) minus mortgage payments.
Calculation:
NOI - Mortgage Payments
Cap Rate (Market Value)
Capitalization Rate is a rate of return that compares the yearly Net Operating Income (NOI) to the market value.
Calculation:
NOI / Market Value
Cash-on-Cash Return (CoC)
Annual Cash Flow / Cash Invested
Calculation:
Annual cash flow divided by initial cash invested.
Debt Coverage Ratio (DCR)
Net Operating Income (NOI) divided by total debt payments.
Calculation:
NOI / Total Debt Payments
Internal Rate of Return (IRR)
A metric for assessing profitability over time. IRR is the discount rate at which the net present value (NPV) of all future cash flows (positive and negative) from an investment equals zero — including both periodic cash flow (such as rent) and a projected sale at the end of the holding period. It represents the expected annualized return, accounting for income, expenses, and the recovery of capital through a future sale.
Property Description
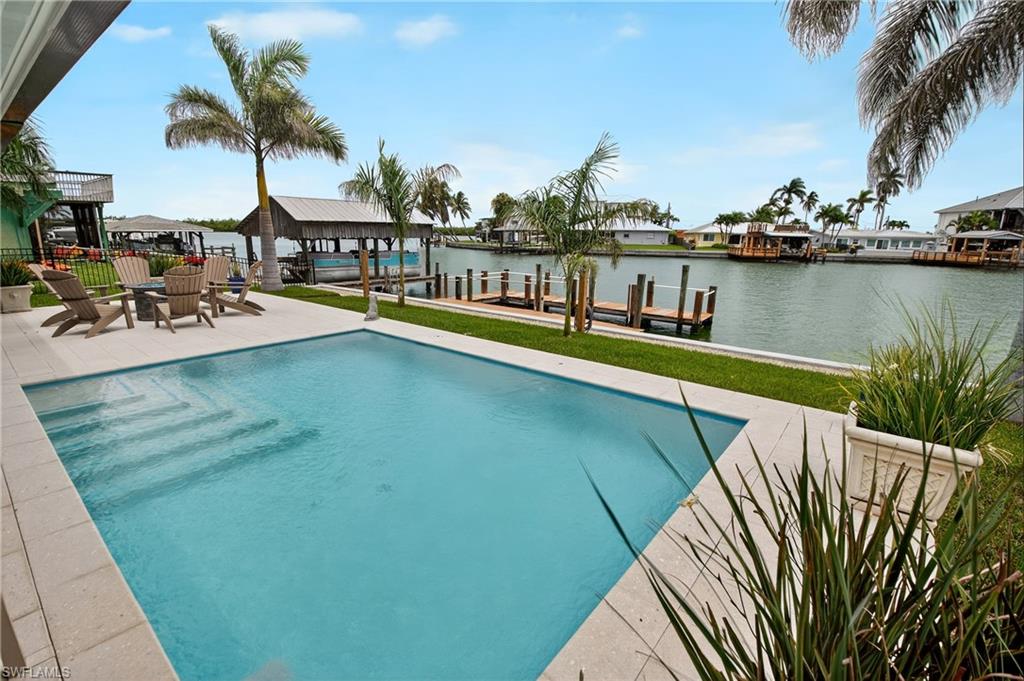
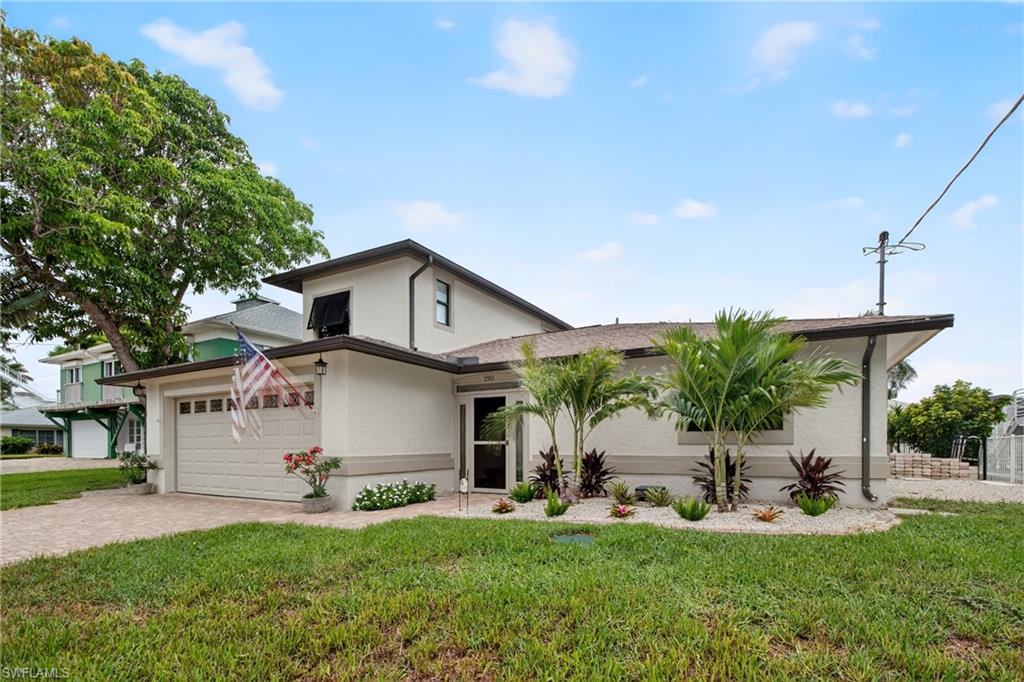
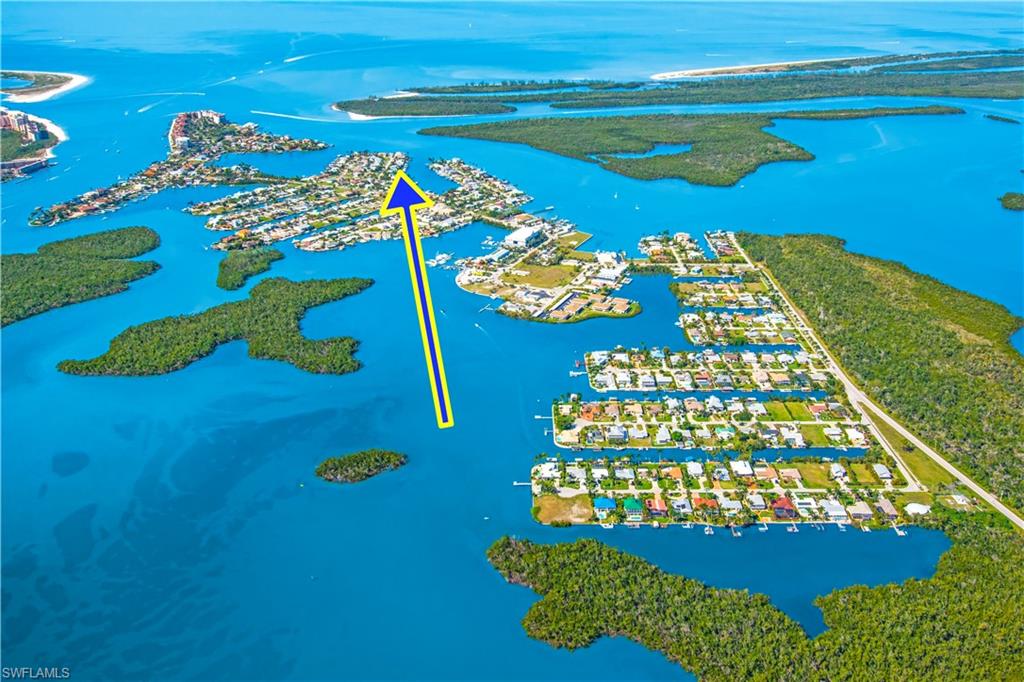
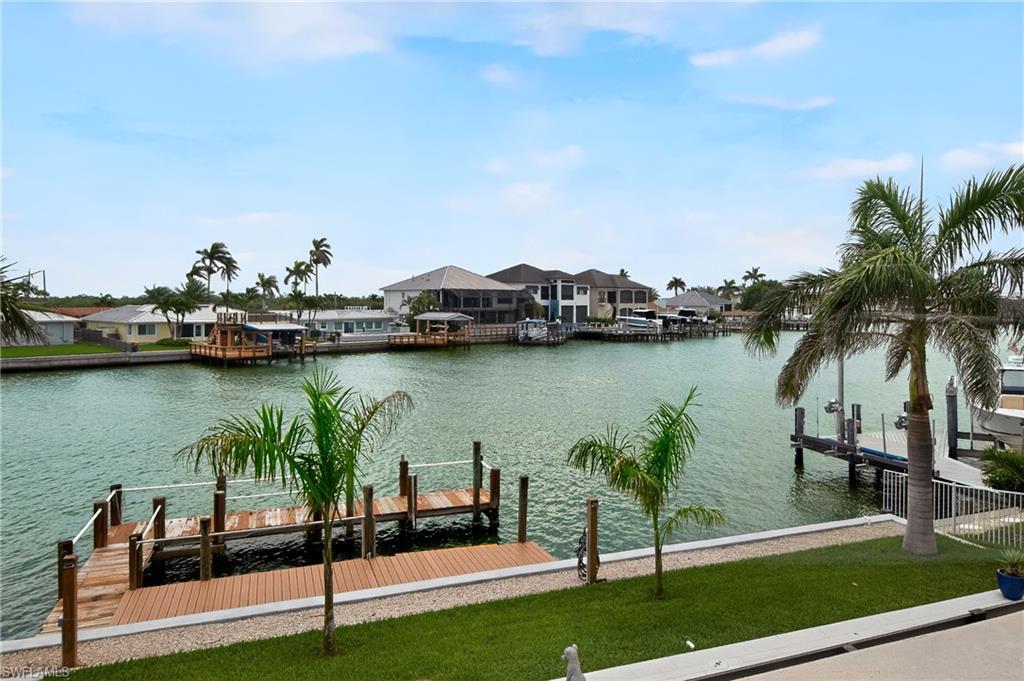
If serenity, sunshine, and sea life sound like your kind of daily routine, this property is calling your name. Welcome to your waterfront escape on the beautiful Isles of Capri! This charming three-bedroom, three-bathroom home offers the ultimate blend of tranquility, nature, and direct access to all the Gulf of America has to offer. Nestled along Marlin Bay, which is this island’s only man-made bay, you'll enjoy the rare privilege of larger docks and boat lifts than anywhere else in the area. Inside, the home offers comfort and functionality with three well-appointed bathrooms and a layout ideal for entertaining or relaxing after a day in the sun. The primary bedroom provides a private retreat, while the other two bedrooms give ample space for guests or hobbies, think of it as your very own sunshine-fueled sleepover headquarters. Tile flooring stretches throughout the entire home while the Hurricane Impact windows and sliders provide peace of mind that blends with panoramic water views. Outside, everything you want from Florida living starts with the environment itself. Situated within Rookery Bay, a protected and towering ecological gem, wildlife sightings are part of the deal as dolphins and manatees are regular performers. And when they take a break, you’re just minutes away from natural wonders like Keewaydin Island and Cape Romano. Bring your sunscreen and your sense of adventure because this location is the perfect launching point for exploration. Whether you’re an offshore fishing aficionado, a paddleboarding enthusiast, or someone who simply enjoys a front-row seat to nature, this home caters to your coastal lifestyle, with wildlife always just a glance away. When you're not on the water, you'll want to be in the spacious, concrete swimming pool, enjoying views of dolphins and manatees. Yes, that splash in the bay might just be another finned neighbor coming by to say hello. Living here often feels like flipping through a National Geographic magazine, only better because it’s real and right outside your door. The Isles of Capri offers a laid-back, nature-loving lifestyle with a touch of old Florida charm. Located just one mile from the shopping and restaurants of Marco Island and only twenty minutes from the elegance and fine dining of downtown Naples, you’ll enjoy a peaceful retreat without sacrificing everyday convenience. Four neighborhood restaurants, each with its own coastal flair and three marinas add to the ease of living on the island. So, whether you’re watching the wildlife from your pool, setting out for a Gulf sunset cruise, or simply breathing in the salty breeze, every day here offers a postcard-worthy backdrop. If you're looking to swap fast-paced living for slow sips by the bay, this is your place to unwind, recharge, and enjoy the water at your own pace. Welcome to paradise, Welcome to Isles of Capri!
Build Your Team
Quickly find investor-friendly professionals who can help you succeed in real estate investing at any stage of the investing journey.


Agents
Match with investor-friendly agents who can help you find, analyze, and close your next deal


Lenders
Get the best funding…find investor-friendly lenders who specialize in your deal strategy


Property Managers
Transition to passive investing. Find a trusted property management partnership that lasts.


Tax Pros & Accountants
Taxes and financial reporting made easy—find experts to create tax savings strategies, file taxes, and more
Location
Property Details
Parking
- Description: 1 Assigned, Driveway Paved, Golf Cart
- Details: Garage Door Opener, Paved, Attached
- Garage Spaces: 1
- Spaces Total: 1
Bedroom Information
- # of Bedrooms: 3
Bathroom Information
- # of Baths (Full): 3
- # of Baths (Total): 3.0
Interior Features
- # of Rooms: 2
- # of Stories: 2
Exterior Features
- Roof Material: Shingle
- Pool: Yes
Land Information
- Land Use: Residential
- Land Use Subtype: Single Family Residential
Lot Information
- Parcel ID: 52391000000
- Lot Size: 7841 sqft
Property Information
- Property Type: Single Family Residence
- Style: Two Story, Single Family
- Year Built: 1978
Tax Information
- Annual Tax: $9,745
Utilities
- Heating: Central, Electric
- Cooling: Other
Location
- County: Collier
Listing Details
Investment Summary
- Monthly Cash Flow
- -$4,769
- Cap Rate
- 3.1%
- Cash-on-Cash Return
- -13.4%
- Debt Coverage Ratio
- 0.50
- Internal Rate of Return (5 years)
- -9.0%
Cash Flow
Net Operating Income (NOI) minus mortgage payments.
Calculation:
NOI - Mortgage Payments
Cap Rate (Market Value)
Capitalization Rate is a rate of return that compares the yearly Net Operating Income (NOI) to the market value.
Calculation:
NOI / Market Value
Cash-on-Cash Return (CoC)
Annual Cash Flow / Cash Invested
Calculation:
Annual cash flow divided by initial cash invested.
Debt Coverage Ratio (DCR)
Net Operating Income (NOI) divided by total debt payments.
Calculation:
NOI / Total Debt Payments
Internal Rate of Return (IRR)
A metric for assessing profitability over time. IRR is the discount rate at which the net present value (NPV) of all future cash flows (positive and negative) from an investment equals zero — including both periodic cash flow (such as rent) and a projected sale at the end of the holding period. It represents the expected annualized return, accounting for income, expenses, and the recovery of capital through a future sale.
Purchase Details
Purchase PriceThe price paid for the property. Purchase price:
| $1,850,000 |
|---|---|
Amount FinancedThe amount of the purchase financed through a loan. Amount financed:
| -$1,480,000 |
Down paymentThe initial payment made towards the purchase. Down payment:
| $370,000 |
Closing CostsFees and expenses associated with purchasing a property, typically ranging from 2% to 5% of the home’s purchase price, paid at the end of a home purchase to cover services like lending, title transfer, and taxes. Closing costs:
| $55,500 |
Rehab CostsCosts incurred to repair or improve the property, including: roof, flooring, exterior siding, kitchen, exterior paint, bathrooms, etc. Rehab costs:
| $0 |
Initial Cash InvestedThe total initial cash invested in the property. Calculation:Down payment + Buying costs + Rehab costs Initial cash invested:
| $425,500 |
Square Feet (SQFT)The total square footage of the property. Square feet:
| 1,739 |
Cost Per Square FootCost per square foot of the property. Calculation:Purchase Price / Square Feet Cost per square foot:
| $1,064 |
Monthly Rent Per Square FootMonthly rent divided by the number of square feet. This ratio helps investors compare rental income efficiency across properties, markets, and unit sizes Calculation:Monthly Rent / Square Feet Monthly rent per square foot:
| $4.60 |
Financing Details
Loan AmountThe total sum of money borrowed from a lender to finance a property purchase. Calculation:Purchase Price - Down Payment
Loan amount:
| $1,480,000 |
|---|---|
Loan to Value Ratio (LTV)Loan amount divided by the market value of the property. Calculation:Loan Amount / Market Value
Loan to value ratio:
| 80.0% |
Loan TypeThe type of loan (e.g., fixed, adjustable).
Loan type:
| Amortizing |
TermThe loan repayment period in years.
Term:
| 30 years |
Interest RateThe percentage a lender charges on the borrowed amount of a loan, determining the cost of borrowing money.
Interest rate:
| 6.625% |
Principal & Interest (PI)The principal is the portion of the loan payment that reduces the loan balance. The interest is the lender's charge for borrowing money. Calculation:(P * r * (1 + r) ** n) / ((1 + r) ** n - 1) Where:
P = Loan amount (principal)
Principal & interest:
| $9,477 |
Property TaxesAnnual taxes levied by local governments on real estate properties. These taxes fund public services like schools, roads, and emergency services.
Property tax:
| $812 |
InsuranceThe costs for insurance coverage to protect against financial losses due to risks like fire, natural disasters, theft, liability, or tenant-related damages. Calculation:Assumes 7% of gross rental income, unless insurance rates are specified.
Insurance:
| $560 |
Private Mortgage Insurance (PMI)A fee that borrowers pay when they take out a conventional loan with a loan-to-value (LTV) ratio above 80%.
Private mortgage insurance (PMI):
| $0 |
Monthly PaymentThe fixed amount a borrower pays each month to repay a loan. It typically includes principal and interest (P&I) and may also cover property taxes, insurance, HOA fees, and PMI if escrowed. Monthly payment:
| $10,849 |
Operating Income
| % Rent | Monthly | Yearly | |
|---|---|---|---|
Gross RentThe total rental income received from tenants before deducting any expenses. Includes base rent, late fees, pet fees, parking fees, and other recurring charges.
Gross rent:
| $8,000 | $96,000 | |
Vacancy LossExpected loss of rent due to vacancies.
Vacancy loss:
(6%)
| 6% | -$480 | -$5,760 |
Operating IncomeGross rental income minus vacancy loss. Calculation:Gross rent - Vacancy loss
Operating income:
| $7,520 | $90,240 |
Operating Expenses
| % Rent | Monthly | Yearly | |
|---|---|---|---|
Property TaxesAnnual taxes levied by local governments on real estate properties. These taxes fund public services like schools, roads, and emergency services. | 10% | -$812 | -$9,746 |
InsuranceThe costs for insurance coverage to protect against financial losses due to risks like fire, natural disasters, theft, liability, or tenant-related damages. Calculation:Assumes 7% of gross rental income, unless insurance rates are specified. | 7% | -$560 | -$6,720 |
Property ManagementThe costs associated with hiring a property manager to handle the day-to-day operations of a rental property. Includes management fees, leasing fes, eviction fees, etc. Calculation:Assumes 8% of gross rental income. | 8% | -$640 | -$7,680 |
Repairs & MaintenanceOngoing costs for routine upkeep and minor fixes needed to keep a property in good working condition. Calculation:Assumes 5% of gross rental income. Varies by property age and condition. | 5% | -$400 | -$4,800 |
Capital ExpensesLarge, infrequent costs for major improvements or replacements, like a new roof, HVAC system, or appliances. Calculation:Assumes 5% of gross rental income. Varies by property age. | 5% | -$400 | -$4,800 |
HOA FeesRegular dues paid to a Homeowners Association for community maintenance, amenities, and management. Similar fees include: Condo Association Fees, Co-op Maintenance Fees, etc. | n/a | n/a | n/a |
Operating ExpensesRecurring costs required to maintain and manage a rental property, including property taxes, insurance, maintenance, repairs, utilities (if paid by the owner), property management fees, and other day-to-day expenses. Calculation:Insurance + Property Taxes + Property Management + Repairs & Maintenance + Capital Expenditures + HOA Fees | 35% | -$2,812 | -$33,746 |
Cash Flow
| Monthly | Yearly | |
|---|---|---|
Net Operating Income (NOI)The income generated from a property after deducting all operating expenses but before deducting mortgage payments, taxes, and capital expenditures. Calculation:Gross Operating Income - Operating Expenses
Net operating income:
| $4,708 | $56,496 |
Mortgage PaymentThe fixed amount a borrower pays each month to repay a loan. It typically includes principal and interest (P&I) and may also cover property taxes, insurance, HOA fees, and PMI if escrowed. | -$9,477 | -$113,724 |
Cash FlowNet Operating Income (NOI) minus mortgage payments. Calculation:NOI - Mortgage Payments | $4,769 | $57,228 |