$2,694,000
Investment Summary
- Monthly Cash Flow
- -$8,596
- Cap Rate
- 2.3%
- Cash-on-Cash Return
- -16.6%
- Debt Coverage Ratio
- 0.38
- Internal Rate of Return (5 years)
- -12.1%
Cash Flow
Net Operating Income (NOI) minus mortgage payments.
Calculation:
NOI - Mortgage Payments
Cap Rate (Market Value)
Capitalization Rate is a rate of return that compares the yearly Net Operating Income (NOI) to the market value.
Calculation:
NOI / Market Value
Cash-on-Cash Return (CoC)
Annual Cash Flow / Cash Invested
Calculation:
Annual cash flow divided by initial cash invested.
Debt Coverage Ratio (DCR)
Net Operating Income (NOI) divided by total debt payments.
Calculation:
NOI / Total Debt Payments
Internal Rate of Return (IRR)
A metric for assessing profitability over time. IRR is the discount rate at which the net present value (NPV) of all future cash flows (positive and negative) from an investment equals zero — including both periodic cash flow (such as rent) and a projected sale at the end of the holding period. It represents the expected annualized return, accounting for income, expenses, and the recovery of capital through a future sale.
Property Description
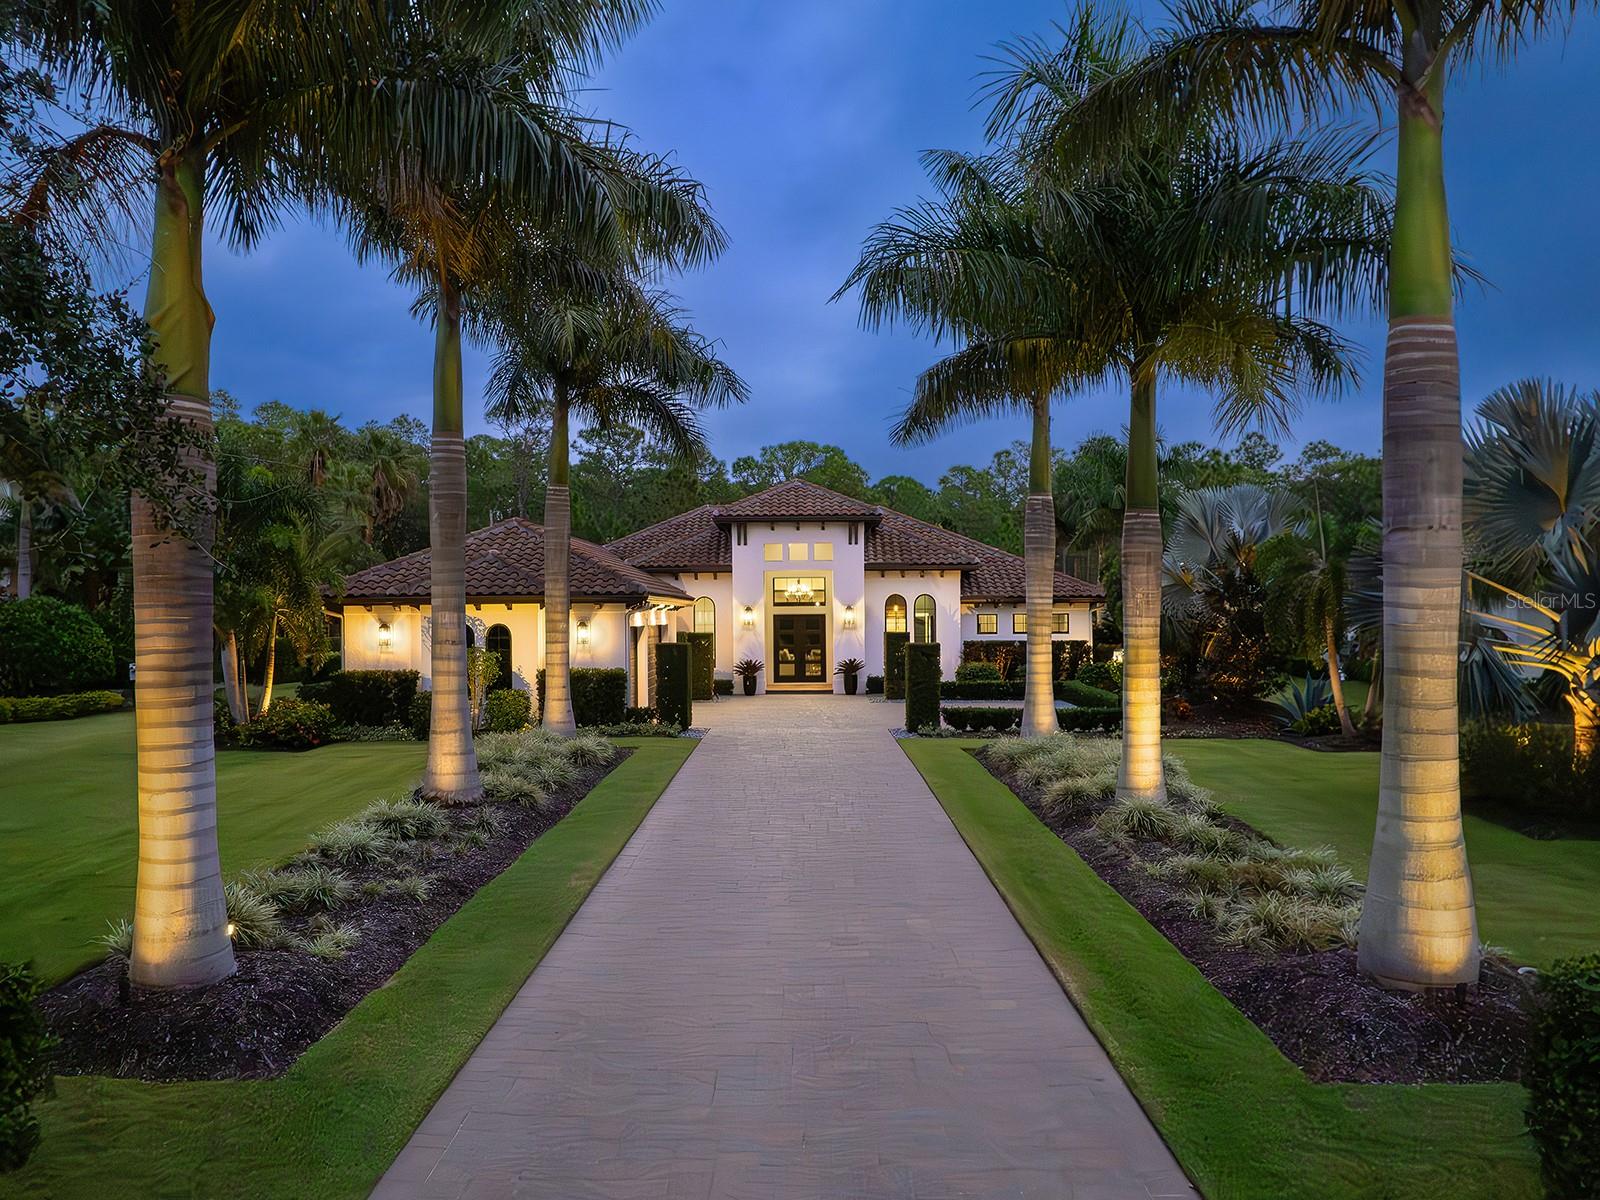
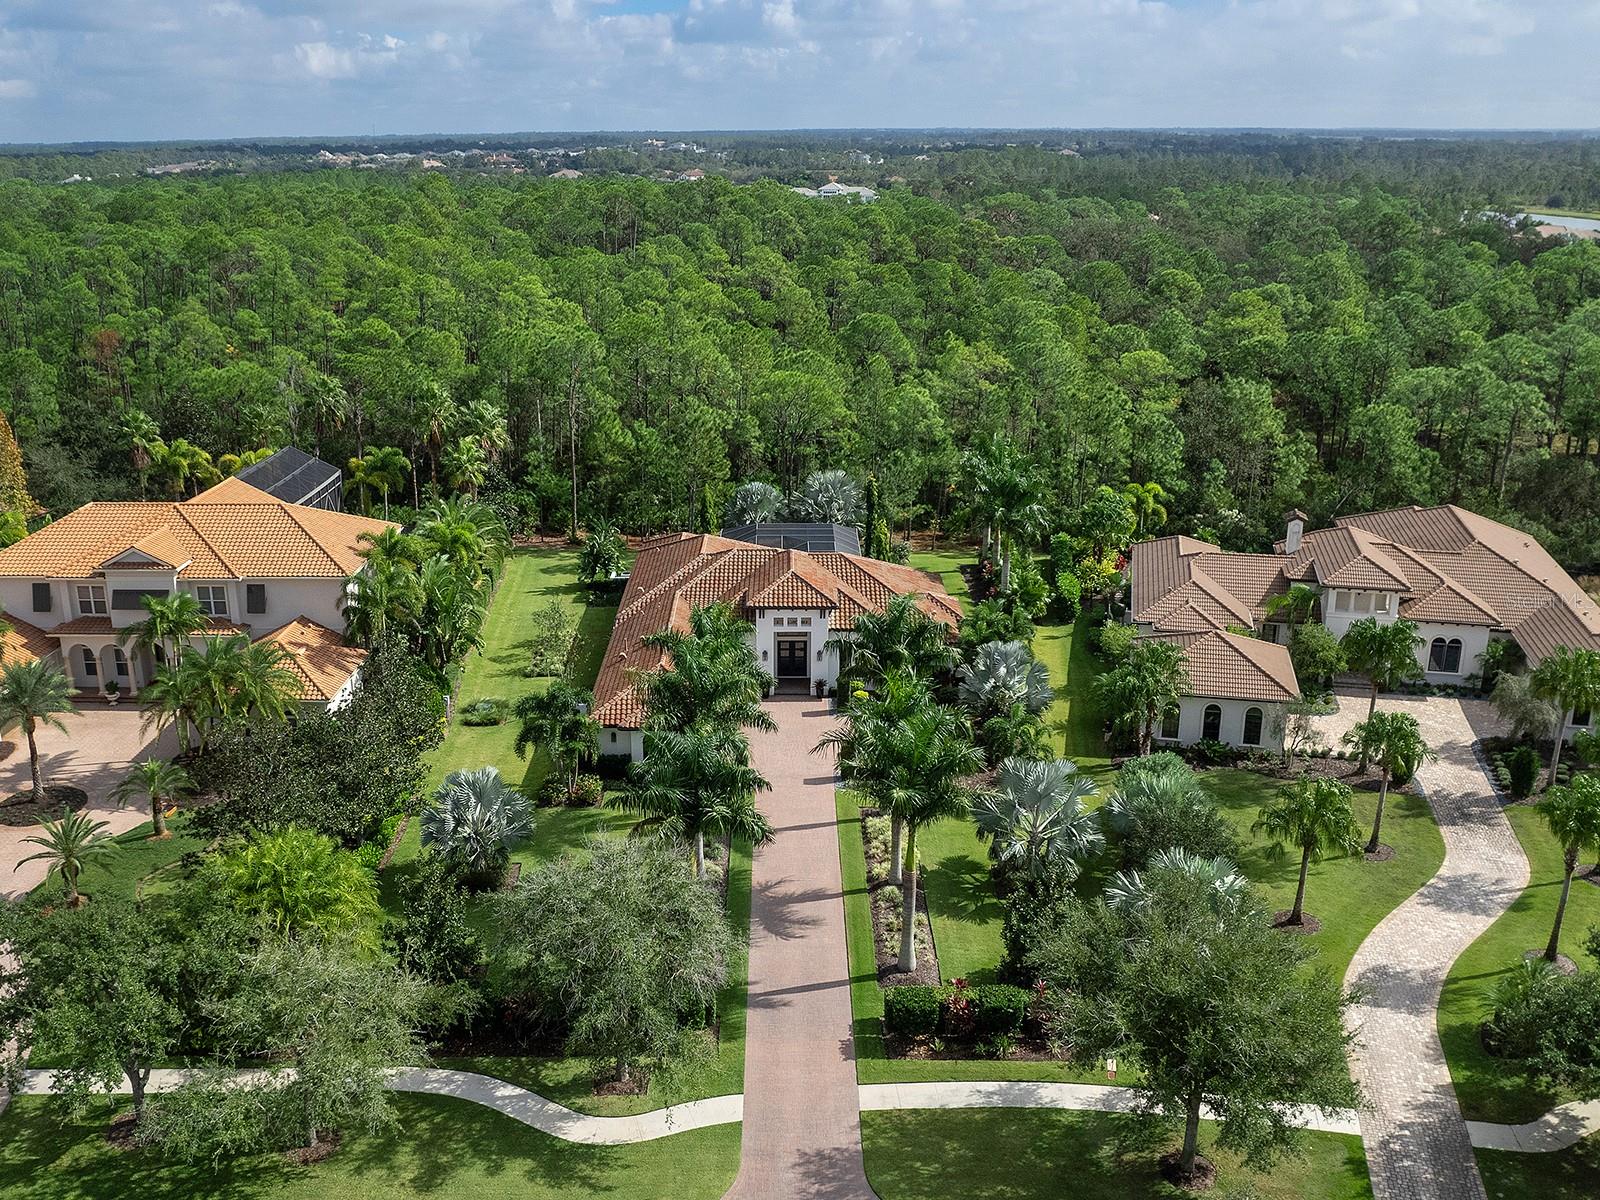
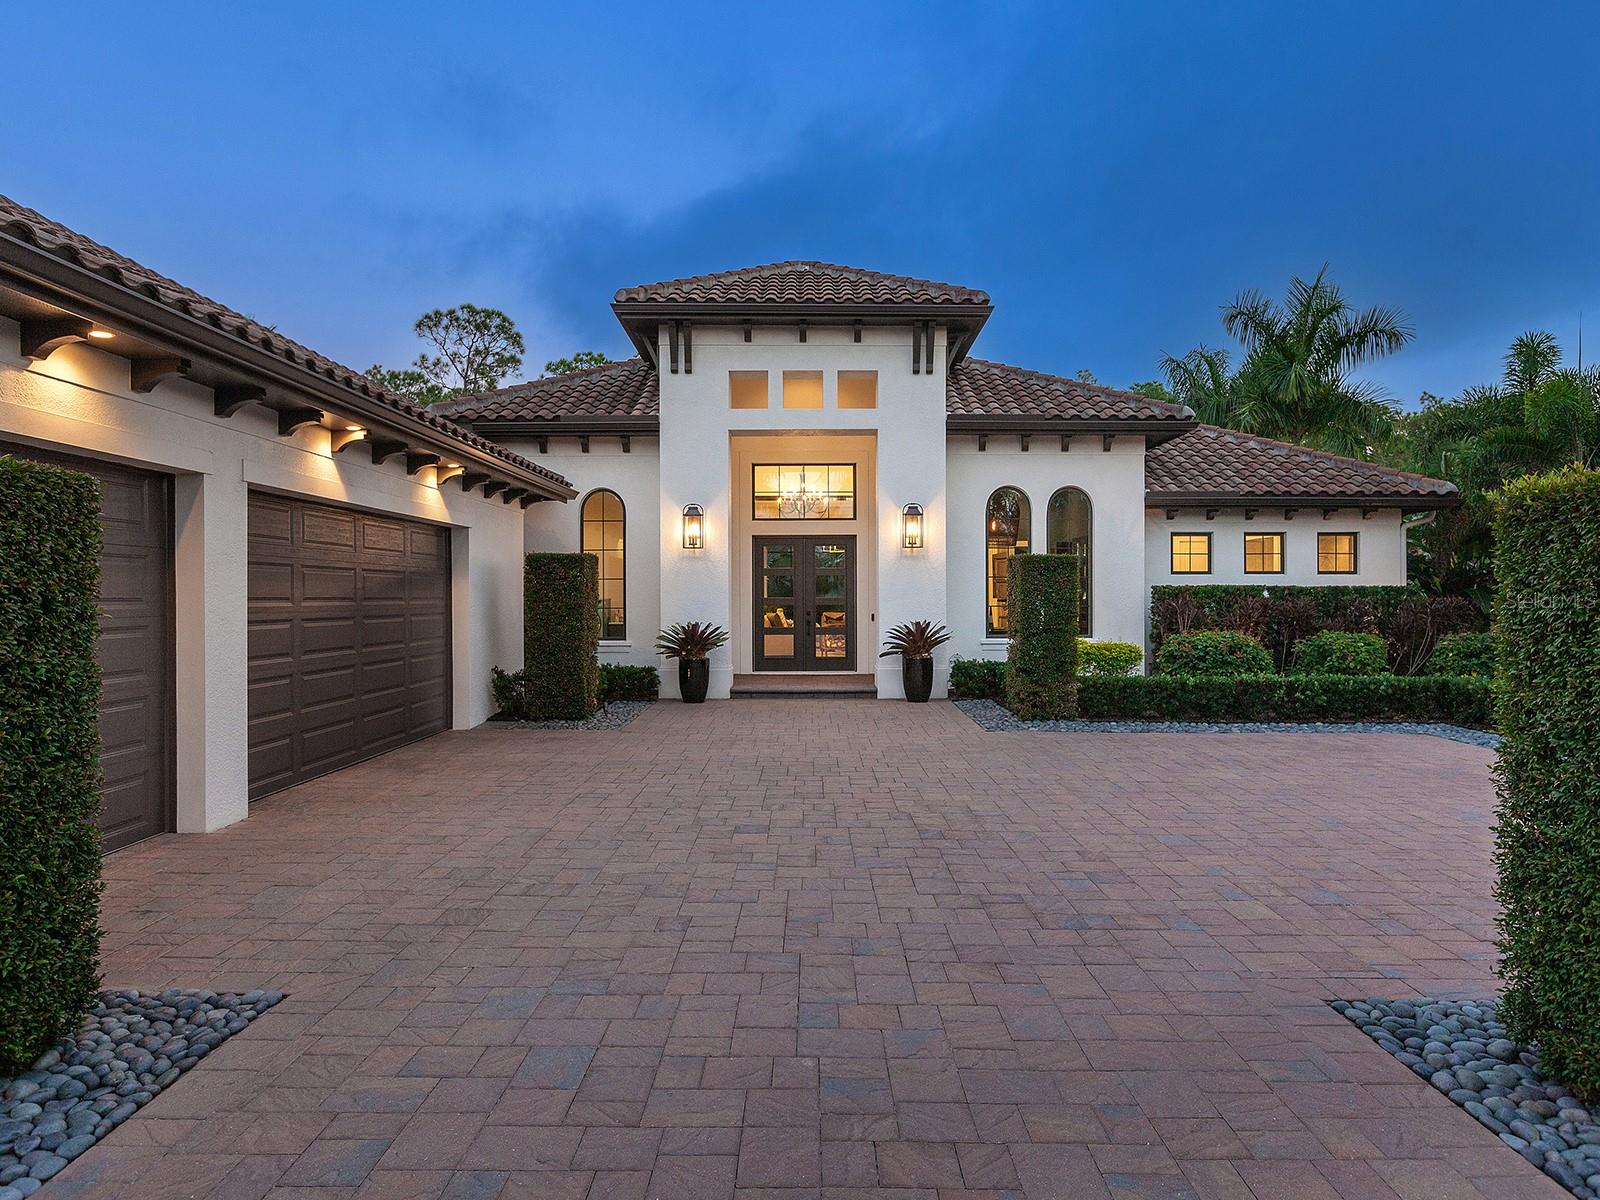
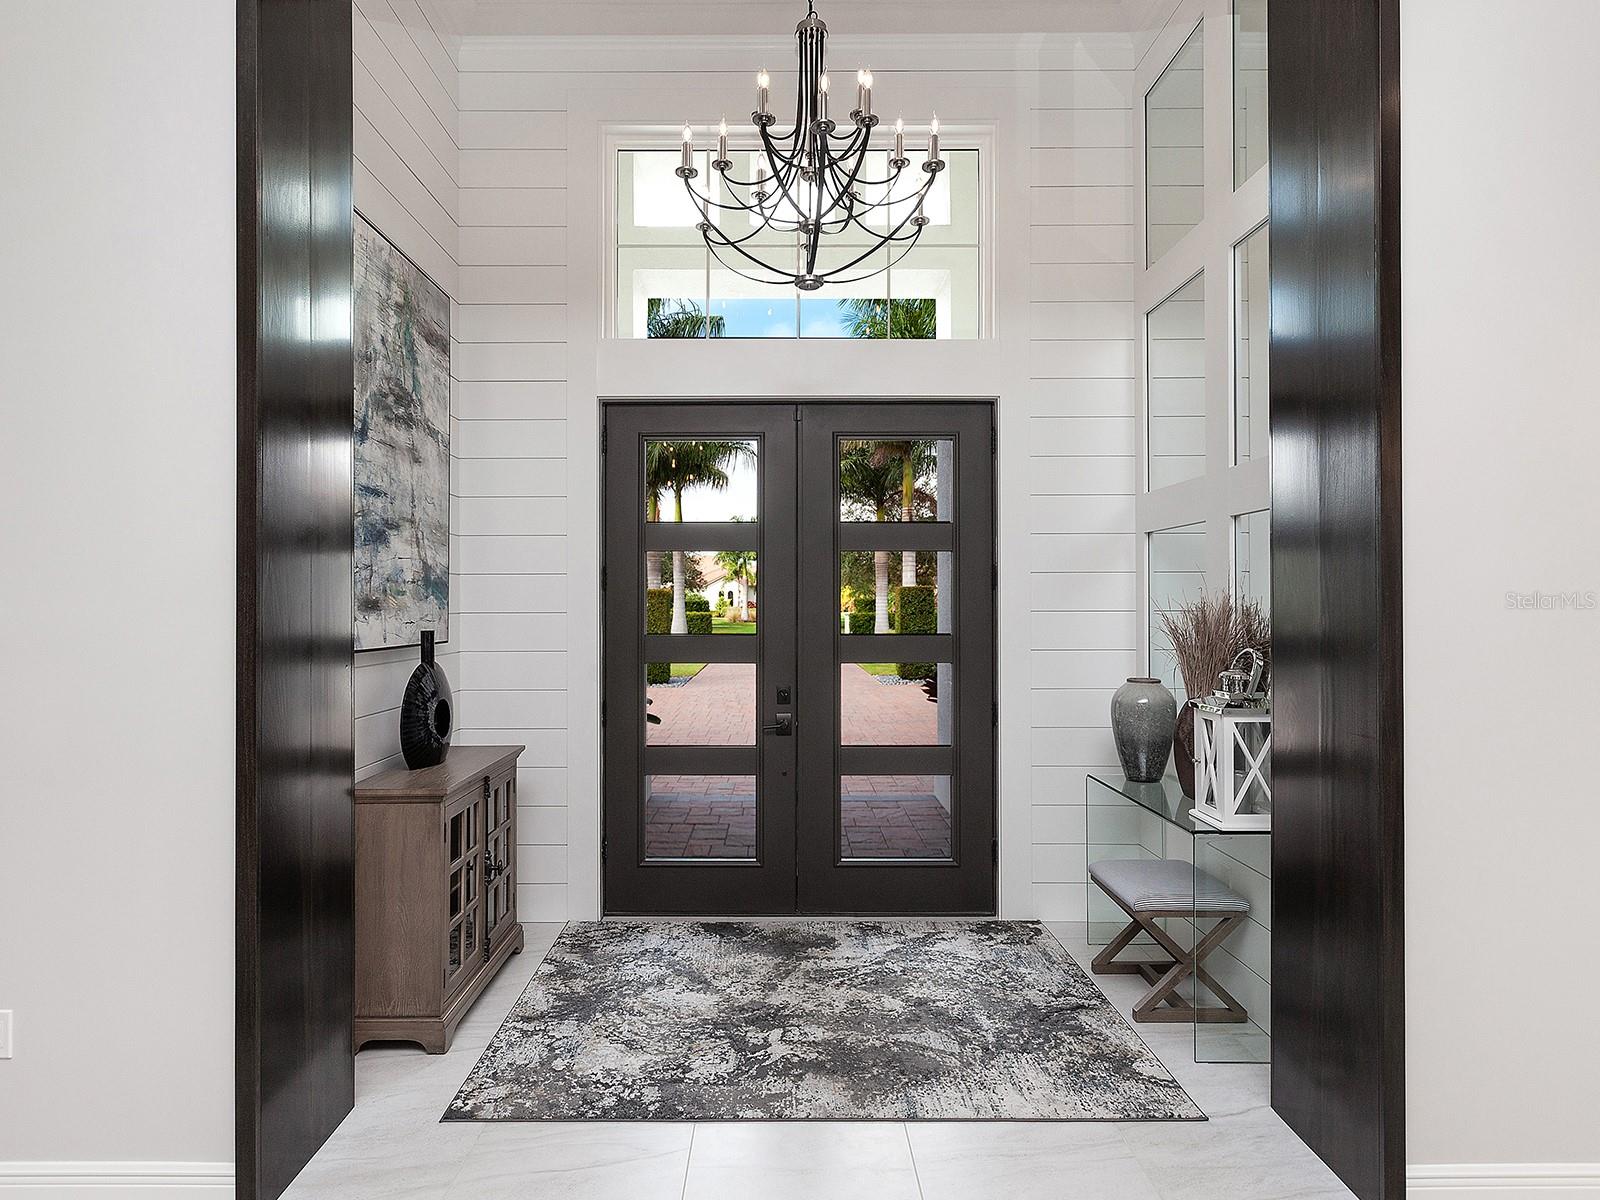
Located in The Concession, one of the area’s most prestigious communities and home to the Concession Golf Club, this exquisite property is impressive from the moment one arrives onto the long paver drive bordered by mature, meticulously manicured landscaping. Once inside, the grand entrance features a high ceiling adorned with an impressive chandelier and mirrored accent wall, setting the tone for the luxurious interior. The great room is a focal point of the house, featuring a stone fireplace surrounded by custom trim, built-in shelves, and a tray ceiling with crown molding. 10’ feet tall by 22’ wide sliding glass pocketing wall system and porcelain tile flooring add to the elegance and functionality of the space. The adjacent dining area is designed for both style and functionality, featuring a tray ceiling, a dry bar with a granite top, and a mirror tile backsplash that adds a touch of glamour. The kitchen is a chef's dream with white cabinets featuring pull-out shelves and soft-close drawers, quartz countertops, stainless steel Thermador appliances, and a huge island in a contrasting color with storage and counter height seating. Lit glass top cabinets showcase fine dishware, and a 10’ tall glass encased wine display adds a touch of luxury. The white tile backsplash extends to the ceiling, complemented by large windows and a big custom-organized pantry. The bonus room features a tray ceiling, a see-through wine display accessible from both sides (connecting to the kitchen), and 10’ tall by 12’ wide sliding glass pocketing wall system. The primary suite is a luxurious retreat with access to the lanai, two custom-organized walk-in closets, a spacious marble vanity, windows, crown molding, a huge dual-entry shower, a water closet, and a free-standing tub. The office exudes sophistication with dark walls, large windows, a high ceiling with crown molding, and glass doors for a refined and private workspace. Each of the two guest bedrooms has generous closet space and en-suite bathrooms that also open to the hallway. The laundry room is both stylish and functional, boasting quartz countertops, sink and ample cabinet space. A huge storage room by the garage and another large closet add to the home's practicality. The lanai is an outdoor oasis with travertine flooring, a heated large rectangular pool with lights, a spa, and an ultraviolet light pool system. An island with tons of storage, a granite top, a Blaze professional grill, a Marvel outdoor fridge, a prep sink, and a huge vent hood make outdoor entertaining a breeze. The expansive backyard is beautifully landscaped for a serene ambiance. The Concession, home to the 2021 PGA Tour World Golf Championship and the 2023 PGA World Champions Cup, is one of the most prestigious golf communities in the country and provides the perfect setting for those who admire a serene and tranquil environment.
Build Your Team
Quickly find investor-friendly professionals who can help you succeed in real estate investing at any stage of the investing journey.


Agents
Match with investor-friendly agents who can help you find, analyze, and close your next deal


Lenders
Get the best funding…find investor-friendly lenders who specialize in your deal strategy


Property Managers
Transition to passive investing. Find a trusted property management partnership that lasts.


Tax Pros & Accountants
Taxes and financial reporting made easy—find experts to create tax savings strategies, file taxes, and more
Location
Property Details
Parking
- Description: Garage Door Opener, Oversized
- Details: Attached
- Garage Spaces: 3
- Spaces Total: 0
Bedroom Information
- # of Bedrooms: 3
Bathroom Information
- # of Baths (Full): 3
- # of Baths (Total): 3.0
Interior Features
- # of Rooms: 9
- # of Stories: 1
Exterior Features
- Exterior Walls Materials: Stucco
- Foundation: Slab
- Roof Type: Gable or Hip
- Roof Material: Tile
HOA
- Has HOA: Yes
- Association: Kyle Scroggs
- HOA Fee: $1,937/quarterly
Land Information
- Land Use: Residential
- Land Use Subtype: Single Family Residential
Lot Information
- Parcel ID: 3319.32159
- Lot Size: 34412 sqft
Property Information
- Property Type: Single Family Residence
- Style: Custom
- Year Built: 2019
Tax Information
- Annual Tax: $13,432
Utilities
- Water & Sewer: Public
- Heating: Central, Heat Pump, Natural Gas
- Cooling: Central Air
Location
- County: Manatee
Listing Details
Investment Summary
- Monthly Cash Flow
- -$8,596
- Cap Rate
- 2.3%
- Cash-on-Cash Return
- -16.6%
- Debt Coverage Ratio
- 0.38
- Internal Rate of Return (5 years)
- -12.1%
Cash Flow
Net Operating Income (NOI) minus mortgage payments.
Calculation:
NOI - Mortgage Payments
Cap Rate (Market Value)
Capitalization Rate is a rate of return that compares the yearly Net Operating Income (NOI) to the market value.
Calculation:
NOI / Market Value
Cash-on-Cash Return (CoC)
Annual Cash Flow / Cash Invested
Calculation:
Annual cash flow divided by initial cash invested.
Debt Coverage Ratio (DCR)
Net Operating Income (NOI) divided by total debt payments.
Calculation:
NOI / Total Debt Payments
Internal Rate of Return (IRR)
A metric for assessing profitability over time. IRR is the discount rate at which the net present value (NPV) of all future cash flows (positive and negative) from an investment equals zero — including both periodic cash flow (such as rent) and a projected sale at the end of the holding period. It represents the expected annualized return, accounting for income, expenses, and the recovery of capital through a future sale.
Purchase Details
Purchase PriceThe price paid for the property. Purchase price:
| $2,694,000 |
|---|---|
Amount FinancedThe amount of the purchase financed through a loan. Amount financed:
| -$2,155,200 |
Down paymentThe initial payment made towards the purchase. Down payment:
| $538,800 |
Closing CostsFees and expenses associated with purchasing a property, typically ranging from 2% to 5% of the home’s purchase price, paid at the end of a home purchase to cover services like lending, title transfer, and taxes. Closing costs:
| $80,820 |
Rehab CostsCosts incurred to repair or improve the property, including: roof, flooring, exterior siding, kitchen, exterior paint, bathrooms, etc. Rehab costs:
| $0 |
Initial Cash InvestedThe total initial cash invested in the property. Calculation:Down payment + Buying costs + Rehab costs Initial cash invested:
| $619,620 |
Square Feet (SQFT)The total square footage of the property. Square feet:
| 3,347 |
Cost Per Square FootCost per square foot of the property. Calculation:Purchase Price / Square Feet Cost per square foot:
| $805 |
Monthly Rent Per Square FootMonthly rent divided by the number of square feet. This ratio helps investors compare rental income efficiency across properties, markets, and unit sizes Calculation:Monthly Rent / Square Feet Monthly rent per square foot:
| $3.02 |
Financing Details
Loan AmountThe total sum of money borrowed from a lender to finance a property purchase. Calculation:Purchase Price - Down Payment
Loan amount:
| $2,155,200 |
|---|---|
Loan to Value Ratio (LTV)Loan amount divided by the market value of the property. Calculation:Loan Amount / Market Value
Loan to value ratio:
| 80.0% |
Loan TypeThe type of loan (e.g., fixed, adjustable).
Loan type:
| Amortizing |
TermThe loan repayment period in years.
Term:
| 30 years |
Interest RateThe percentage a lender charges on the borrowed amount of a loan, determining the cost of borrowing money.
Interest rate:
| 6.625% |
Principal & Interest (PI)The principal is the portion of the loan payment that reduces the loan balance. The interest is the lender's charge for borrowing money. Calculation:(P * r * (1 + r) ** n) / ((1 + r) ** n - 1) Where:
P = Loan amount (principal)
Principal & interest:
| $13,800 |
Property TaxesAnnual taxes levied by local governments on real estate properties. These taxes fund public services like schools, roads, and emergency services.
Property tax:
| $1,119 |
InsuranceThe costs for insurance coverage to protect against financial losses due to risks like fire, natural disasters, theft, liability, or tenant-related damages. Calculation:Assumes 7% of gross rental income, unless insurance rates are specified.
Insurance:
| $707 |
Private Mortgage Insurance (PMI)A fee that borrowers pay when they take out a conventional loan with a loan-to-value (LTV) ratio above 80%.
Private mortgage insurance (PMI):
| $0 |
Monthly PaymentThe fixed amount a borrower pays each month to repay a loan. It typically includes principal and interest (P&I) and may also cover property taxes, insurance, HOA fees, and PMI if escrowed. Monthly payment:
| $15,626 |
Operating Income
| % Rent | Monthly | Yearly | |
|---|---|---|---|
Gross RentThe total rental income received from tenants before deducting any expenses. Includes base rent, late fees, pet fees, parking fees, and other recurring charges.
Gross rent:
| $10,100 | $121,200 | |
Vacancy LossExpected loss of rent due to vacancies.
Vacancy loss:
(6%)
| 6% | -$606 | -$7,272 |
Operating IncomeGross rental income minus vacancy loss. Calculation:Gross rent - Vacancy loss
Operating income:
| $9,494 | $113,928 |
Operating Expenses
| % Rent | Monthly | Yearly | |
|---|---|---|---|
Property TaxesAnnual taxes levied by local governments on real estate properties. These taxes fund public services like schools, roads, and emergency services. | 11% | -$1,119 | -$13,432 |
InsuranceThe costs for insurance coverage to protect against financial losses due to risks like fire, natural disasters, theft, liability, or tenant-related damages. Calculation:Assumes 7% of gross rental income, unless insurance rates are specified. | 7% | -$707 | -$8,484 |
Property ManagementThe costs associated with hiring a property manager to handle the day-to-day operations of a rental property. Includes management fees, leasing fes, eviction fees, etc. Calculation:Assumes 8% of gross rental income. | 8% | -$808 | -$9,696 |
Repairs & MaintenanceOngoing costs for routine upkeep and minor fixes needed to keep a property in good working condition. Calculation:Assumes 5% of gross rental income. Varies by property age and condition. | 5% | -$505 | -$6,060 |
Capital ExpensesLarge, infrequent costs for major improvements or replacements, like a new roof, HVAC system, or appliances. Calculation:Assumes 5% of gross rental income. Varies by property age. | 5% | -$505 | -$6,060 |
HOA FeesRegular dues paid to a Homeowners Association for community maintenance, amenities, and management. Similar fees include: Condo Association Fees, Co-op Maintenance Fees, etc. | 6% | -$646 | -$7,752 |
Operating ExpensesRecurring costs required to maintain and manage a rental property, including property taxes, insurance, maintenance, repairs, utilities (if paid by the owner), property management fees, and other day-to-day expenses. Calculation:Insurance + Property Taxes + Property Management + Repairs & Maintenance + Capital Expenditures + HOA Fees | 42% | -$4,290 | -$51,484 |
Cash Flow
| Monthly | Yearly | |
|---|---|---|
Net Operating Income (NOI)The income generated from a property after deducting all operating expenses but before deducting mortgage payments, taxes, and capital expenditures. Calculation:Gross Operating Income - Operating Expenses
Net operating income:
| $5,204 | $62,448 |
Mortgage PaymentThe fixed amount a borrower pays each month to repay a loan. It typically includes principal and interest (P&I) and may also cover property taxes, insurance, HOA fees, and PMI if escrowed. | -$13,800 | -$165,600 |
Cash FlowNet Operating Income (NOI) minus mortgage payments. Calculation:NOI - Mortgage Payments | $8,596 | $103,152 |