$319,000
Investment Summary
- Monthly Cash Flow
- -$513
- Cap Rate
- 4.2%
- Cash-on-Cash Return
- -8.4%
- Debt Coverage Ratio
- 0.69
- Internal Rate of Return (5 years)
- -4.1%
Cash Flow
Net Operating Income (NOI) minus mortgage payments.
Calculation:
NOI - Mortgage Payments
Cap Rate (Market Value)
Capitalization Rate is a rate of return that compares the yearly Net Operating Income (NOI) to the market value.
Calculation:
NOI / Market Value
Cash-on-Cash Return (CoC)
Annual Cash Flow / Cash Invested
Calculation:
Annual cash flow divided by initial cash invested.
Debt Coverage Ratio (DCR)
Net Operating Income (NOI) divided by total debt payments.
Calculation:
NOI / Total Debt Payments
Internal Rate of Return (IRR)
A metric for assessing profitability over time. IRR is the discount rate at which the net present value (NPV) of all future cash flows (positive and negative) from an investment equals zero — including both periodic cash flow (such as rent) and a projected sale at the end of the holding period. It represents the expected annualized return, accounting for income, expenses, and the recovery of capital through a future sale.
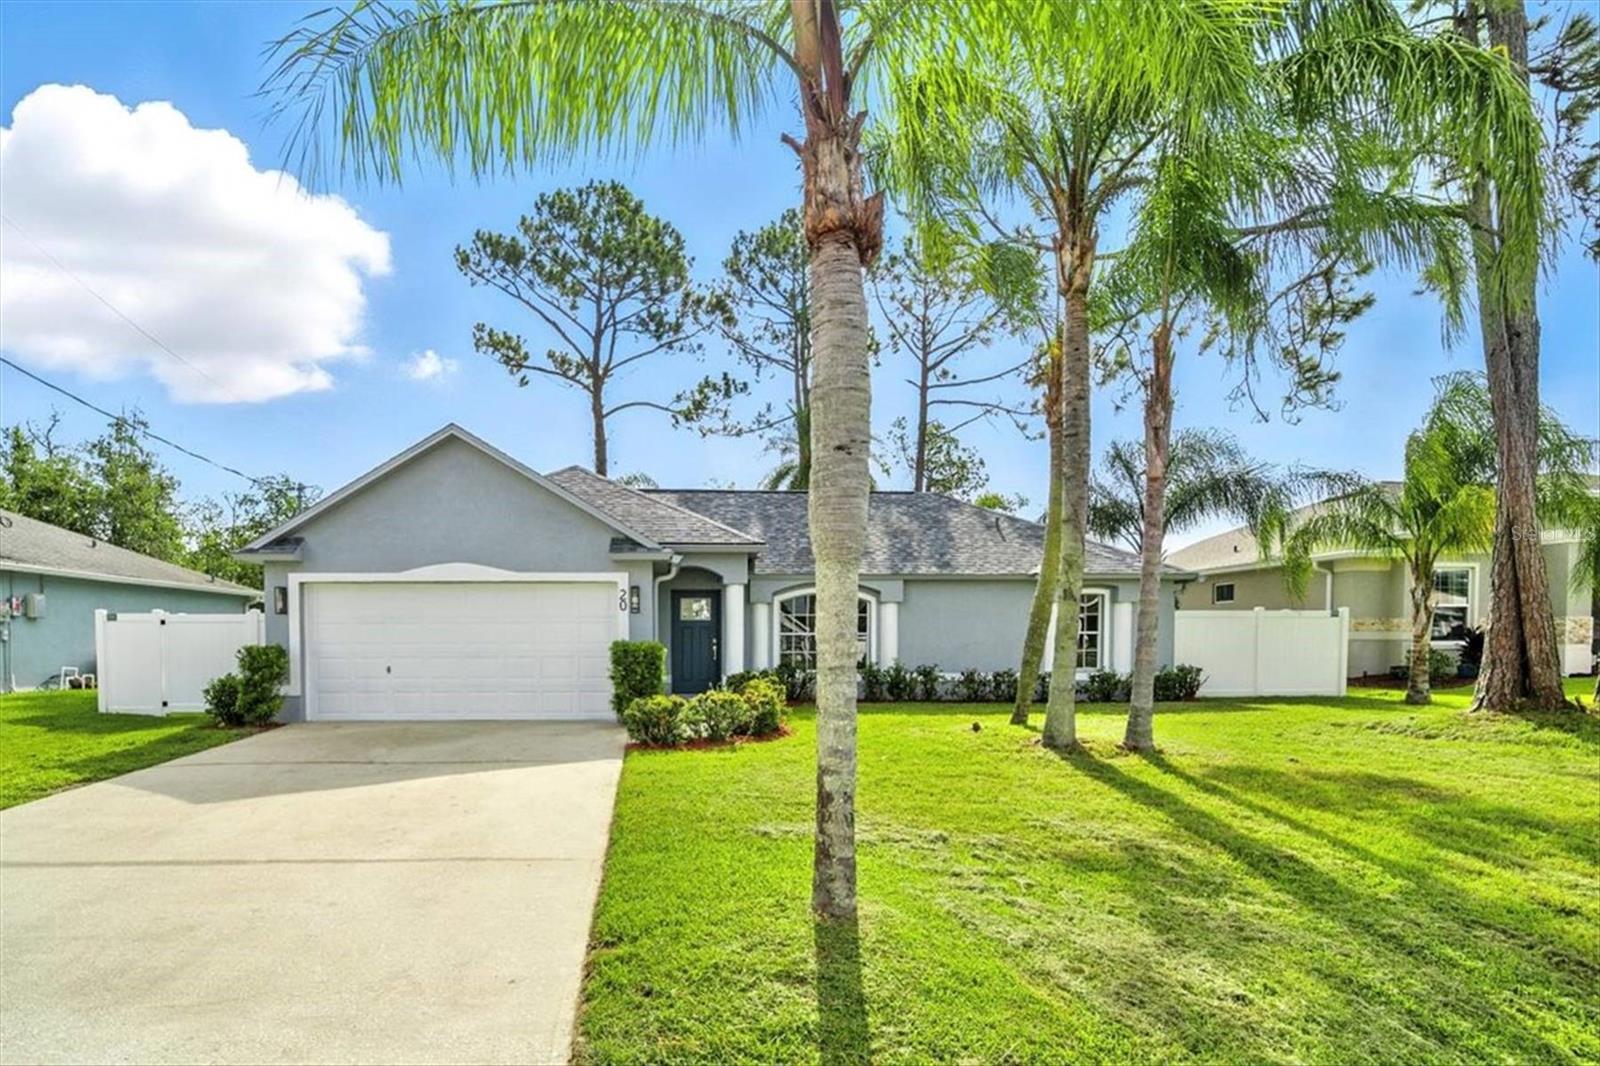
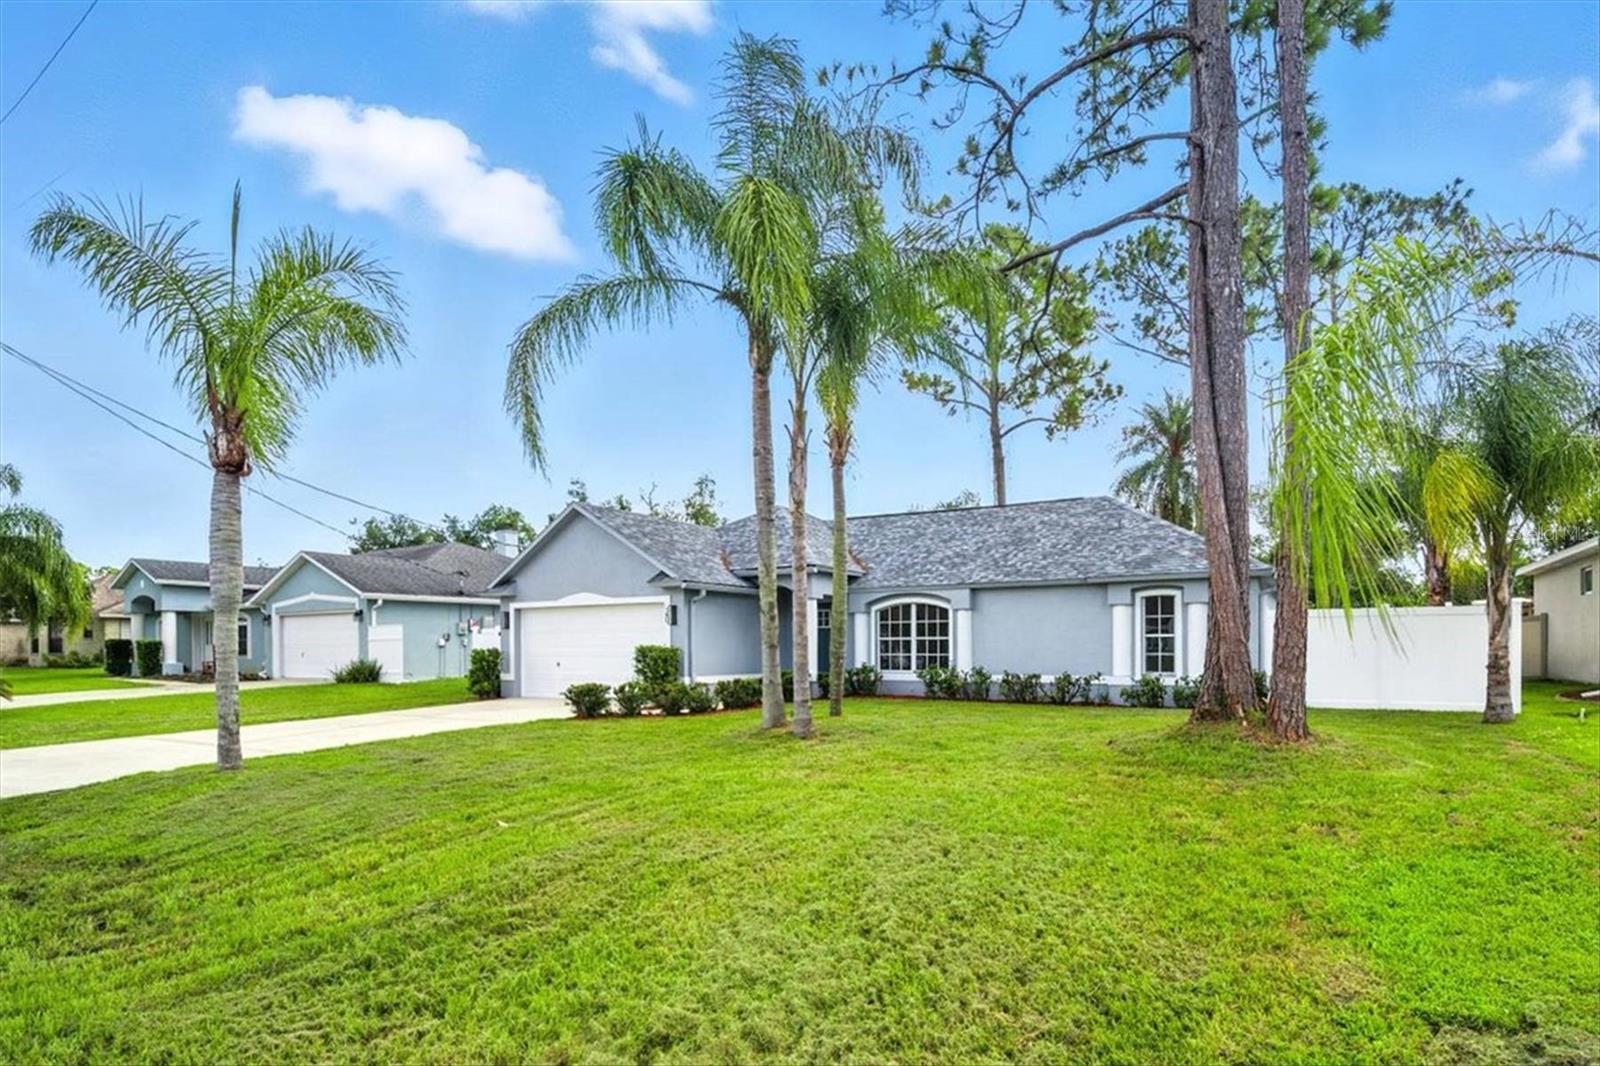
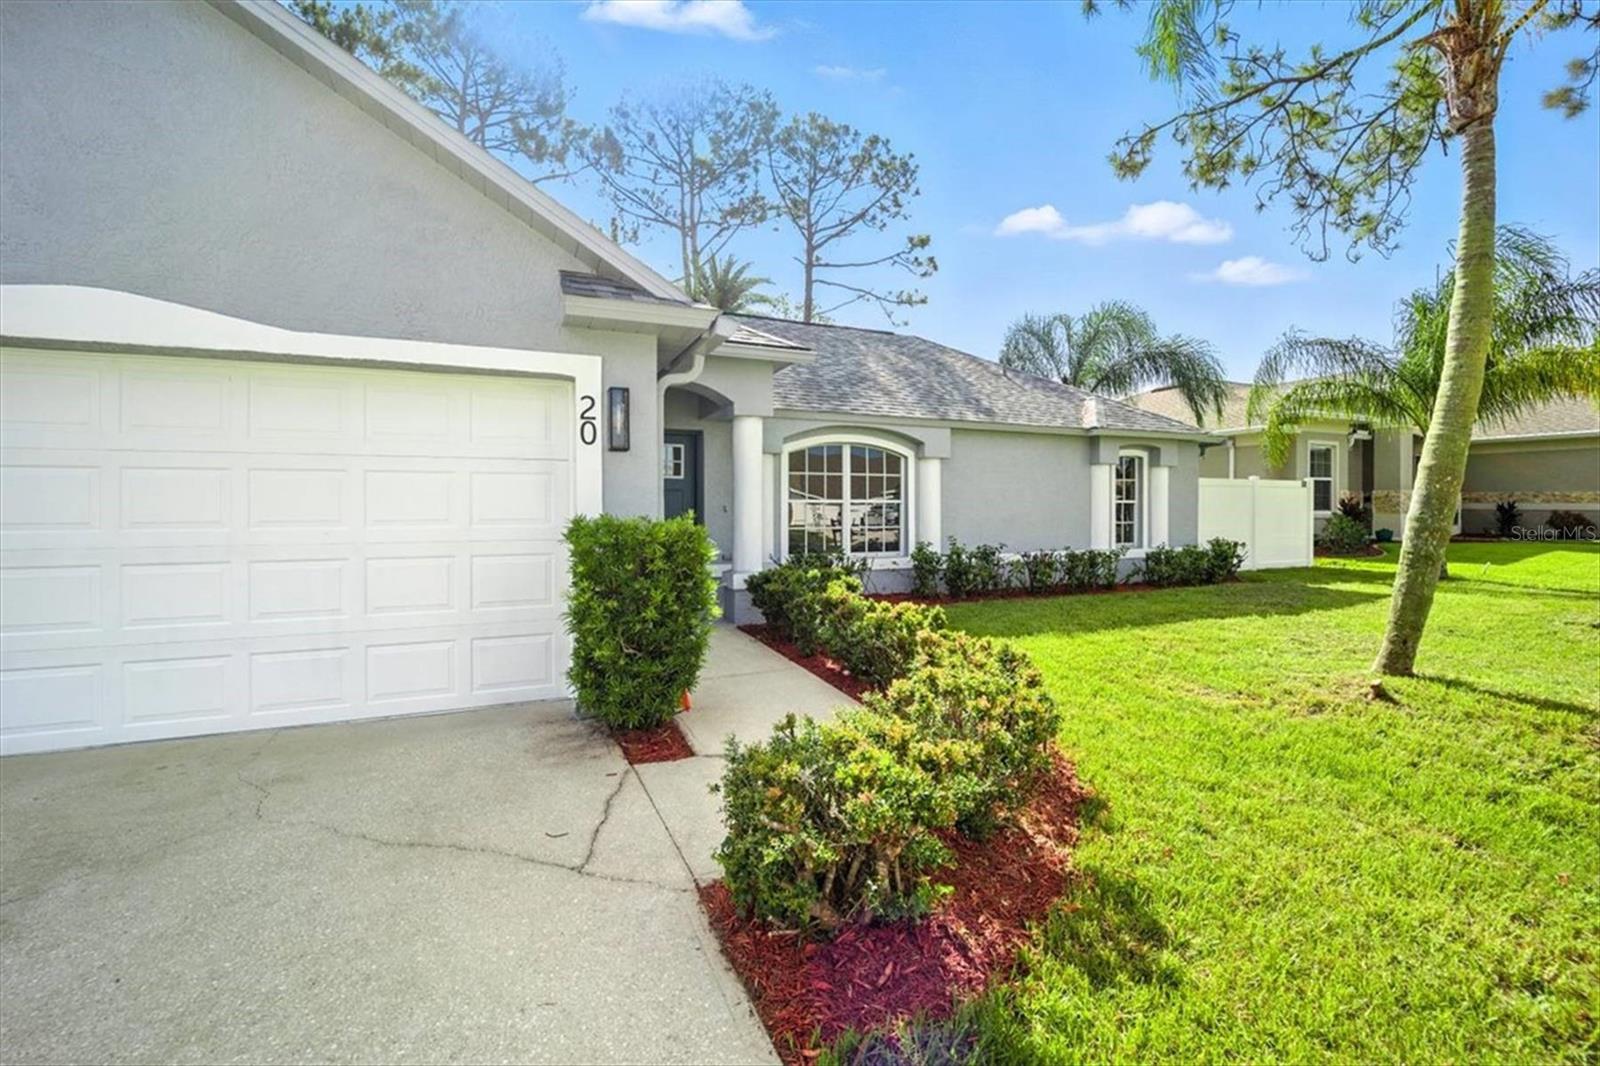
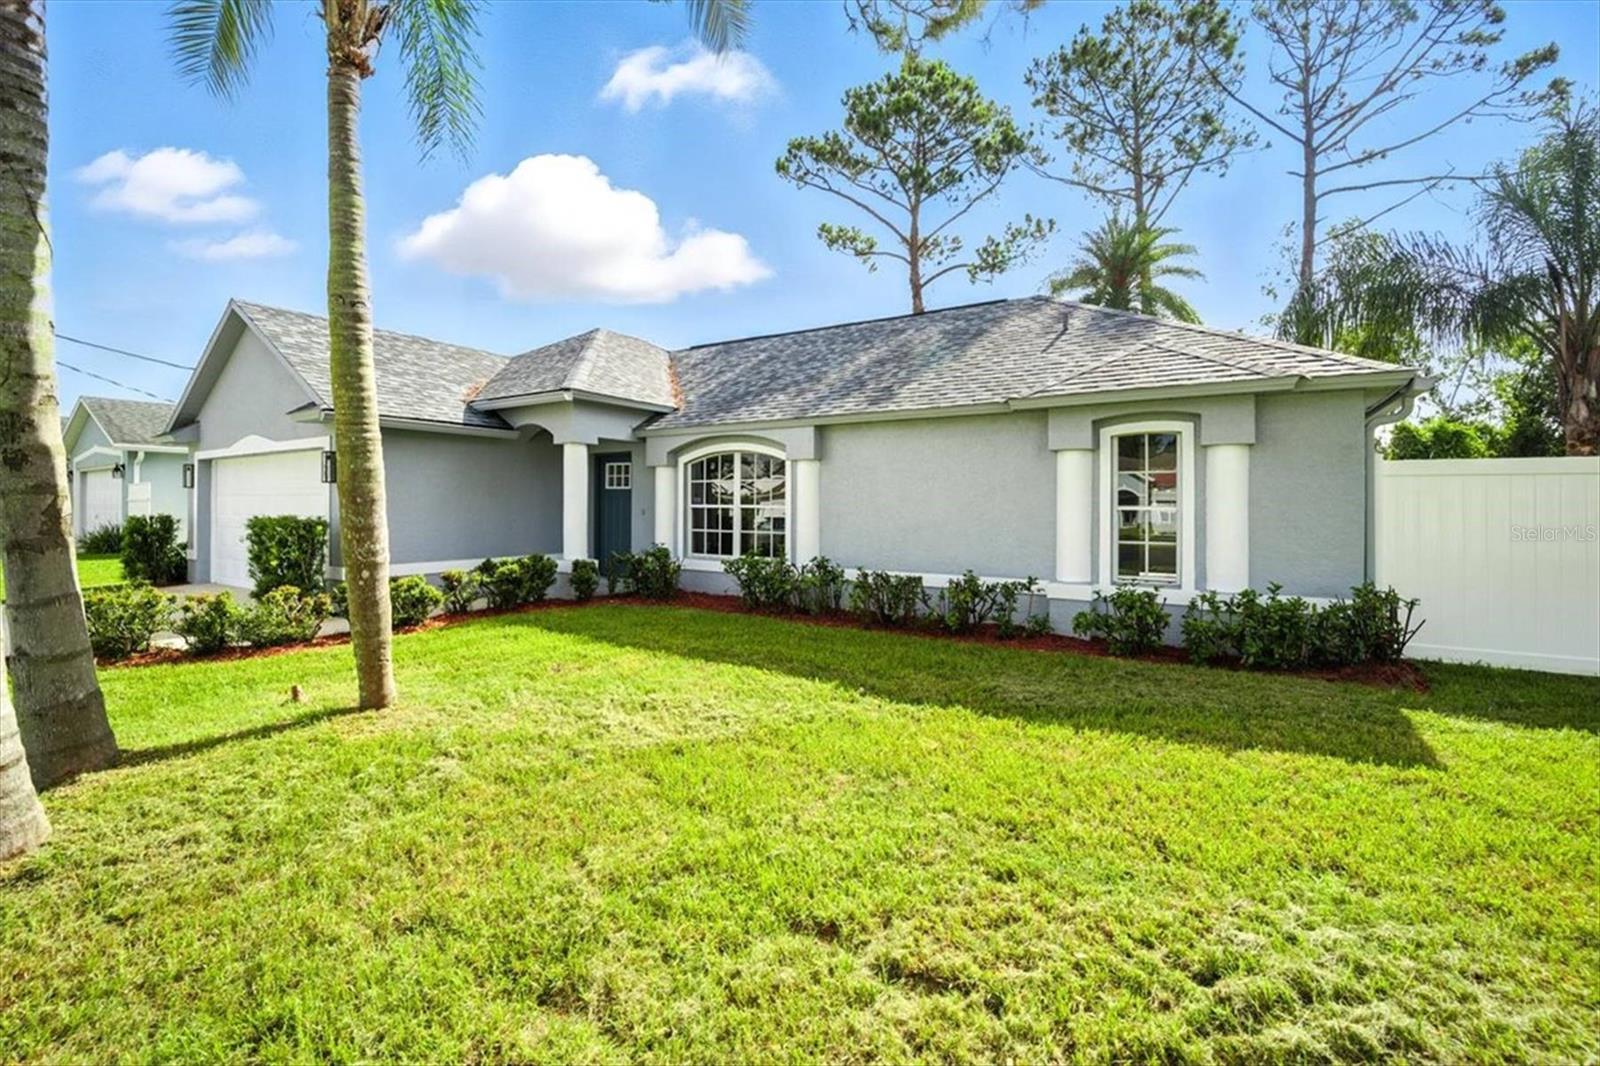
Property Description
Under contract-accepting backup offers. One or more photo(s) has been virtually staged. NEW Roof, NEW A/C, NEW kitchen With Granite CounterTop, NEW Stainless Steel Appliances, NEW Tile, NEW Bathrooms, NEW Lights, NEW Laminate Flooring, NEW Fence, NEW Grass, NEW Irrigation System, NEW Paint Inside and Outside, NEW Knock-down Ceiling. Welcome to this stunning custom-built landmark home in one of Palm Coast’s most desirable neighborhoods — a residence that perfectly blends modern design, full renovation, and timeless comfort. With 3 bedrooms, 2 bathrooms, and a 2-car garage, this property isn’t just move-in ready — it’s been completely reimagined into a showcase of style, light, and quality. From the moment you step inside, you’ll feel the unique character of this home. Expansive windows, rounded corners, soaring ceilings, and an abundance of natural light create an airy, uplifting atmosphere throughout. The thoughtful split floor plan offers both openness and functionality, featuring a separate dining room, family room, living room, and breakfast nook, giving you versatile spaces for everyday living and entertaining. The living room, centered cozy fireplace, flows seamlessly through French doors onto the covered screened porch, excellent for evenings under the Florida sky and barbeques with friends and families. At the heart of the home is a designer kitchen, fully remodeled with high 42-inch solid wood cabinetry, granite countertops, and premium Samsung stainless steel appliances. Its modern finishes and clean lines integrate beautifully with the home’s overall contemporary design. The owner’s suite is a personal retreat with a large walk-in closet and a newly remodeled bathroom featuring elegant tilework and modern fixtures. The guest bathroom has also been fully updated with the same designer touch, ensuring harmony in every corner. Practicality meets style with a convenient laundry room with a closet, making everyday living simple and efficient. This home is more than renovated — it’s completely renewed. Among the upgrades are a brand-new roof (2025), A/C (2022), new laminate flooring all over the house, fresh interior and exterior paint, new modern lighting fixtures, new irrigation system, and fresh landscaping with new lush green grass. The brand-new vinyl privacy fence not only frames the yard beautifully but also creates a sense of new privacy and seclusion, with plenty of room for a future pool. And while the updates shine, so does the setting: this property is surrounded by well-kept homes, quiet streets, and welcoming neighbors. It’s a community where pride of ownership is clear, and where this house stands out as a true landmark — a statement home of light, space, and style. This isn’t just another Palm Coast home — it’s a rare opportunity to own a fully remodeled, custom-built masterpiece designed for today’s living. With its abundance of light, modern elegance, and brand-new systems, this home is ready to impress its next owners from day one. Two photos have been virtually staged for visualization only.
Build Your Team
Quickly find investor-friendly professionals who can help you succeed in real estate investing at any stage of the investing journey.


Agents
Match with investor-friendly agents who can help you find, analyze, and close your next deal


Lenders
Get the best funding…find investor-friendly lenders who specialize in your deal strategy


Property Managers
Transition to passive investing. Find a trusted property management partnership that lasts.


Tax Pros & Accountants
Taxes and financial reporting made easy—find experts to create tax savings strategies, file taxes, and more
Location
Property Details
Parking
- Details: Garage Door Opener, Attached
- Garage Spaces: 2
- Spaces Total: 0
Bedroom Information
- # of Bedrooms: 3
Bathroom Information
- # of Baths (Full): 2
- # of Baths (Total): 2.0
Interior Features
- # of Rooms: 8
- # of Stories: 1
- Fireplace: Yes
Exterior Features
- Exterior Walls Materials: Stucco
- Foundation: Slab
- Roof Type: Gable or Hip
- Roof Material: Shingle
Land Information
- Land Use: Residential
- Land Use Subtype: Single Family Residential
Lot Information
- Parcel ID: 0711317027004600310
- Lot Size: 10019 sqft
Property Information
- Property Type: Single Family Residence
- Style: Contemporary, Custom, Traditional
- Year Built: 1999
Tax Information
- Annual Tax: $1,455
Utilities
- Water & Sewer: Public
- Heating: Central, Electric
- Cooling: Central Air
Location
- County: Flagler
Listing Details
Investment Summary
- Monthly Cash Flow
- -$513
- Cap Rate
- 4.2%
- Cash-on-Cash Return
- -8.4%
- Debt Coverage Ratio
- 0.69
- Internal Rate of Return (5 years)
- -4.1%
Cash Flow
Net Operating Income (NOI) minus mortgage payments.
Calculation:
NOI - Mortgage Payments
Cap Rate (Market Value)
Capitalization Rate is a rate of return that compares the yearly Net Operating Income (NOI) to the market value.
Calculation:
NOI / Market Value
Cash-on-Cash Return (CoC)
Annual Cash Flow / Cash Invested
Calculation:
Annual cash flow divided by initial cash invested.
Debt Coverage Ratio (DCR)
Net Operating Income (NOI) divided by total debt payments.
Calculation:
NOI / Total Debt Payments
Internal Rate of Return (IRR)
A metric for assessing profitability over time. IRR is the discount rate at which the net present value (NPV) of all future cash flows (positive and negative) from an investment equals zero — including both periodic cash flow (such as rent) and a projected sale at the end of the holding period. It represents the expected annualized return, accounting for income, expenses, and the recovery of capital through a future sale.
Purchase Details
Purchase PriceThe price paid for the property. Purchase price:
| $319,000 |
|---|---|
Amount FinancedThe amount of the purchase financed through a loan. Amount financed:
| -$255,200 |
Down paymentThe initial payment made towards the purchase. Down payment:
| $63,800 |
Closing CostsFees and expenses associated with purchasing a property, typically ranging from 2% to 5% of the home’s purchase price, paid at the end of a home purchase to cover services like lending, title transfer, and taxes. Closing costs:
| $9,570 |
Rehab CostsCosts incurred to repair or improve the property, including: roof, flooring, exterior siding, kitchen, exterior paint, bathrooms, etc. Rehab costs:
| $0 |
Initial Cash InvestedThe total initial cash invested in the property. Calculation:Down payment + Buying costs + Rehab costs Initial cash invested:
| $73,370 |
Square Feet (SQFT)The total square footage of the property. Square feet:
| 1,547 |
Cost Per Square FootCost per square foot of the property. Calculation:Purchase Price / Square Feet Cost per square foot:
| $206 |
Monthly Rent Per Square FootMonthly rent divided by the number of square feet. This ratio helps investors compare rental income efficiency across properties, markets, and unit sizes Calculation:Monthly Rent / Square Feet Monthly rent per square foot:
| $1.16 |
Financing Details
Loan AmountThe total sum of money borrowed from a lender to finance a property purchase. Calculation:Purchase Price - Down Payment
Loan amount:
| $255,200 |
|---|---|
Loan to Value Ratio (LTV)Loan amount divided by the market value of the property. Calculation:Loan Amount / Market Value
Loan to value ratio:
| 80.0% |
Loan TypeThe type of loan (e.g., fixed, adjustable).
Loan type:
| Amortizing |
TermThe loan repayment period in years.
Term:
| 30 years |
Interest RateThe percentage a lender charges on the borrowed amount of a loan, determining the cost of borrowing money.
Interest rate:
| 6.625% |
Principal & Interest (PI)The principal is the portion of the loan payment that reduces the loan balance. The interest is the lender's charge for borrowing money. Calculation:(P * r * (1 + r) ** n) / ((1 + r) ** n - 1) Where:
P = Loan amount (principal)
Principal & interest:
| $1,634 |
Property TaxesAnnual taxes levied by local governments on real estate properties. These taxes fund public services like schools, roads, and emergency services.
Property tax:
| $121 |
InsuranceThe costs for insurance coverage to protect against financial losses due to risks like fire, natural disasters, theft, liability, or tenant-related damages. Calculation:Assumes 7% of gross rental income, unless insurance rates are specified.
Insurance:
| $126 |
Private Mortgage Insurance (PMI)A fee that borrowers pay when they take out a conventional loan with a loan-to-value (LTV) ratio above 80%.
Private mortgage insurance (PMI):
| $0 |
Monthly PaymentThe fixed amount a borrower pays each month to repay a loan. It typically includes principal and interest (P&I) and may also cover property taxes, insurance, HOA fees, and PMI if escrowed. Monthly payment:
| $1,881 |
Operating Income
| % Rent | Monthly | Yearly | |
|---|---|---|---|
Gross RentThe total rental income received from tenants before deducting any expenses. Includes base rent, late fees, pet fees, parking fees, and other recurring charges.
Gross rent:
| $1,800 | $21,600 | |
Vacancy LossExpected loss of rent due to vacancies.
Vacancy loss:
(6%)
| 6% | -$108 | -$1,296 |
Operating IncomeGross rental income minus vacancy loss. Calculation:Gross rent - Vacancy loss
Operating income:
| $1,692 | $20,304 |
Operating Expenses
| % Rent | Monthly | Yearly | |
|---|---|---|---|
Property TaxesAnnual taxes levied by local governments on real estate properties. These taxes fund public services like schools, roads, and emergency services. | 7% | -$121 | -$1,455 |
InsuranceThe costs for insurance coverage to protect against financial losses due to risks like fire, natural disasters, theft, liability, or tenant-related damages. Calculation:Assumes 7% of gross rental income, unless insurance rates are specified. | 7% | -$126 | -$1,512 |
Property ManagementThe costs associated with hiring a property manager to handle the day-to-day operations of a rental property. Includes management fees, leasing fes, eviction fees, etc. Calculation:Assumes 8% of gross rental income. | 8% | -$144 | -$1,728 |
Repairs & MaintenanceOngoing costs for routine upkeep and minor fixes needed to keep a property in good working condition. Calculation:Assumes 5% of gross rental income. Varies by property age and condition. | 5% | -$90 | -$1,080 |
Capital ExpensesLarge, infrequent costs for major improvements or replacements, like a new roof, HVAC system, or appliances. Calculation:Assumes 5% of gross rental income. Varies by property age. | 5% | -$90 | -$1,080 |
HOA FeesRegular dues paid to a Homeowners Association for community maintenance, amenities, and management. Similar fees include: Condo Association Fees, Co-op Maintenance Fees, etc. | n/a | n/a | n/a |
Operating ExpensesRecurring costs required to maintain and manage a rental property, including property taxes, insurance, maintenance, repairs, utilities (if paid by the owner), property management fees, and other day-to-day expenses. Calculation:Insurance + Property Taxes + Property Management + Repairs & Maintenance + Capital Expenditures + HOA Fees | 32% | -$571 | -$6,855 |
Cash Flow
| Monthly | Yearly | |
|---|---|---|
Net Operating Income (NOI)The income generated from a property after deducting all operating expenses but before deducting mortgage payments, taxes, and capital expenditures. Calculation:Gross Operating Income - Operating Expenses
Net operating income:
| $1,121 | $13,452 |
Mortgage PaymentThe fixed amount a borrower pays each month to repay a loan. It typically includes principal and interest (P&I) and may also cover property taxes, insurance, HOA fees, and PMI if escrowed. | -$1,634 | -$19,608 |
Cash FlowNet Operating Income (NOI) minus mortgage payments. Calculation:NOI - Mortgage Payments | -$513 | -$6,156 |