$16,500,000
Investment Summary
We noticed that property taxes are missing—this is a standard expense and should be considered in your estimate.
- Monthly Cash Flow
- -$72,011
- Cap Rate
- 0.4%
- Cash-on-Cash Return
- -22.8%
- Debt Coverage Ratio
- 0.08
- Internal Rate of Return (5 years)
- -18.0%
Cash Flow
Net Operating Income (NOI) minus mortgage payments.
Calculation:
NOI - Mortgage Payments
Cap Rate (Market Value)
Capitalization Rate is a rate of return that compares the yearly Net Operating Income (NOI) to the market value.
Calculation:
NOI / Market Value
Cash-on-Cash Return (CoC)
Annual Cash Flow / Cash Invested
Calculation:
Annual cash flow divided by initial cash invested.
Debt Coverage Ratio (DCR)
Net Operating Income (NOI) divided by total debt payments.
Calculation:
NOI / Total Debt Payments
Internal Rate of Return (IRR)
A metric for assessing profitability over time. IRR is the discount rate at which the net present value (NPV) of all future cash flows (positive and negative) from an investment equals zero — including both periodic cash flow (such as rent) and a projected sale at the end of the holding period. It represents the expected annualized return, accounting for income, expenses, and the recovery of capital through a future sale.
Property Description
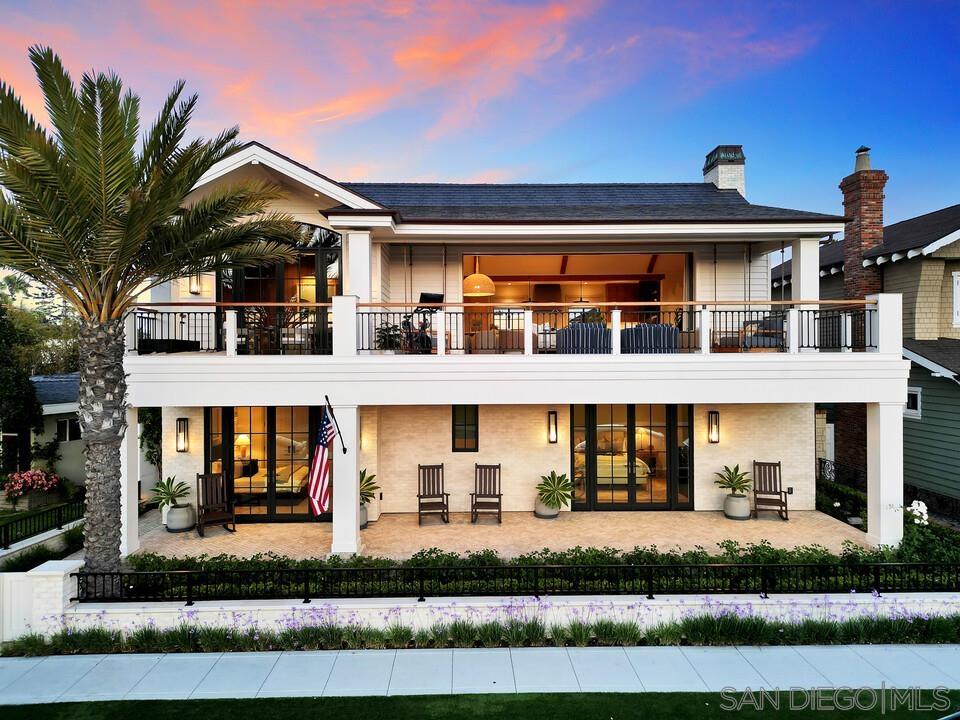
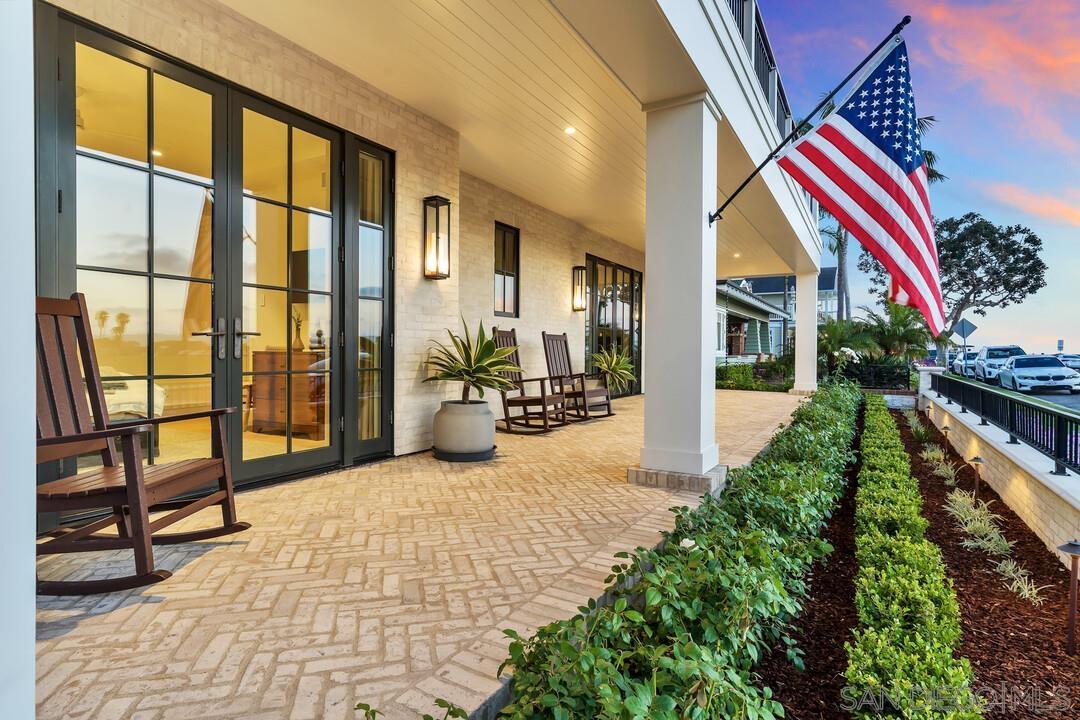
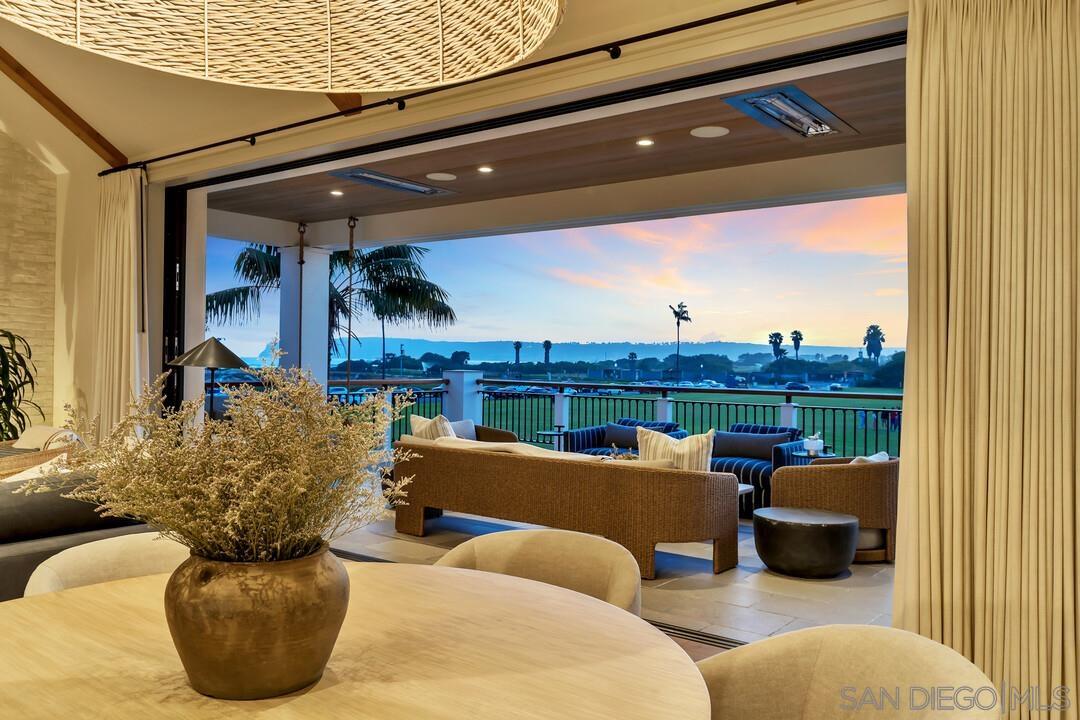
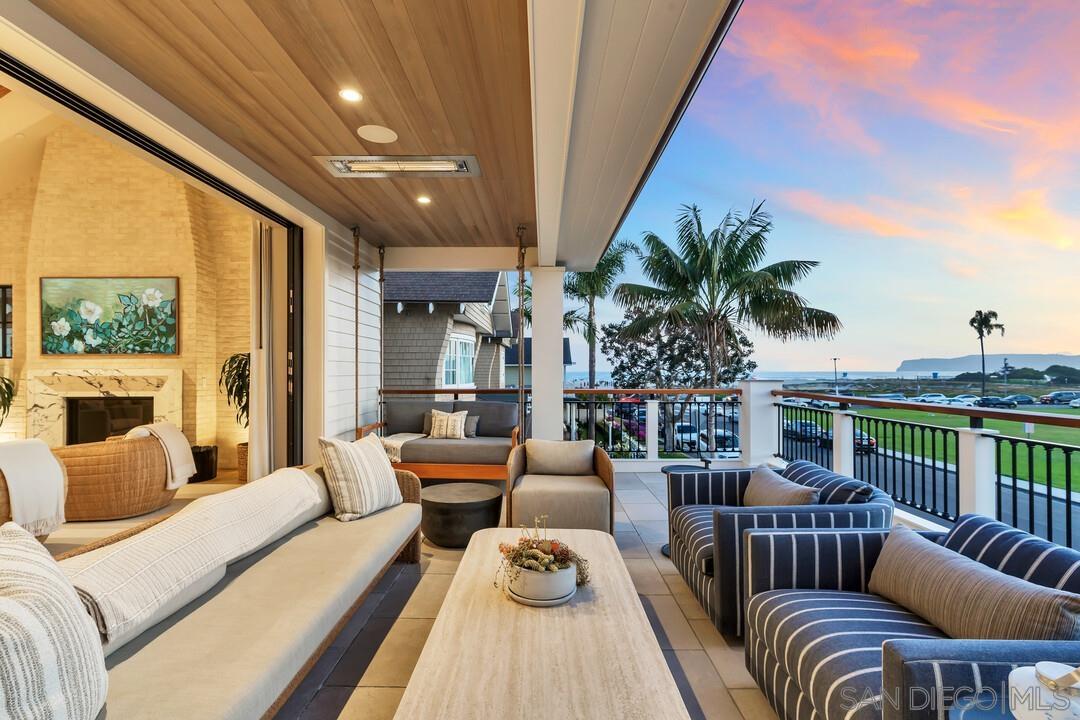
Custom Coastal Masterpiece Overlooking Sunset Park & North Beach In one of Coronado Island’s most coveted locations, this exceptional custom-built residence—completed in 2023 - embodies the pinnacle of elevated coastal living. With sweeping views of Sunset Park, North Beach, and the Pacific Ocean, the home is a masterful collaboration between architect Christian Rice, AIA, premier builder Shane Durkin of Patriot High Performance Homes, and the acclaimed interior design firm McCormick and Wright. Created with a commitment to delivering the highest and best quality for beach living, this home sets itself apart through extraordinary craftsmanship, innovation, and performance. Durkin’s dedication to precision construction is evident throughout- from air-tight building techniques and full soundproofing to energy-efficient systems and a dedicated whole-home ventilation system that keeps contaminants out, ensuring a quieter, cleaner, and healthier indoor environment year-round. Thoughtfully designed with a reverse floor plan to maximize privacy and panoramic views, the upper level features soaring vaulted ceilings and expansive sightlines that frame the ocean beyond. The great room centers around a dramatic fireplace and includes a custom bar, elegant dining area, and a chef’s kitchen appointed with top-of-the-line appliances - including a coveted La Cornue range-and a generous butler’s pantry, ideal for both entertaining and everyday living. A beautifully appointed office opens to a covered outdoor deck, seamlessly blending productivity and relaxation. SEE SUPPLEMENT On the entry level, three luxurious bedroom suites offer restful retreats, including a spectacular primary suite that opens to the private backyard. This serene sanctuary includes dual vanities, a steam shower, sauna, and a custom walk-in closet - crafted for ultimate comfort and tranquility. Throughout the home, wide-plank oak flooring, custom shiplap walls, and hand-selected stone and tile evoke timeless coastal elegance. Outdoor living is equally inspired. The backyard is a lush, private oasis featuring a sparkling pool, jacuzzi, wood-burning fireplace, and manicured landscaping—perfect for entertaining or quiet repose. Atop the home, a rooftop deck delivers panoramic ocean views, a cozy fire pit lounge, and unforgettable sunsets that define the Coronado lifestyle. Additional amenities include solar power, a zoned HVAC system, an elevator, and a two-car garage plus two uncovered parking spaces. Offered fully furnished with designer-curated pieces, this home is turnkey and ready for immediate enjoyment. Priced at $16,500,000 this is a rare opportunity to own a one-of-a-kind coastal masterpiece that pairs timeless design with high-performance living in one of Coronado’s most desirable setting
Build Your Team
Quickly find investor-friendly professionals who can help you succeed in real estate investing at any stage of the investing journey.


Agents
Match with investor-friendly agents who can help you find, analyze, and close your next deal


Lenders
Get the best funding…find investor-friendly lenders who specialize in your deal strategy


Property Managers
Transition to passive investing. Find a trusted property management partnership that lasts.


Tax Pros & Accountants
Taxes and financial reporting made easy—find experts to create tax savings strategies, file taxes, and more
Location
Property Details
Parking
- Description: Garage
- Details: Garage Door Opener, Detached
- Garage Spaces: 2
- Spaces Total: 4
Bedroom Information
- # of Bedrooms: 3
Bathroom Information
- # of Baths (Full): 3
- # of Baths (Total): 5.0
Interior Features
- # of Stories: 2
- Fireplace: Yes
Exterior Features
- Roof Material: Slate
- Pool: Yes
Land Information
- Land Use: Residential
- Land Use Subtype: Single Family Residential
Lot Information
- Parcel ID: 5373932000
- Lot Size: 0 sqft
Property Information
- Property Type: Single Family Residence
- Year Built: 2023
Tax Information
- Annual Tax: $0
Utilities
- Heating: Forced Air, Zoned, Natural Gas
- Cooling: Zoned, Central Air
Location
- County: San Diego
Listing Details
Investment Summary
We noticed that property taxes are missing—this is a standard expense and should be considered in your estimate.
- Monthly Cash Flow
- -$72,011
- Cap Rate
- 0.4%
- Cash-on-Cash Return
- -22.8%
- Debt Coverage Ratio
- 0.08
- Internal Rate of Return (5 years)
- -18.0%
Cash Flow
Net Operating Income (NOI) minus mortgage payments.
Calculation:
NOI - Mortgage Payments
Cap Rate (Market Value)
Capitalization Rate is a rate of return that compares the yearly Net Operating Income (NOI) to the market value.
Calculation:
NOI / Market Value
Cash-on-Cash Return (CoC)
Annual Cash Flow / Cash Invested
Calculation:
Annual cash flow divided by initial cash invested.
Debt Coverage Ratio (DCR)
Net Operating Income (NOI) divided by total debt payments.
Calculation:
NOI / Total Debt Payments
Internal Rate of Return (IRR)
A metric for assessing profitability over time. IRR is the discount rate at which the net present value (NPV) of all future cash flows (positive and negative) from an investment equals zero — including both periodic cash flow (such as rent) and a projected sale at the end of the holding period. It represents the expected annualized return, accounting for income, expenses, and the recovery of capital through a future sale.
Purchase Details
Purchase PriceThe price paid for the property. Purchase price:
| $16,500,000 |
|---|---|
Amount FinancedThe amount of the purchase financed through a loan. Amount financed:
| -$13,200,000 |
Down paymentThe initial payment made towards the purchase. Down payment:
| $3,300,000 |
Closing CostsFees and expenses associated with purchasing a property, typically ranging from 2% to 5% of the home’s purchase price, paid at the end of a home purchase to cover services like lending, title transfer, and taxes. Closing costs:
| $495,000 |
Rehab CostsCosts incurred to repair or improve the property, including: roof, flooring, exterior siding, kitchen, exterior paint, bathrooms, etc. Rehab costs:
| $0 |
Initial Cash InvestedThe total initial cash invested in the property. Calculation:Down payment + Buying costs + Rehab costs Initial cash invested:
| $3,795,000 |
Square Feet (SQFT)The total square footage of the property. Square feet:
| 3,467 |
Cost Per Square FootCost per square foot of the property. Calculation:Purchase Price / Square Feet Cost per square foot:
| $4,759 |
Monthly Rent Per Square FootMonthly rent divided by the number of square feet. This ratio helps investors compare rental income efficiency across properties, markets, and unit sizes Calculation:Monthly Rent / Square Feet Monthly rent per square foot:
| $2.54 |
Financing Details
Loan AmountThe total sum of money borrowed from a lender to finance a property purchase. Calculation:Purchase Price - Down Payment
Loan amount:
| $13,200,000 |
|---|---|
Loan to Value Ratio (LTV)Loan amount divided by the market value of the property. Calculation:Loan Amount / Market Value
Loan to value ratio:
| 80.0% |
Loan TypeThe type of loan (e.g., fixed, adjustable).
Loan type:
| Amortizing |
TermThe loan repayment period in years.
Term:
| 30 years |
Interest RateThe percentage a lender charges on the borrowed amount of a loan, determining the cost of borrowing money.
Interest rate:
| 5.875% |
Principal & Interest (PI)The principal is the portion of the loan payment that reduces the loan balance. The interest is the lender's charge for borrowing money. Calculation:(P * r * (1 + r) ** n) / ((1 + r) ** n - 1) Where:
P = Loan amount (principal)
Principal & interest:
| $78,083 |
Property TaxesAnnual taxes levied by local governments on real estate properties. These taxes fund public services like schools, roads, and emergency services.
Property tax:
| $0 |
InsuranceThe costs for insurance coverage to protect against financial losses due to risks like fire, natural disasters, theft, liability, or tenant-related damages. Calculation:Assumes 7% of gross rental income, unless insurance rates are specified.
Insurance:
| $616 |
Private Mortgage Insurance (PMI)A fee that borrowers pay when they take out a conventional loan with a loan-to-value (LTV) ratio above 80%.
Private mortgage insurance (PMI):
| $0 |
Monthly PaymentThe fixed amount a borrower pays each month to repay a loan. It typically includes principal and interest (P&I) and may also cover property taxes, insurance, HOA fees, and PMI if escrowed. Monthly payment:
| $78,699 |
Operating Income
| % Rent | Monthly | Yearly | |
|---|---|---|---|
Gross RentThe total rental income received from tenants before deducting any expenses. Includes base rent, late fees, pet fees, parking fees, and other recurring charges.
Gross rent:
| $8,800 | $105,600 | |
Vacancy LossExpected loss of rent due to vacancies.
Vacancy loss:
(6%)
| 6% | -$528 | -$6,336 |
Operating IncomeGross rental income minus vacancy loss. Calculation:Gross rent - Vacancy loss
Operating income:
| $8,272 | $99,264 |
Operating Expenses
| % Rent | Monthly | Yearly | |
|---|---|---|---|
Property TaxesAnnual taxes levied by local governments on real estate properties. These taxes fund public services like schools, roads, and emergency services.
We noticed that property taxes are missing—these are standard expenses and should be considered in your estimate. | n/a | n/a | n/a |
InsuranceThe costs for insurance coverage to protect against financial losses due to risks like fire, natural disasters, theft, liability, or tenant-related damages. Calculation:Assumes 7% of gross rental income, unless insurance rates are specified. | 7% | -$616 | -$7,392 |
Property ManagementThe costs associated with hiring a property manager to handle the day-to-day operations of a rental property. Includes management fees, leasing fes, eviction fees, etc. Calculation:Assumes 8% of gross rental income. | 8% | -$704 | -$8,448 |
Repairs & MaintenanceOngoing costs for routine upkeep and minor fixes needed to keep a property in good working condition. Calculation:Assumes 5% of gross rental income. Varies by property age and condition. | 5% | -$440 | -$5,280 |
Capital ExpensesLarge, infrequent costs for major improvements or replacements, like a new roof, HVAC system, or appliances. Calculation:Assumes 5% of gross rental income. Varies by property age. | 5% | -$440 | -$5,280 |
HOA FeesRegular dues paid to a Homeowners Association for community maintenance, amenities, and management. Similar fees include: Condo Association Fees, Co-op Maintenance Fees, etc. | n/a | n/a | n/a |
Operating ExpensesRecurring costs required to maintain and manage a rental property, including property taxes, insurance, maintenance, repairs, utilities (if paid by the owner), property management fees, and other day-to-day expenses. Calculation:Insurance + Property Taxes + Property Management + Repairs & Maintenance + Capital Expenditures + HOA Fees | 25% | -$2,200 | -$26,400 |
Cash Flow
| Monthly | Yearly | |
|---|---|---|
Net Operating Income (NOI)The income generated from a property after deducting all operating expenses but before deducting mortgage payments, taxes, and capital expenditures. Calculation:Gross Operating Income - Operating Expenses
Net operating income:
| $6,072 | $72,864 |
Mortgage PaymentThe fixed amount a borrower pays each month to repay a loan. It typically includes principal and interest (P&I) and may also cover property taxes, insurance, HOA fees, and PMI if escrowed. | -$78,083 | -$936,996 |
Cash FlowNet Operating Income (NOI) minus mortgage payments. Calculation:NOI - Mortgage Payments | -$72,011 | -$864,132 |