$669,990
Investment Summary
- Monthly Cash Flow
- -$2,014
- Cap Rate
- 2.5%
- Cash-on-Cash Return
- -15.7%
- Debt Coverage Ratio
- 0.41
- Internal Rate of Return (5 years)
- -11.2%
Cash Flow
Net Operating Income (NOI) minus mortgage payments.
Calculation:
NOI - Mortgage Payments
Cap Rate (Market Value)
Capitalization Rate is a rate of return that compares the yearly Net Operating Income (NOI) to the market value.
Calculation:
NOI / Market Value
Cash-on-Cash Return (CoC)
Annual Cash Flow / Cash Invested
Calculation:
Annual cash flow divided by initial cash invested.
Debt Coverage Ratio (DCR)
Net Operating Income (NOI) divided by total debt payments.
Calculation:
NOI / Total Debt Payments
Internal Rate of Return (IRR)
A metric for assessing profitability over time. IRR is the discount rate at which the net present value (NPV) of all future cash flows (positive and negative) from an investment equals zero — including both periodic cash flow (such as rent) and a projected sale at the end of the holding period. It represents the expected annualized return, accounting for income, expenses, and the recovery of capital through a future sale.
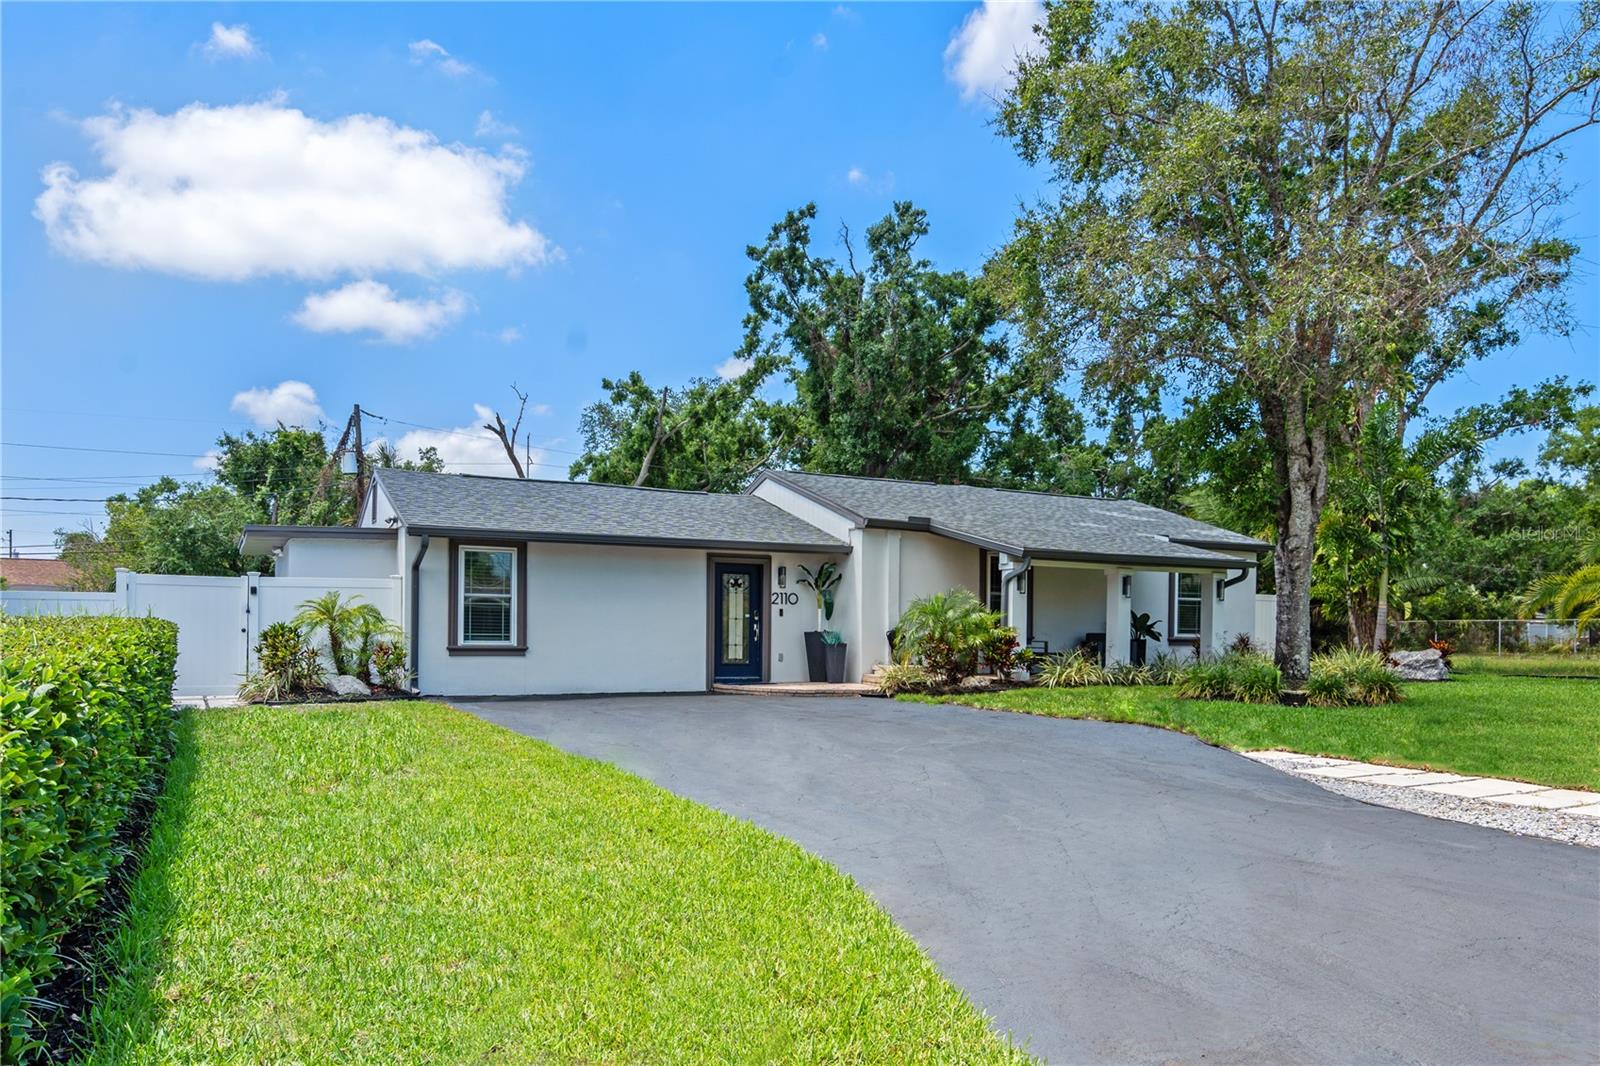
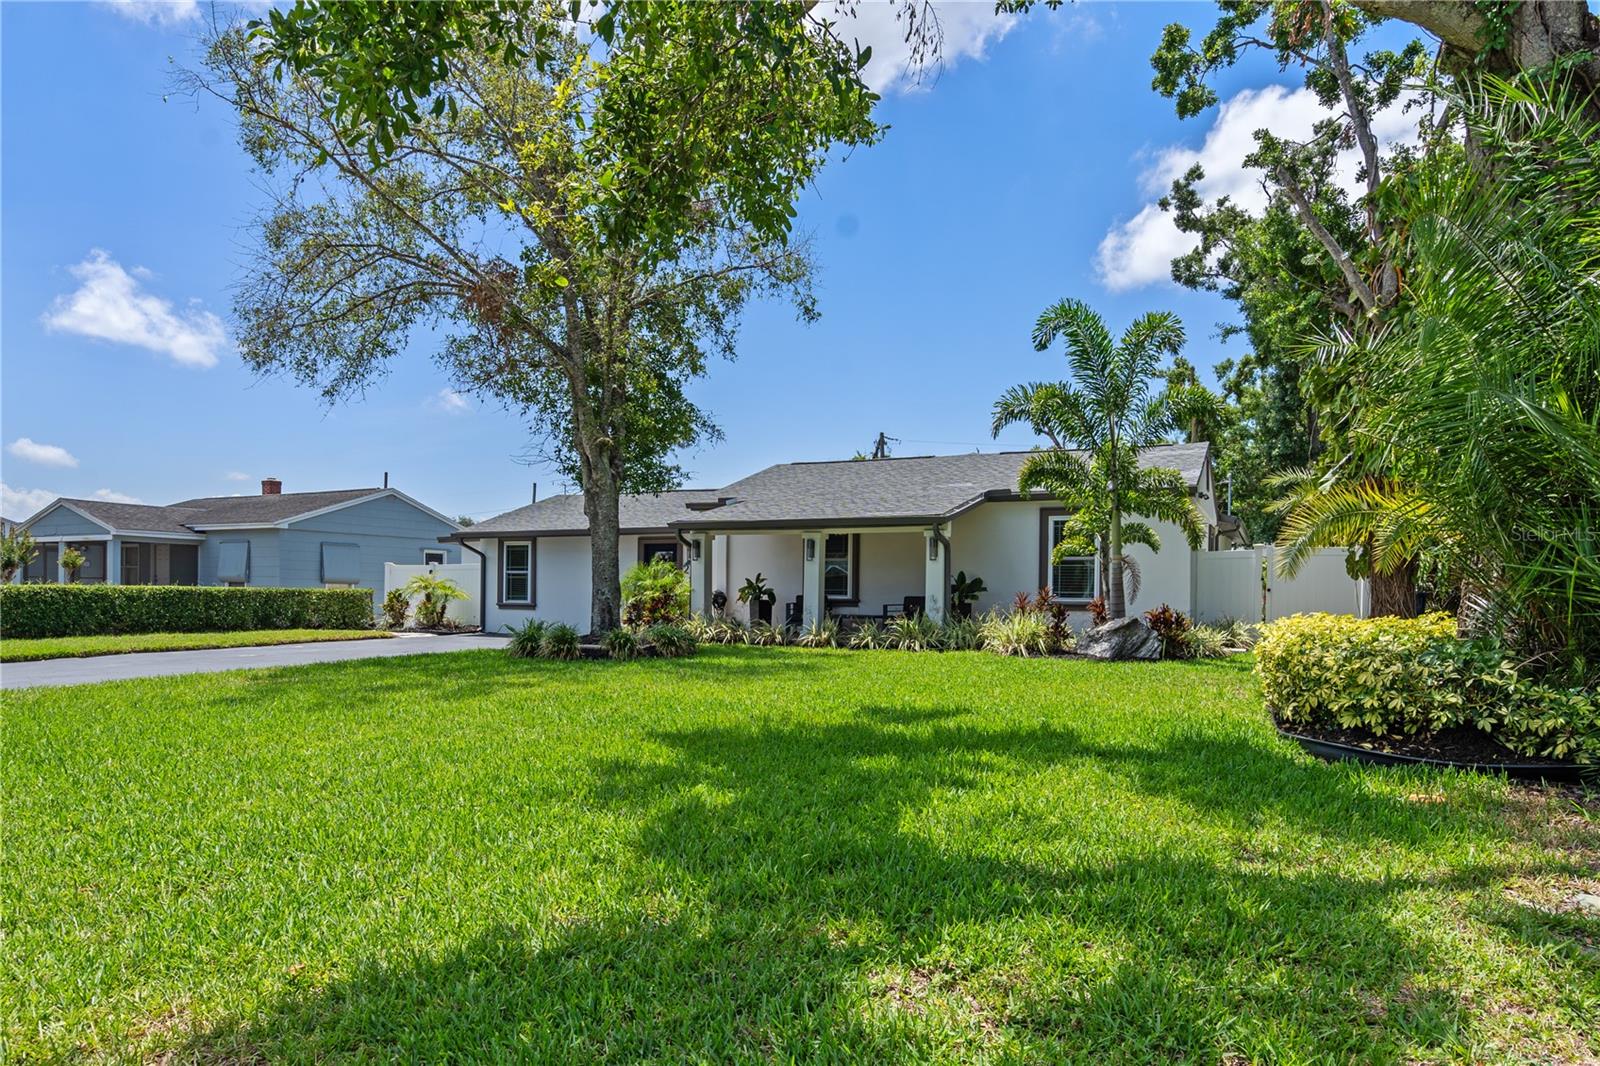
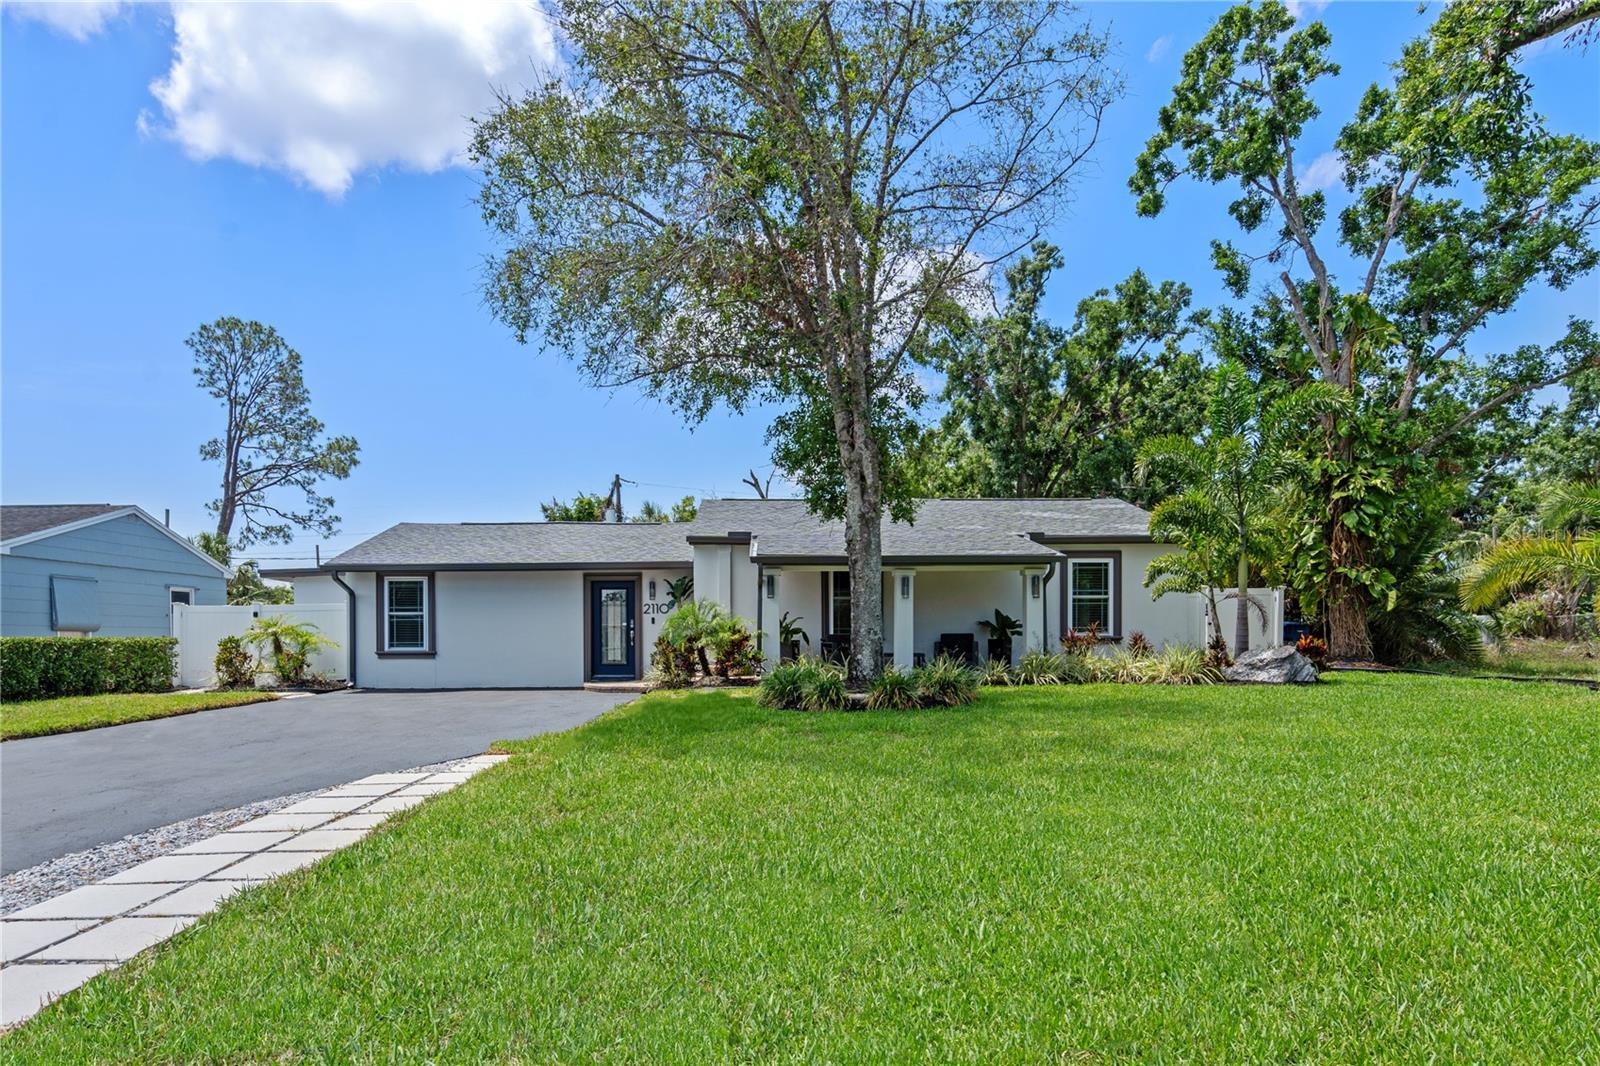
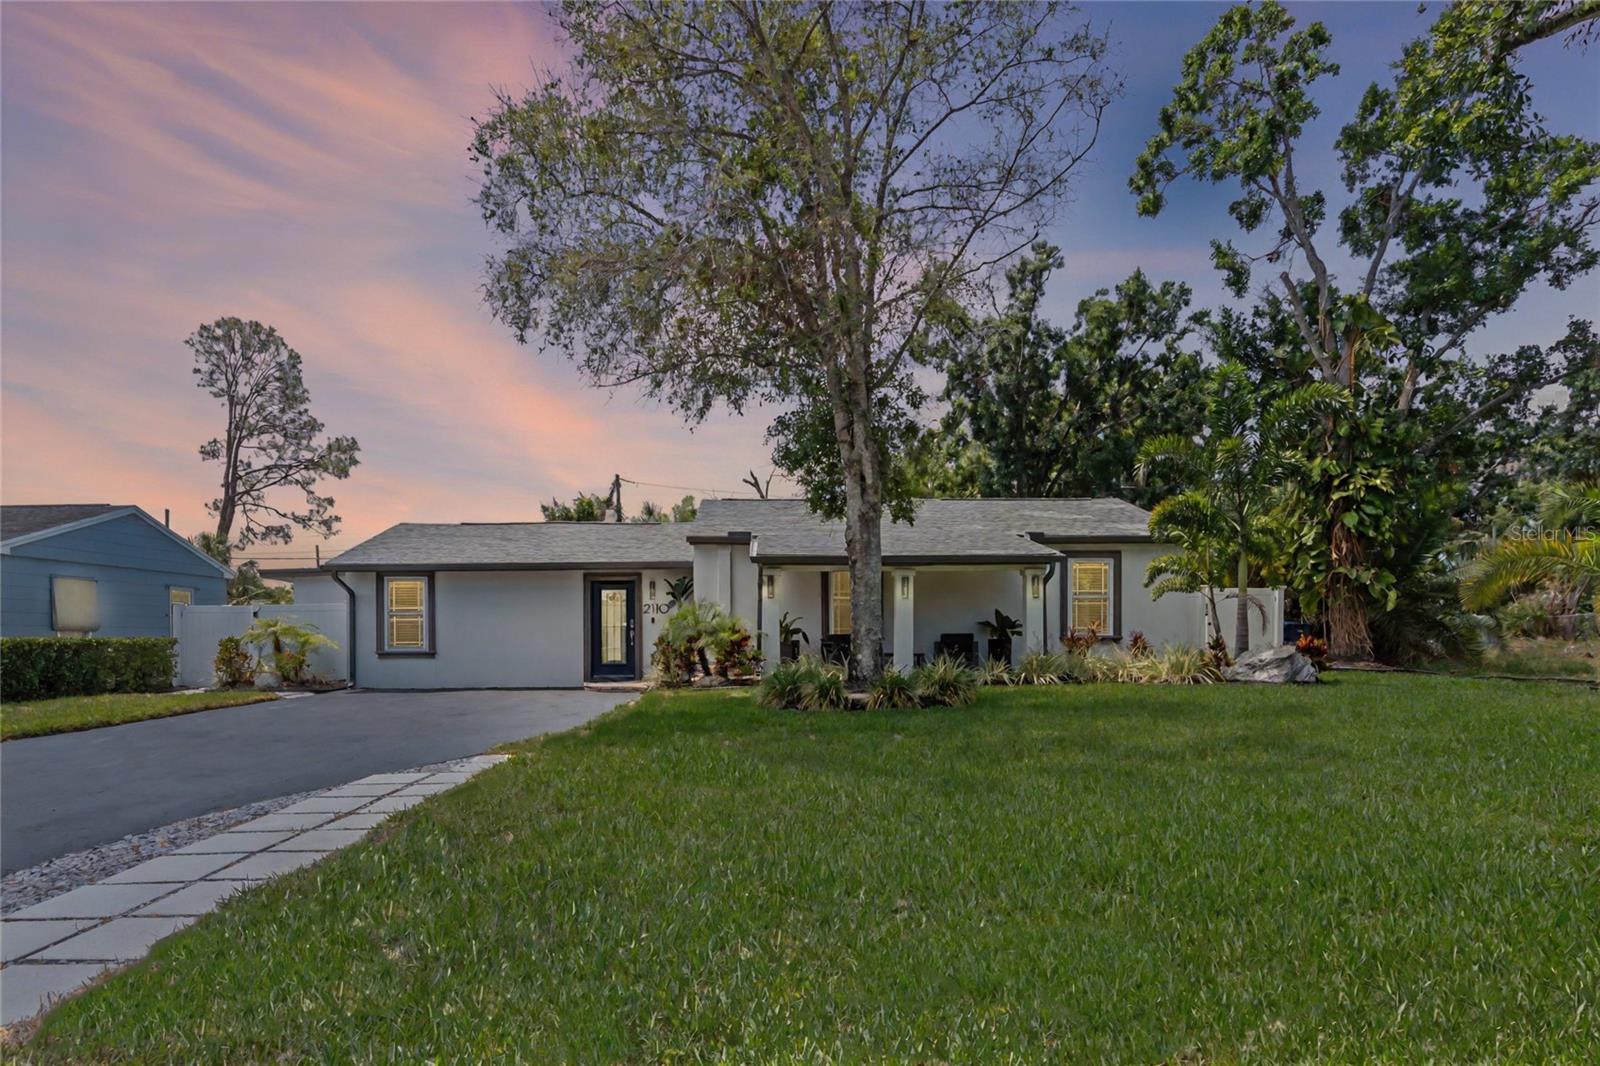
Property Description
**PRICED NEARLY $15,000 UNDER APPRAISAL VALUE!** Lovingly Maintained in a Prime Location! Conveniently situated on just shy of a quarter acre lot in the HIGHLY DESIRABLE neighborhood of WELLSWOOD and exuding charm from the curb with its picturesque front facade, this 4-bed, 3-bath home is sure to make a lasting first impression. Large HURRICANE IMPACT WINDOWS (2019) bathe the interiors in NATURAL LIGHT, enhancing the welcoming atmosphere and highlighting the tasteful, updated finishes throughout. The beautifully maintained home comes with a NEWER ROOF (2022) and HVACs (2020/2024) for added peace of mind. The nearly 2,800 square foot home boasts a spacious, OPEN-CONCEPT layout designed for both relaxation and entertaining. Upon entry, you'll be greeted by a spacious foyer, accented with the warmth of a GAS FIREPLACE, which is situated adjacent to your FORMAL DINING ROOM. The large kitchen flowers effortlessly into the living and casual dining areas for ultimate functionality. Offering both convenience and aesthetics, the U-SHAPED KITCHEN is a culinary delight, featuring modern appliances, ample cabinet and countertop space, and CABINET ORGANIZERS, making cooking a joy rather than a chore. Accompanying the bright and airy living room and casual dining nook is a CUSTOM-DESIGNED DRY BAR. Seamlessly blending style, sophistication, and functionality, this bonus features ample cabinet space and two (2) built-in wine and beverage refrigerators, making a space perfect for both intimate evenings and lively gatherings. The SPLIT FLOOR PLAN boasts an EXPANSIVE MASTER SUITE located at the rear of the home, providing comfort and privacy... with the bonus of his-and-her walk-in closets! The spacious en-suite master bathroom offers a serene space to unwind at the end of the day, complete with a large JETTED TUB and shower combo. Completing the layout of the home are three (3) VERY GENEROUSLY SIZED guest bedrooms and two (2) well-appointed guest bathrooms. The tastefully REMODELED GUEST BATHROOM (2023) in the rear of the home is adorned with beautiful MARBLE FINISHES, complete with a glass-enclosed WALK-IN SHOWER and LED MIRROR. Outside, the spacious PAVER PATIO provides a serene outdoor retreat, featuring a OUTDOOR GRILL and FIREPIT- perfect for entertaining year-round. Other highlights include: an IRRIGATION SYSTEM (2020), fresh landscaping (2020/2025), a freshly sealed asphalt driveway (2020), and extra storage both inside and out, provided by the LARGE LAUNDRY ROOM, multiple utility closets, an ATTACHED STORAGE ROOM accessible from the exterior, and a DETACHED STORAGE SHED! Situated in the heart of Tampa, this home offers UNPARALLELED ACCESS to local amenities - only 5 minutes from Armature Works, 7 minutes from Downtown, 10 minutes from Ybor, the Tampa Airport and Midtown, and less than 15 minutes from Hyde Park Village! LOCATION, LOCATION, LOCATION! You don’t want to miss this gem in the heart of Tampa! Schedule your private showing today! [One or more photo(s) has been virtually staged]
Build Your Team
Quickly find investor-friendly professionals who can help you succeed in real estate investing at any stage of the investing journey.


Agents
Match with investor-friendly agents who can help you find, analyze, and close your next deal


Lenders
Get the best funding…find investor-friendly lenders who specialize in your deal strategy


Property Managers
Transition to passive investing. Find a trusted property management partnership that lasts.


Tax Pros & Accountants
Taxes and financial reporting made easy—find experts to create tax savings strategies, file taxes, and more
Location
Property Details
Parking
- Details: Driveway, On Street, Tandem
- Garage Spaces: 0
- Spaces Total: 0
Bedroom Information
- # of Bedrooms: 4
Bathroom Information
- # of Baths (Full): 3
- # of Baths (Total): 3.0
Interior Features
- # of Rooms: 13
- # of Stories: 1
- Fireplace: Yes
Exterior Features
- Exterior Walls Materials: Stucco
- Foundation: Slab
- Roof Type: Gable or Hip
- Roof Material: Shingle
Land Information
- Land Use: Residential
- Land Use Subtype: Single Family Residential
Lot Information
- Parcel ID: A0229183HO000037000120
- Lot Size: 9499 sqft
Property Information
- Property Type: Single Family Residence
- Year Built: 1948
Tax Information
- Annual Tax: $2,023
Utilities
- Water & Sewer: None
- Heating: Electric
- Cooling: Central Air
Location
- County: Hillsborough
Listing Details
Investment Summary
- Monthly Cash Flow
- -$2,014
- Cap Rate
- 2.5%
- Cash-on-Cash Return
- -15.7%
- Debt Coverage Ratio
- 0.41
- Internal Rate of Return (5 years)
- -11.2%
Cash Flow
Net Operating Income (NOI) minus mortgage payments.
Calculation:
NOI - Mortgage Payments
Cap Rate (Market Value)
Capitalization Rate is a rate of return that compares the yearly Net Operating Income (NOI) to the market value.
Calculation:
NOI / Market Value
Cash-on-Cash Return (CoC)
Annual Cash Flow / Cash Invested
Calculation:
Annual cash flow divided by initial cash invested.
Debt Coverage Ratio (DCR)
Net Operating Income (NOI) divided by total debt payments.
Calculation:
NOI / Total Debt Payments
Internal Rate of Return (IRR)
A metric for assessing profitability over time. IRR is the discount rate at which the net present value (NPV) of all future cash flows (positive and negative) from an investment equals zero — including both periodic cash flow (such as rent) and a projected sale at the end of the holding period. It represents the expected annualized return, accounting for income, expenses, and the recovery of capital through a future sale.
Purchase Details
Purchase PriceThe price paid for the property. Purchase price:
| $669,990 |
|---|---|
Amount FinancedThe amount of the purchase financed through a loan. Amount financed:
| -$535,992 |
Down paymentThe initial payment made towards the purchase. Down payment:
| $133,998 |
Closing CostsFees and expenses associated with purchasing a property, typically ranging from 2% to 5% of the home’s purchase price, paid at the end of a home purchase to cover services like lending, title transfer, and taxes. Closing costs:
| $20,100 |
Rehab CostsCosts incurred to repair or improve the property, including: roof, flooring, exterior siding, kitchen, exterior paint, bathrooms, etc. Rehab costs:
| $0 |
Initial Cash InvestedThe total initial cash invested in the property. Calculation:Down payment + Buying costs + Rehab costs Initial cash invested:
| $154,098 |
Square Feet (SQFT)The total square footage of the property. Square feet:
| 2,760 |
Cost Per Square FootCost per square foot of the property. Calculation:Purchase Price / Square Feet Cost per square foot:
| $243 |
Monthly Rent Per Square FootMonthly rent divided by the number of square feet. This ratio helps investors compare rental income efficiency across properties, markets, and unit sizes Calculation:Monthly Rent / Square Feet Monthly rent per square foot:
| $0.83 |
Financing Details
Loan AmountThe total sum of money borrowed from a lender to finance a property purchase. Calculation:Purchase Price - Down Payment
Loan amount:
| $535,992 |
|---|---|
Loan to Value Ratio (LTV)Loan amount divided by the market value of the property. Calculation:Loan Amount / Market Value
Loan to value ratio:
| 80.0% |
Loan TypeThe type of loan (e.g., fixed, adjustable).
Loan type:
| Amortizing |
TermThe loan repayment period in years.
Term:
| 30 years |
Interest RateThe percentage a lender charges on the borrowed amount of a loan, determining the cost of borrowing money.
Interest rate:
| 6.625% |
Principal & Interest (PI)The principal is the portion of the loan payment that reduces the loan balance. The interest is the lender's charge for borrowing money. Calculation:(P * r * (1 + r) ** n) / ((1 + r) ** n - 1) Where:
P = Loan amount (principal)
Principal & interest:
| $3,432 |
Property TaxesAnnual taxes levied by local governments on real estate properties. These taxes fund public services like schools, roads, and emergency services.
Property tax:
| $169 |
InsuranceThe costs for insurance coverage to protect against financial losses due to risks like fire, natural disasters, theft, liability, or tenant-related damages. Calculation:Assumes 7% of gross rental income, unless insurance rates are specified.
Insurance:
| $161 |
Private Mortgage Insurance (PMI)A fee that borrowers pay when they take out a conventional loan with a loan-to-value (LTV) ratio above 80%.
Private mortgage insurance (PMI):
| $0 |
Monthly PaymentThe fixed amount a borrower pays each month to repay a loan. It typically includes principal and interest (P&I) and may also cover property taxes, insurance, HOA fees, and PMI if escrowed. Monthly payment:
| $3,762 |
Operating Income
| % Rent | Monthly | Yearly | |
|---|---|---|---|
Gross RentThe total rental income received from tenants before deducting any expenses. Includes base rent, late fees, pet fees, parking fees, and other recurring charges.
Gross rent:
| $2,300 | $27,600 | |
Vacancy LossExpected loss of rent due to vacancies.
Vacancy loss:
(6%)
| 6% | -$138 | -$1,656 |
Operating IncomeGross rental income minus vacancy loss. Calculation:Gross rent - Vacancy loss
Operating income:
| $2,162 | $25,944 |
Operating Expenses
| % Rent | Monthly | Yearly | |
|---|---|---|---|
Property TaxesAnnual taxes levied by local governments on real estate properties. These taxes fund public services like schools, roads, and emergency services. | 7% | -$169 | -$2,024 |
InsuranceThe costs for insurance coverage to protect against financial losses due to risks like fire, natural disasters, theft, liability, or tenant-related damages. Calculation:Assumes 7% of gross rental income, unless insurance rates are specified. | 7% | -$161 | -$1,932 |
Property ManagementThe costs associated with hiring a property manager to handle the day-to-day operations of a rental property. Includes management fees, leasing fes, eviction fees, etc. Calculation:Assumes 8% of gross rental income. | 8% | -$184 | -$2,208 |
Repairs & MaintenanceOngoing costs for routine upkeep and minor fixes needed to keep a property in good working condition. Calculation:Assumes 5% of gross rental income. Varies by property age and condition. | 5% | -$115 | -$1,380 |
Capital ExpensesLarge, infrequent costs for major improvements or replacements, like a new roof, HVAC system, or appliances. Calculation:Assumes 5% of gross rental income. Varies by property age. | 5% | -$115 | -$1,380 |
HOA FeesRegular dues paid to a Homeowners Association for community maintenance, amenities, and management. Similar fees include: Condo Association Fees, Co-op Maintenance Fees, etc. | n/a | n/a | n/a |
Operating ExpensesRecurring costs required to maintain and manage a rental property, including property taxes, insurance, maintenance, repairs, utilities (if paid by the owner), property management fees, and other day-to-day expenses. Calculation:Insurance + Property Taxes + Property Management + Repairs & Maintenance + Capital Expenditures + HOA Fees | 32% | -$744 | -$8,924 |
Cash Flow
| Monthly | Yearly | |
|---|---|---|
Net Operating Income (NOI)The income generated from a property after deducting all operating expenses but before deducting mortgage payments, taxes, and capital expenditures. Calculation:Gross Operating Income - Operating Expenses
Net operating income:
| $1,418 | $17,016 |
Mortgage PaymentThe fixed amount a borrower pays each month to repay a loan. It typically includes principal and interest (P&I) and may also cover property taxes, insurance, HOA fees, and PMI if escrowed. | -$3,432 | -$41,184 |
Cash FlowNet Operating Income (NOI) minus mortgage payments. Calculation:NOI - Mortgage Payments | $2,014 | $24,168 |