$358,900
Investment Summary
- Monthly Cash Flow
- -$627
- Cap Rate
- 4.0%
- Cash-on-Cash Return
- -9.1%
- Debt Coverage Ratio
- 0.66
- Internal Rate of Return (5 years)
- -4.8%
Cash Flow
Net Operating Income (NOI) minus mortgage payments.
Calculation:
NOI - Mortgage Payments
Cap Rate (Market Value)
Capitalization Rate is a rate of return that compares the yearly Net Operating Income (NOI) to the market value.
Calculation:
NOI / Market Value
Cash-on-Cash Return (CoC)
Annual Cash Flow / Cash Invested
Calculation:
Annual cash flow divided by initial cash invested.
Debt Coverage Ratio (DCR)
Net Operating Income (NOI) divided by total debt payments.
Calculation:
NOI / Total Debt Payments
Internal Rate of Return (IRR)
A metric for assessing profitability over time. IRR is the discount rate at which the net present value (NPV) of all future cash flows (positive and negative) from an investment equals zero — including both periodic cash flow (such as rent) and a projected sale at the end of the holding period. It represents the expected annualized return, accounting for income, expenses, and the recovery of capital through a future sale.
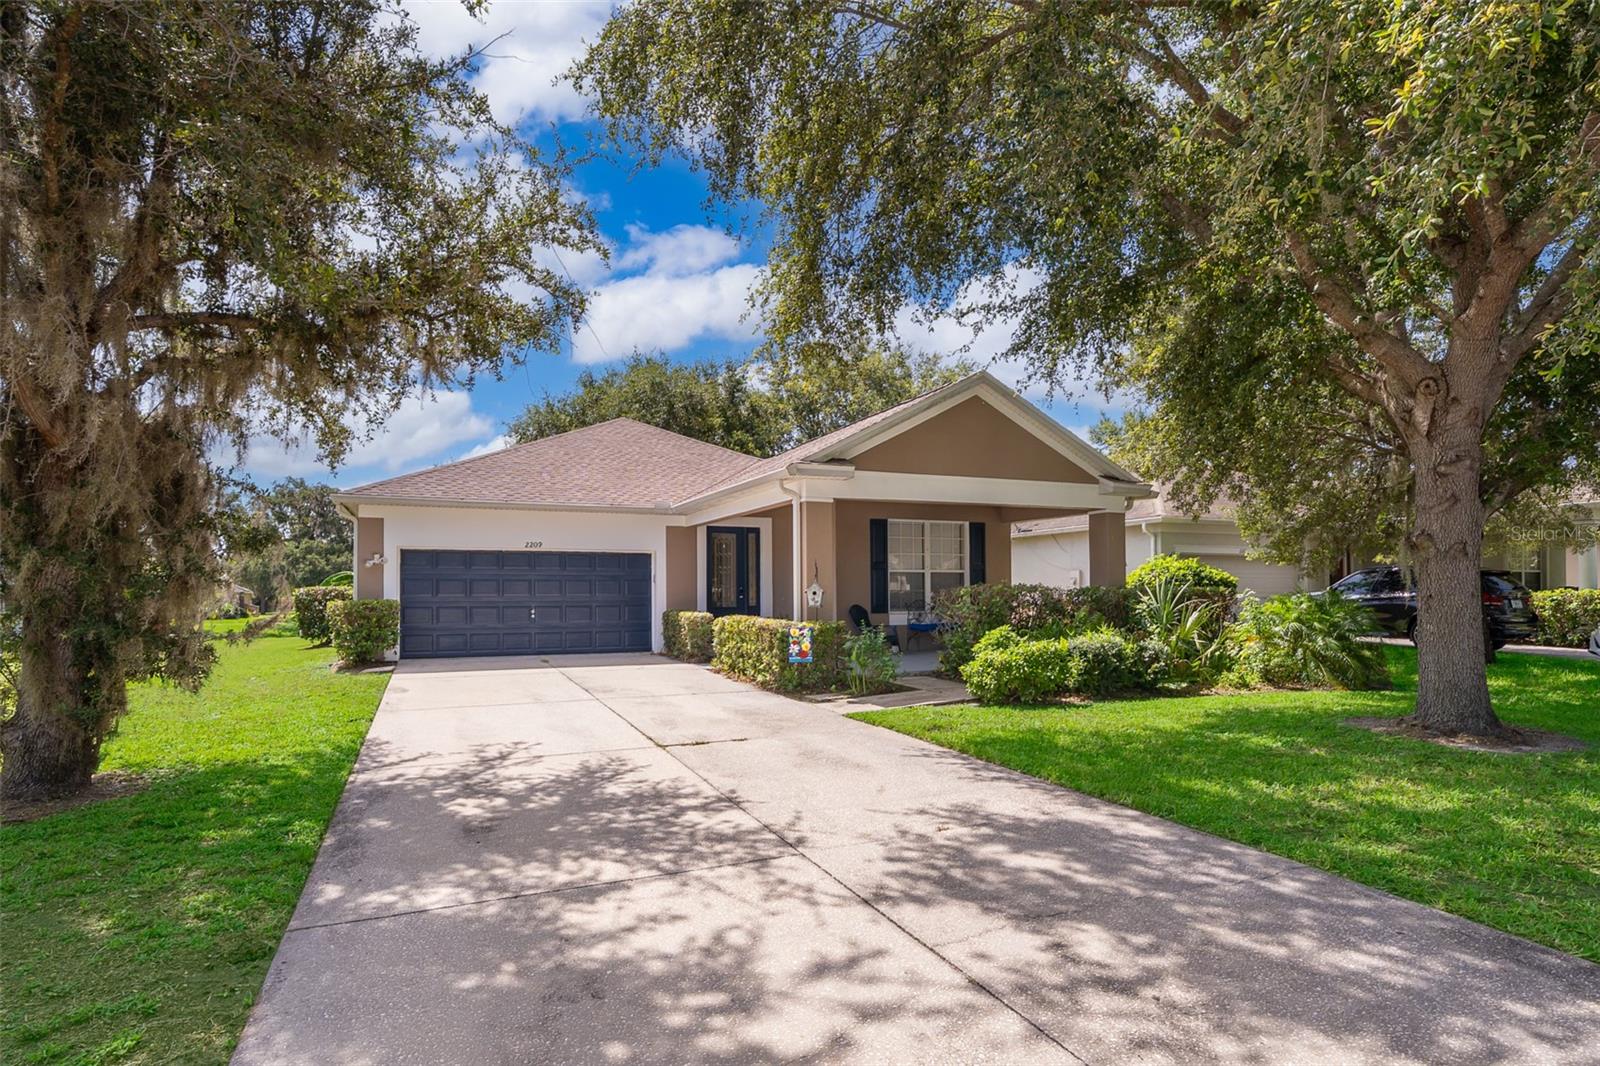
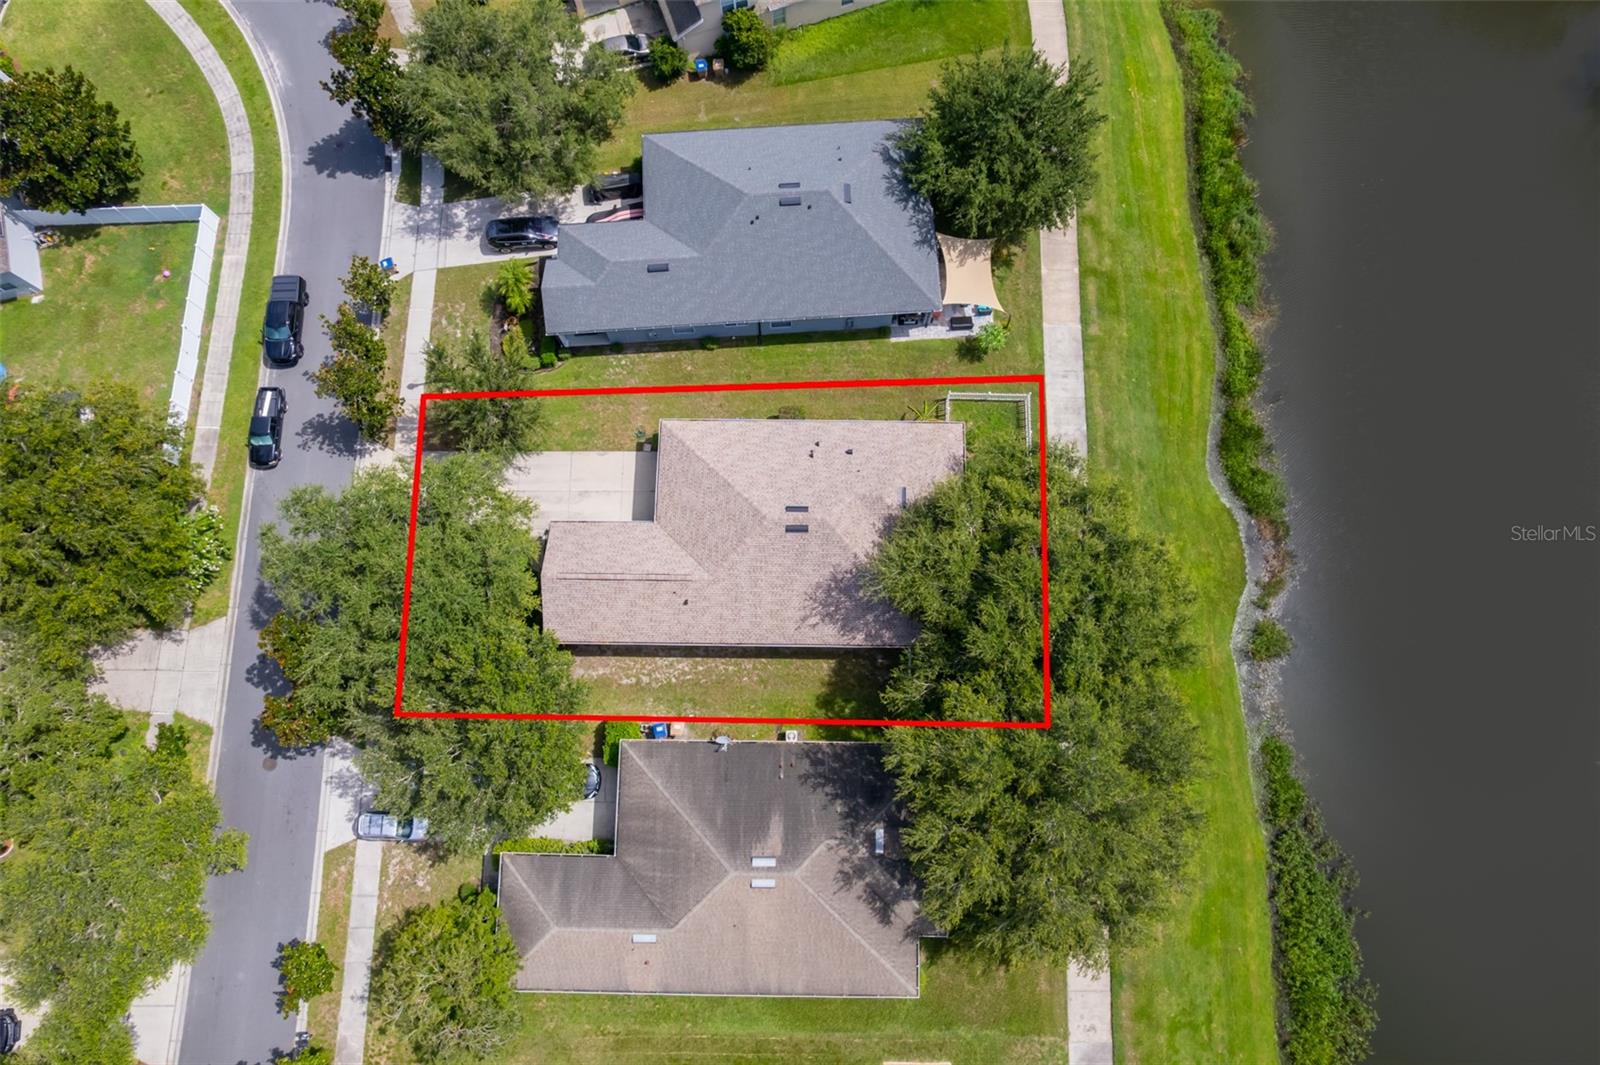
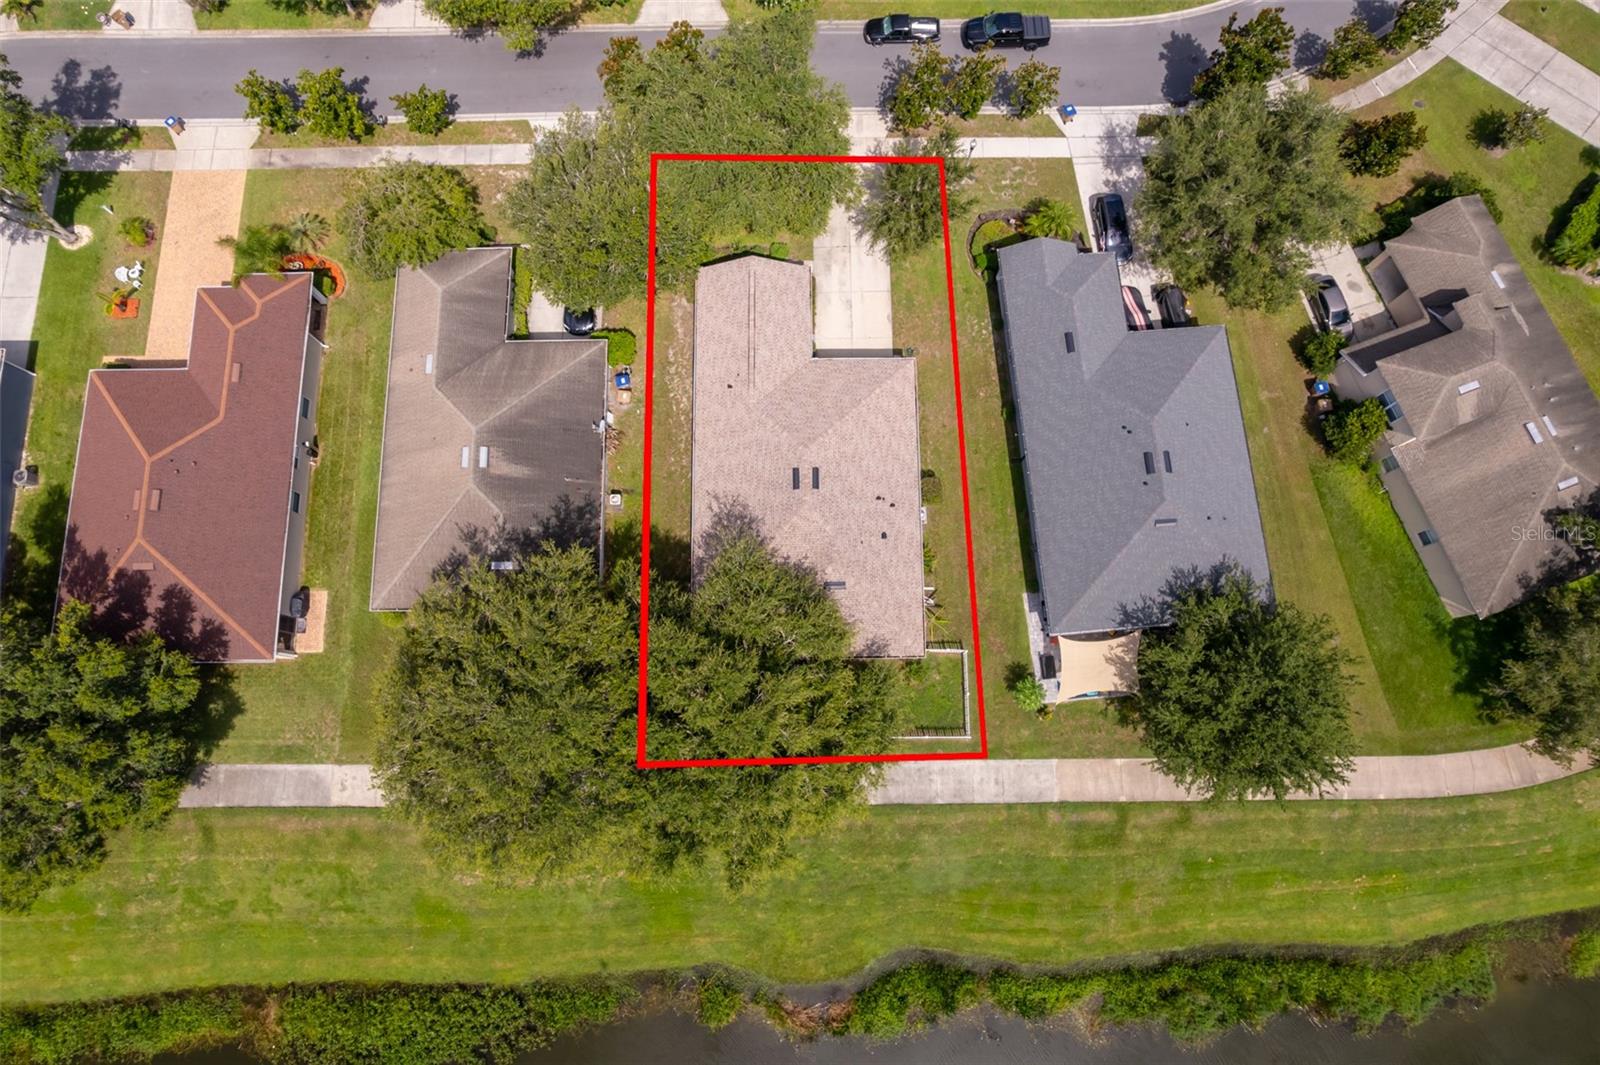
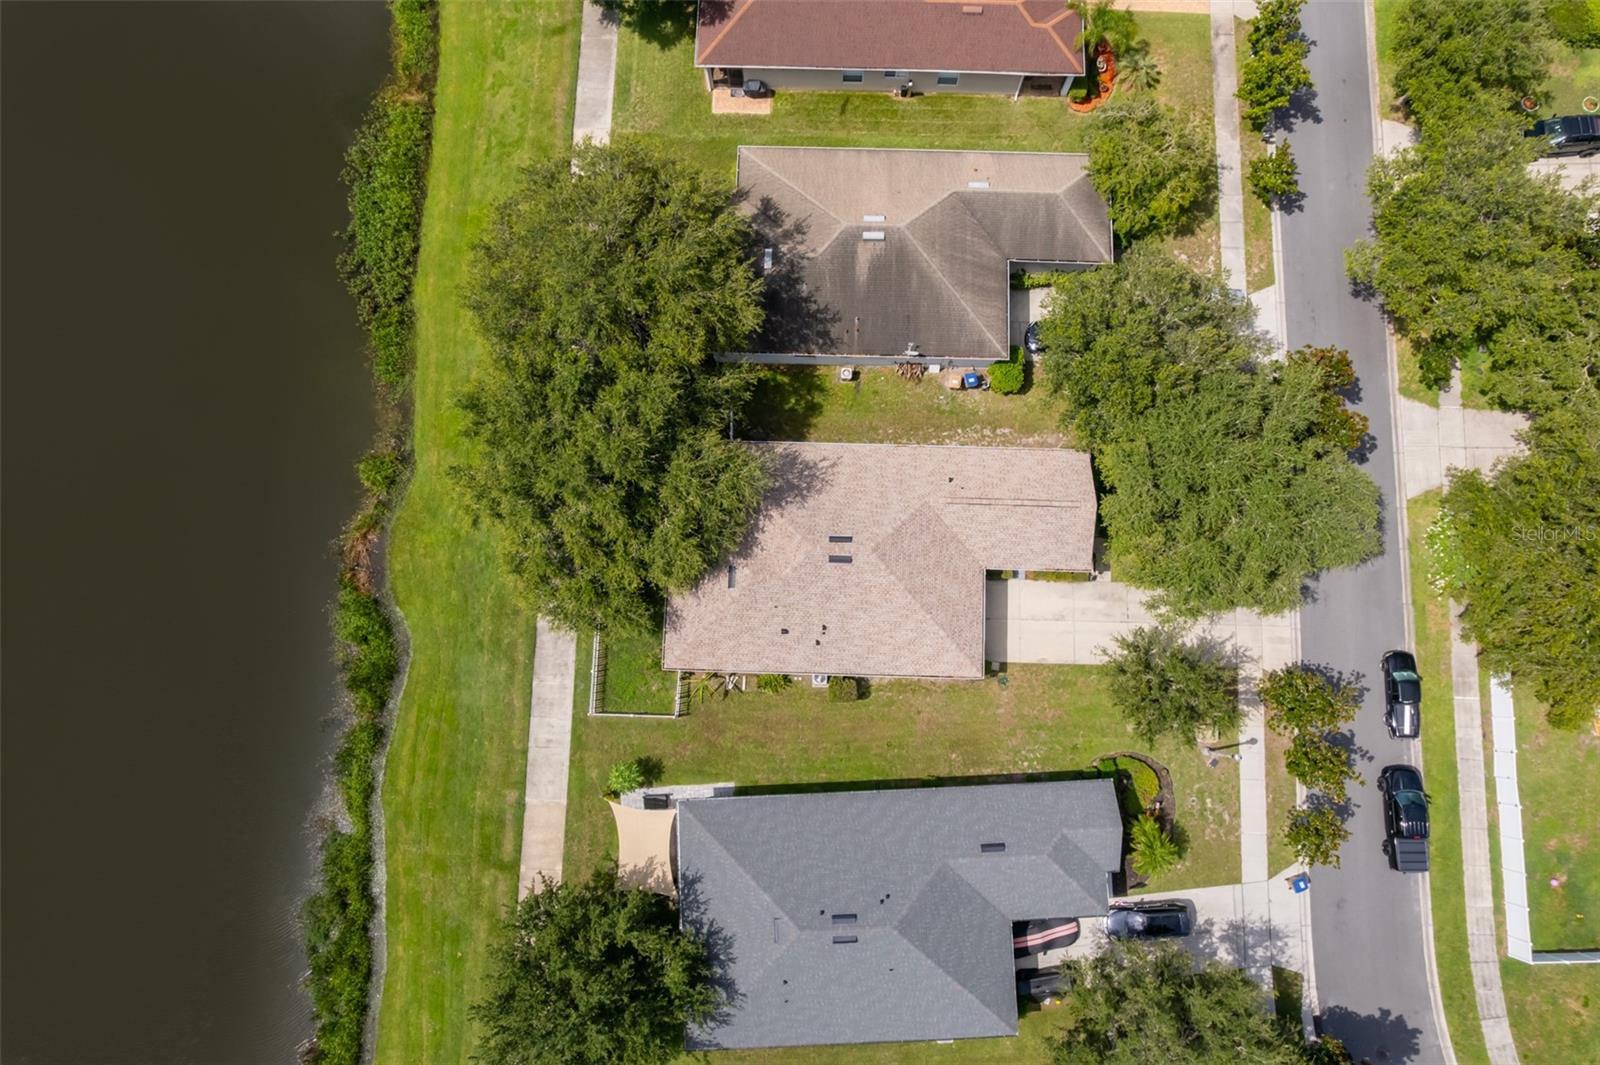
Property Description
Under contract-accepting backup offers. Nestled in the peaceful, well-established community of Oak Hammock Preserve in Kissimmee, this beautifully maintained 3-bedroom, 2-bathroom home offers just the right blend of comfort, function, and Florida charm. Thoughtfully updated and move-in ready, this single-story property features over 1,700 square feet of open living space, a split-bedroom floor plan, and tranquil water views—creating the perfect backdrop for both everyday living and weekend entertaining. Step inside to find a bright, welcoming layout with tile flooring throughout, vaulted ceilings, and no popcorn ceilings for a clean, modern finish. The expansive great room features triple sliders that open to a screened-in lanai, seamlessly connecting indoor and outdoor living. The formal living and dining areas offer flexible space for gatherings or quiet evenings at home, while a spacious eat-in kitchen features 42-inch cabinets, upgraded appliances—including a new stove and dishwasher (2025), refrigerator (2024), and microwave (2022)—plus a breakfast nook perfect for morning coffee with a view. The oversized primary suite is a true retreat, complete with a large walk-in closet, dual sink vanities, a relaxing garden tub, and a separate walk-in shower. Two additional bedrooms are tucked away on the opposite side of the home, offering privacy and convenience for guests, family, or a home office setup. One of the bedrooms is adjacent to a full bath, ideal for multi-generational living or long-term visitors. Step outside to enjoy a covered front porch and a screened-in back lanai that overlooks the serene pond—surrounded by a walking trail, perfect for evening strolls or early morning runs. The fenced-in backyard (with a charming white picket fence installed in 2021) and irrigation system make maintenance a breeze, while the long driveway comfortably parks up to four cars—great for guests or multi-car households. This home has been thoughtfully updated in recent years with a new HVAC system (Sept. 2024), hot water heater (2024), and fresh exterior paint (2025). A new roof (2023) enhances both function and value. Inside, you’ll also find updated flooring throughout, a smart thermostat, upgraded light fixtures, and custom window treatments that add comfort and style. Gutters have also been installed to improve drainage and boost curb appeal—rounding out this home’s many practical and aesthetic enhancements. Residents of Oak Hammock Preserve enjoy access to a community pool, clubhouse, picnic area, and playground—all with low HOA dues and no CDD fees. The location offers easy access to shopping, dining, supermarkets, medical centers, golf courses, schools, and major roadways, including the SunRail station and area attractions. Whether you’re seeking peaceful water views, modern upgrades, or a friendly neighborhood with great amenities, this Kissimmee gem truly has it all. Schedule your private showing today and discover the perfect blend of style, comfort, and convenience in Oak Hammock Preserve.
Build Your Team
Quickly find investor-friendly professionals who can help you succeed in real estate investing at any stage of the investing journey.


Agents
Match with investor-friendly agents who can help you find, analyze, and close your next deal


Lenders
Get the best funding…find investor-friendly lenders who specialize in your deal strategy


Property Managers
Transition to passive investing. Find a trusted property management partnership that lasts.


Tax Pros & Accountants
Taxes and financial reporting made easy—find experts to create tax savings strategies, file taxes, and more
Location
Property Details
Parking
- Description: Garage
- Details: Driveway, Garage Door Opener, Attached
- Garage Spaces: 2
- Spaces Total: 0
Bedroom Information
- # of Bedrooms: 3
Bathroom Information
- # of Baths (Full): 2
- # of Baths (Total): 2.0
Interior Features
- # of Rooms: 6
- # of Stories: 1
Exterior Features
- Exterior Walls Materials: Concrete Block
- Foundation: Slab
- Roof Type: Gable or Hip
- Roof Material: Shingle
- Pool Community: Yes
HOA
- Has HOA: Yes
- Association: Artemis Lifestyle Services
- HOA Fee: $150/quarterly
Land Information
- Land Use: Residential
- Land Use Subtype: Single Family Residential
Lot Information
- Parcel ID: 052629444100010550
- Lot Size: 7187 sqft
Property Information
- Property Type: Single Family Residence
- Style: Florida, Traditional
- Year Built: 2004
Tax Information
- Annual Tax: $3,915
Utilities
- Water & Sewer: Public
- Heating: Central
- Cooling: Central Air
Location
- County: Osceola
Listing Details
Investment Summary
- Monthly Cash Flow
- -$627
- Cap Rate
- 4.0%
- Cash-on-Cash Return
- -9.1%
- Debt Coverage Ratio
- 0.66
- Internal Rate of Return (5 years)
- -4.8%
Cash Flow
Net Operating Income (NOI) minus mortgage payments.
Calculation:
NOI - Mortgage Payments
Cap Rate (Market Value)
Capitalization Rate is a rate of return that compares the yearly Net Operating Income (NOI) to the market value.
Calculation:
NOI / Market Value
Cash-on-Cash Return (CoC)
Annual Cash Flow / Cash Invested
Calculation:
Annual cash flow divided by initial cash invested.
Debt Coverage Ratio (DCR)
Net Operating Income (NOI) divided by total debt payments.
Calculation:
NOI / Total Debt Payments
Internal Rate of Return (IRR)
A metric for assessing profitability over time. IRR is the discount rate at which the net present value (NPV) of all future cash flows (positive and negative) from an investment equals zero — including both periodic cash flow (such as rent) and a projected sale at the end of the holding period. It represents the expected annualized return, accounting for income, expenses, and the recovery of capital through a future sale.
Purchase Details
Purchase PriceThe price paid for the property. Purchase price:
| $358,900 |
|---|---|
Amount FinancedThe amount of the purchase financed through a loan. Amount financed:
| -$287,120 |
Down paymentThe initial payment made towards the purchase. Down payment:
| $71,780 |
Closing CostsFees and expenses associated with purchasing a property, typically ranging from 2% to 5% of the home’s purchase price, paid at the end of a home purchase to cover services like lending, title transfer, and taxes. Closing costs:
| $10,767 |
Rehab CostsCosts incurred to repair or improve the property, including: roof, flooring, exterior siding, kitchen, exterior paint, bathrooms, etc. Rehab costs:
| $0 |
Initial Cash InvestedThe total initial cash invested in the property. Calculation:Down payment + Buying costs + Rehab costs Initial cash invested:
| $82,547 |
Square Feet (SQFT)The total square footage of the property. Square feet:
| 1,680 |
Cost Per Square FootCost per square foot of the property. Calculation:Purchase Price / Square Feet Cost per square foot:
| $214 |
Monthly Rent Per Square FootMonthly rent divided by the number of square feet. This ratio helps investors compare rental income efficiency across properties, markets, and unit sizes Calculation:Monthly Rent / Square Feet Monthly rent per square foot:
| $1.37 |
Financing Details
Loan AmountThe total sum of money borrowed from a lender to finance a property purchase. Calculation:Purchase Price - Down Payment
Loan amount:
| $287,120 |
|---|---|
Loan to Value Ratio (LTV)Loan amount divided by the market value of the property. Calculation:Loan Amount / Market Value
Loan to value ratio:
| 80.0% |
Loan TypeThe type of loan (e.g., fixed, adjustable).
Loan type:
| Amortizing |
TermThe loan repayment period in years.
Term:
| 30 years |
Interest RateThe percentage a lender charges on the borrowed amount of a loan, determining the cost of borrowing money.
Interest rate:
| 6.625% |
Principal & Interest (PI)The principal is the portion of the loan payment that reduces the loan balance. The interest is the lender's charge for borrowing money. Calculation:(P * r * (1 + r) ** n) / ((1 + r) ** n - 1) Where:
P = Loan amount (principal)
Principal & interest:
| $1,838 |
Property TaxesAnnual taxes levied by local governments on real estate properties. These taxes fund public services like schools, roads, and emergency services.
Property tax:
| $326 |
InsuranceThe costs for insurance coverage to protect against financial losses due to risks like fire, natural disasters, theft, liability, or tenant-related damages. Calculation:Assumes 7% of gross rental income, unless insurance rates are specified.
Insurance:
| $161 |
Private Mortgage Insurance (PMI)A fee that borrowers pay when they take out a conventional loan with a loan-to-value (LTV) ratio above 80%.
Private mortgage insurance (PMI):
| $0 |
Monthly PaymentThe fixed amount a borrower pays each month to repay a loan. It typically includes principal and interest (P&I) and may also cover property taxes, insurance, HOA fees, and PMI if escrowed. Monthly payment:
| $2,325 |
Operating Income
| % Rent | Monthly | Yearly | |
|---|---|---|---|
Gross RentThe total rental income received from tenants before deducting any expenses. Includes base rent, late fees, pet fees, parking fees, and other recurring charges.
Gross rent:
| $2,300 | $27,600 | |
Vacancy LossExpected loss of rent due to vacancies.
Vacancy loss:
(6%)
| 6% | -$138 | -$1,656 |
Operating IncomeGross rental income minus vacancy loss. Calculation:Gross rent - Vacancy loss
Operating income:
| $2,162 | $25,944 |
Operating Expenses
| % Rent | Monthly | Yearly | |
|---|---|---|---|
Property TaxesAnnual taxes levied by local governments on real estate properties. These taxes fund public services like schools, roads, and emergency services. | 14% | -$326 | -$3,915 |
InsuranceThe costs for insurance coverage to protect against financial losses due to risks like fire, natural disasters, theft, liability, or tenant-related damages. Calculation:Assumes 7% of gross rental income, unless insurance rates are specified. | 7% | -$161 | -$1,932 |
Property ManagementThe costs associated with hiring a property manager to handle the day-to-day operations of a rental property. Includes management fees, leasing fes, eviction fees, etc. Calculation:Assumes 8% of gross rental income. | 8% | -$184 | -$2,208 |
Repairs & MaintenanceOngoing costs for routine upkeep and minor fixes needed to keep a property in good working condition. Calculation:Assumes 5% of gross rental income. Varies by property age and condition. | 5% | -$115 | -$1,380 |
Capital ExpensesLarge, infrequent costs for major improvements or replacements, like a new roof, HVAC system, or appliances. Calculation:Assumes 5% of gross rental income. Varies by property age. | 5% | -$115 | -$1,380 |
HOA FeesRegular dues paid to a Homeowners Association for community maintenance, amenities, and management. Similar fees include: Condo Association Fees, Co-op Maintenance Fees, etc. | 2% | -$50 | -$600 |
Operating ExpensesRecurring costs required to maintain and manage a rental property, including property taxes, insurance, maintenance, repairs, utilities (if paid by the owner), property management fees, and other day-to-day expenses. Calculation:Insurance + Property Taxes + Property Management + Repairs & Maintenance + Capital Expenditures + HOA Fees | 41% | -$951 | -$11,415 |
Cash Flow
| Monthly | Yearly | |
|---|---|---|
Net Operating Income (NOI)The income generated from a property after deducting all operating expenses but before deducting mortgage payments, taxes, and capital expenditures. Calculation:Gross Operating Income - Operating Expenses
Net operating income:
| $1,211 | $14,532 |
Mortgage PaymentThe fixed amount a borrower pays each month to repay a loan. It typically includes principal and interest (P&I) and may also cover property taxes, insurance, HOA fees, and PMI if escrowed. | -$1,838 | -$22,056 |
Cash FlowNet Operating Income (NOI) minus mortgage payments. Calculation:NOI - Mortgage Payments | -$627 | -$7,524 |