$333,000
Investment Summary
- Monthly Cash Flow
- -$593
- Cap Rate
- 4.0%
- Cash-on-Cash Return
- -9.3%
- Debt Coverage Ratio
- 0.65
- Internal Rate of Return (5 years)
- -5.0%
Cash Flow
Net Operating Income (NOI) minus mortgage payments.
Calculation:
NOI - Mortgage Payments
Cap Rate (Market Value)
Capitalization Rate is a rate of return that compares the yearly Net Operating Income (NOI) to the market value.
Calculation:
NOI / Market Value
Cash-on-Cash Return (CoC)
Annual Cash Flow / Cash Invested
Calculation:
Annual cash flow divided by initial cash invested.
Debt Coverage Ratio (DCR)
Net Operating Income (NOI) divided by total debt payments.
Calculation:
NOI / Total Debt Payments
Internal Rate of Return (IRR)
A metric for assessing profitability over time. IRR is the discount rate at which the net present value (NPV) of all future cash flows (positive and negative) from an investment equals zero — including both periodic cash flow (such as rent) and a projected sale at the end of the holding period. It represents the expected annualized return, accounting for income, expenses, and the recovery of capital through a future sale.
Property Description
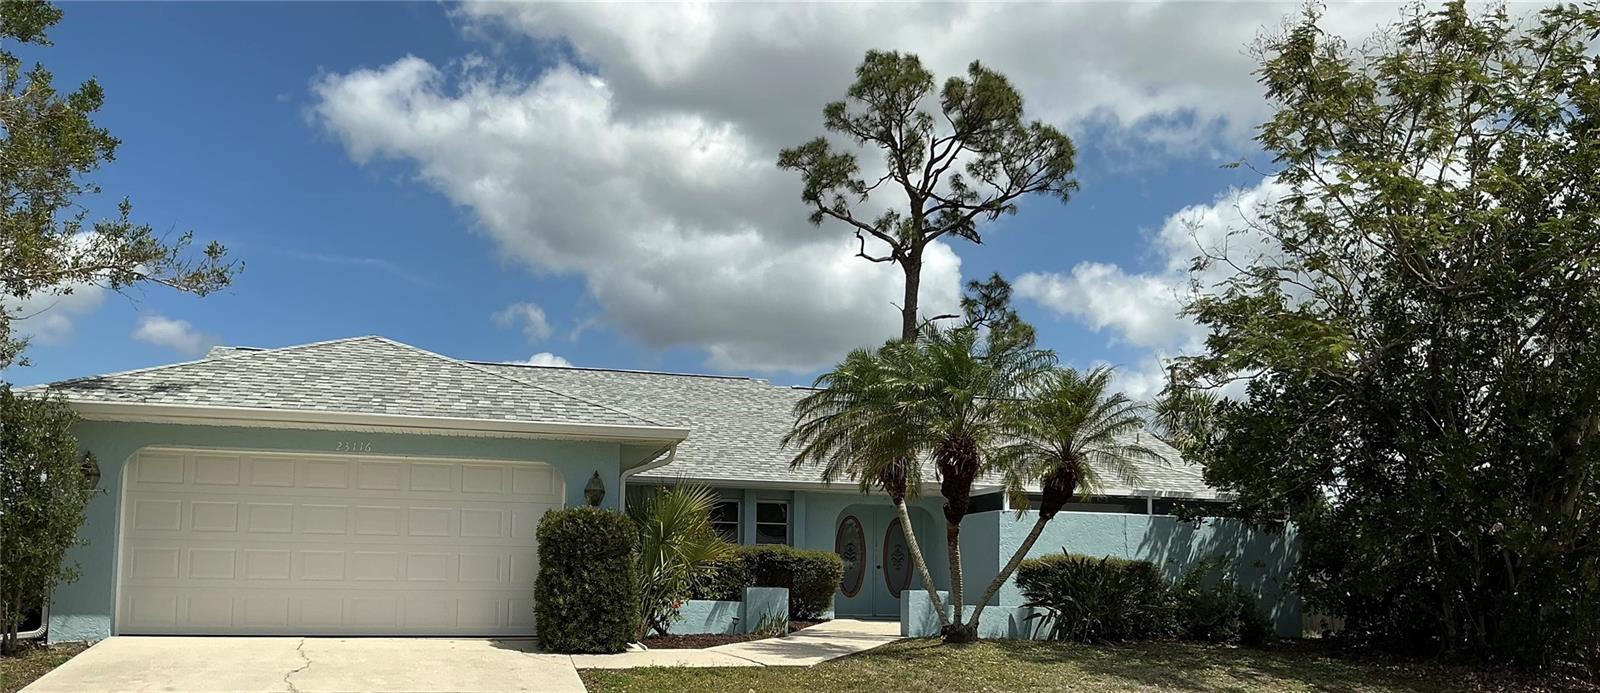
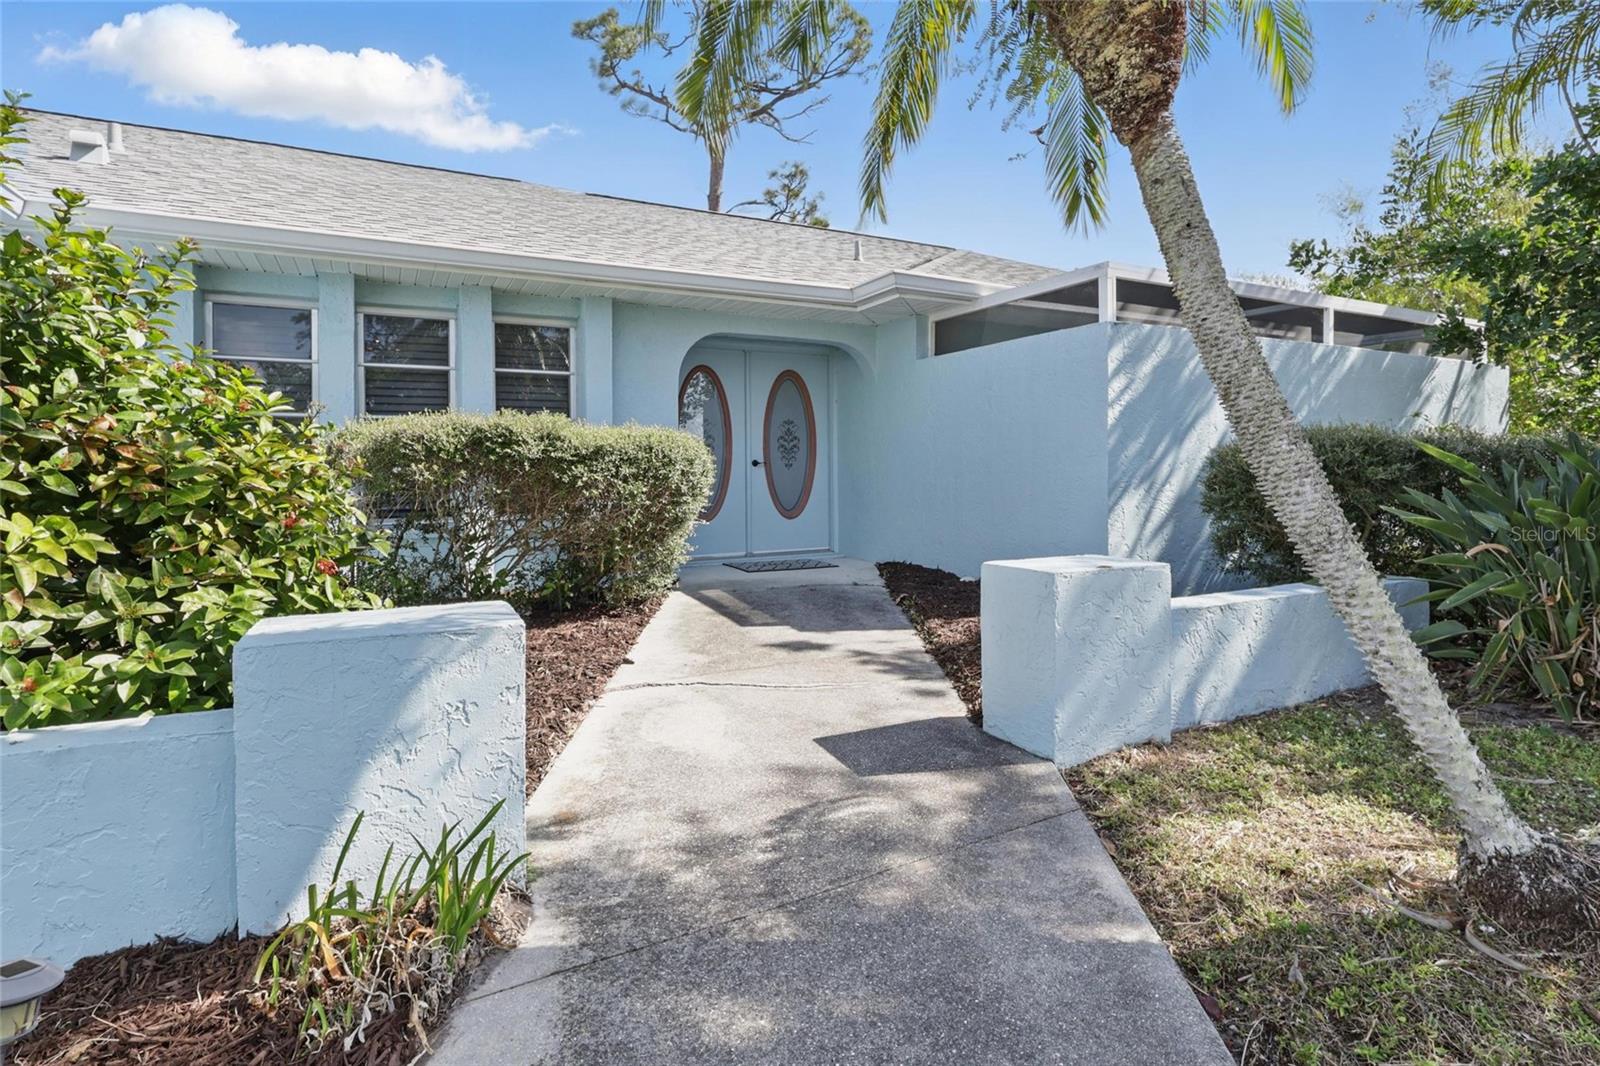
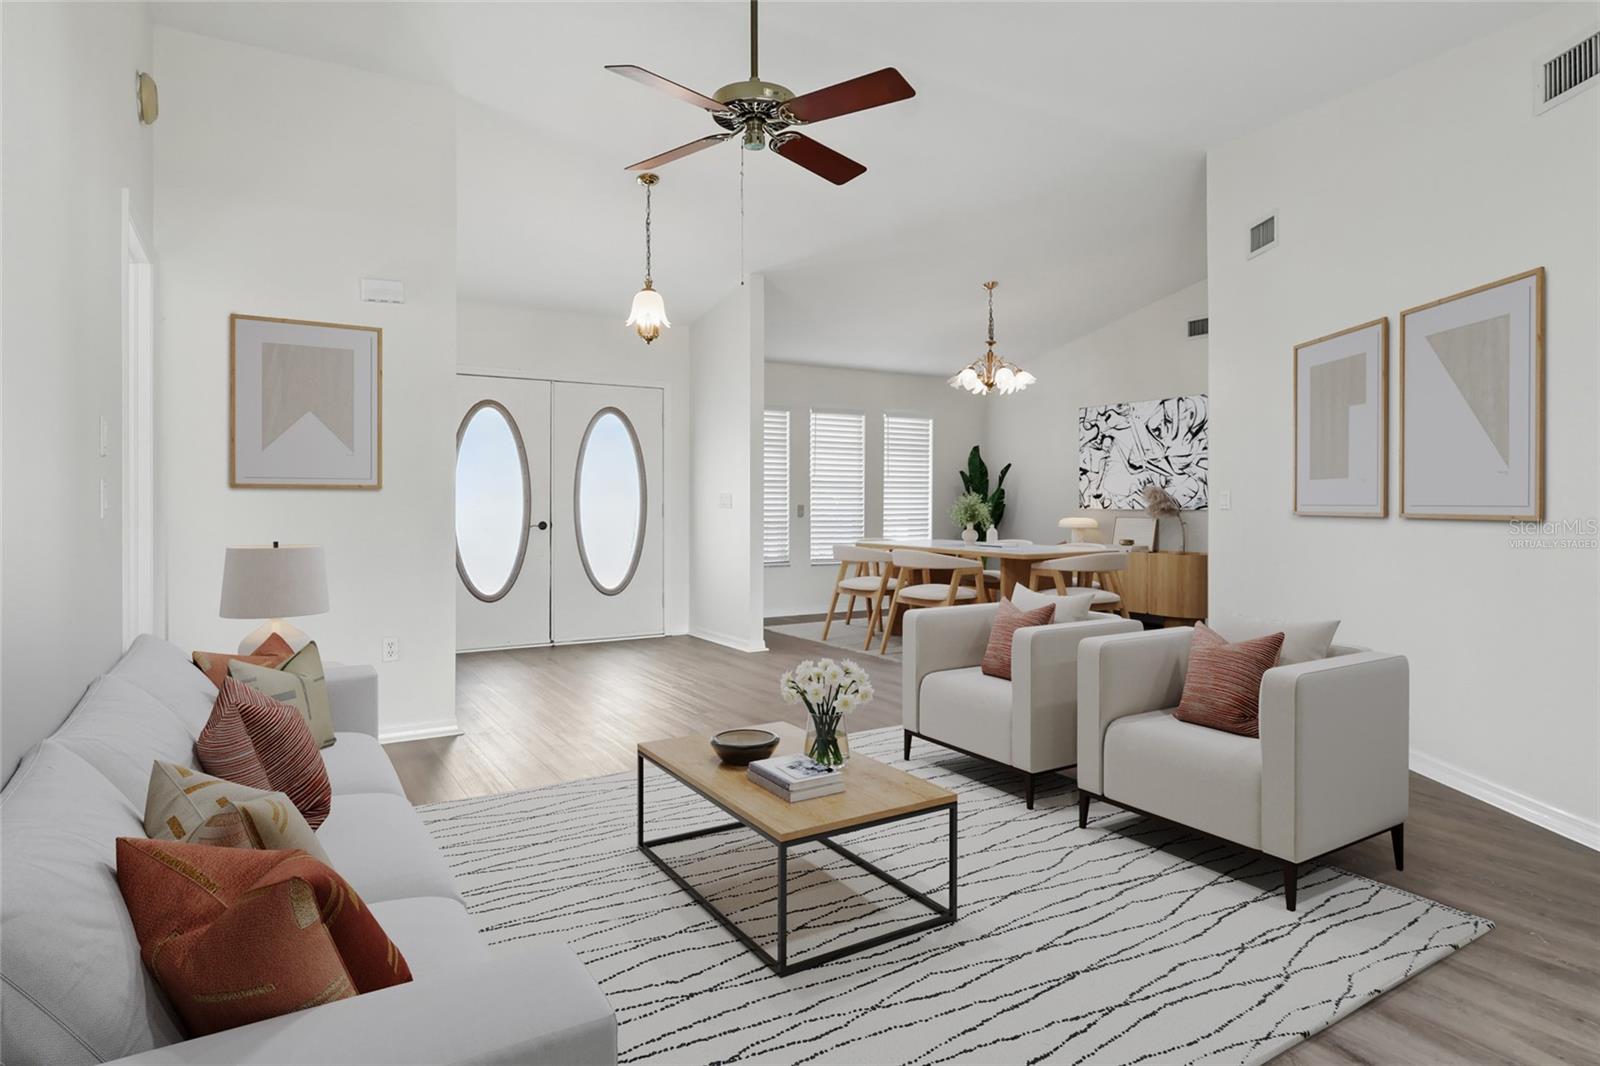
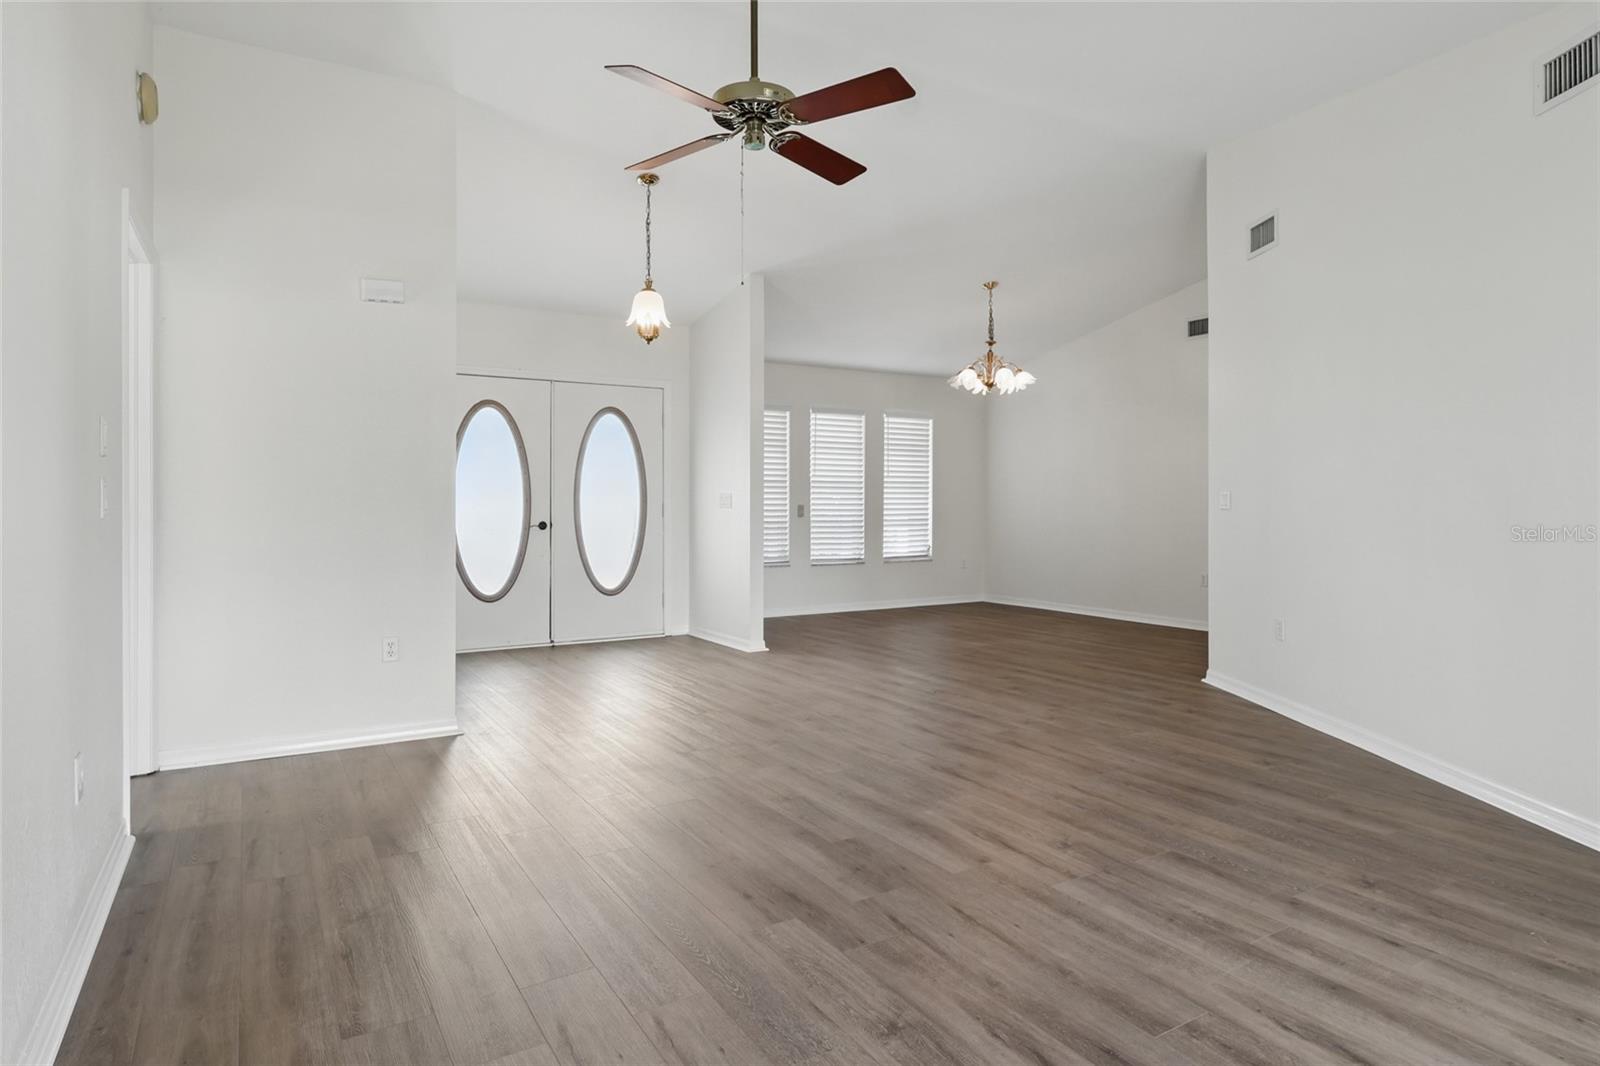
Large Corner-Lot : Move-In Ready 3 BR/2B. MOTIVATED SELLER! Located on a large corner lot within a peaceful, sidewalk-lined neighborhood, this home represents the perfect blend of contemporary style and classic comfort. Recently renovated and well maintained, every detail has been curated for you and your loved ones an idyllic sanctuary for everyday living and unforgettable gatherings. From the moment you arrive, the home’s curb appeal is evident. Mature landscaping with well-established trees and shrubs frames the property, providing both privacy and a lush, tranquil setting. The quiet neighborhood, complete with underground utilities and walkable sidewalks, is ideal for morning jogs, evening strolls, or bike rides with friends. Driveway is on low traffic road and a sense of community, peace of mind comes standard. Step inside and be welcomed by vaulted ceilings and strategically placed skylights that bathe the main living area and bathroom in natural light. The large bonus room flows effortlessly from the kitchen, providing ample space for both intimate gatherings and lively celebrations. Large windows bring the outdoors in, while low-maintenance flooring offers comfort underfoot. Whether you’re hosting game nights or enjoying a quiet evening, this room is versatile enough to accommodate your lifestyle. The recently renovated kitchen boasts brand-new cabinets offering storage, sleek countertops, and a double stainless steel sink. The center island stands as a natural focal point with eat-in dining area. Slide open the doors from the main living area to reveal your expansive screened lanai for coffee or sunset with friends. The primary suite has a dedicated screened patio, pre-wired and ready for your new hot tub. Imagine unwinding in a bubbling soak after a long day, surrounded by the chirping of birds and the gentle breeze rustling through mature landscaping. The primary bedroom offers a spacious walk-in shower and a deep soaking tub inviting you to linger at the start or end of each day. The overall layout ensures privacy from secondary bedrooms and guest spaces. • New roof installed in 2023, • Hurricane-rated double garage door. • Pull-down attic stairs • New digital thermostat. • AC system recently serviced. • Seller will pay for the new sewer hookup with Charlotte County Utilities. • Room for your RV, boat, or pool • Mature landscaping not only beautifies the property but enhances privacy and reduced noise Underground utilities minimize outages and keep the neighborhood looking tidy. Whether you’re seeking a lively hub for entertaining or a quiet retreat for solitude, this home has it all. This seller is offering SELLER FINANCING! The Seller will act as the bank for this transaction for a term of up to 5 years at a very competitive interest rate. Ask for more details if you need creative financing! This home brings together style, function, and location. Don’t miss your chance to move into a property where every detail has been considered, and all that’s missing is you. Schedule a private showing today and discover the difference that thoughtful design, modern upgrades, and a welcoming neighborhood can make in your life.
Build Your Team
Quickly find investor-friendly professionals who can help you succeed in real estate investing at any stage of the investing journey.


Agents
Match with investor-friendly agents who can help you find, analyze, and close your next deal


Lenders
Get the best funding…find investor-friendly lenders who specialize in your deal strategy


Property Managers
Transition to passive investing. Find a trusted property management partnership that lasts.


Tax Pros & Accountants
Taxes and financial reporting made easy—find experts to create tax savings strategies, file taxes, and more
Location
Property Details
Parking
- Description: Driveway, Garage Door Opener
- Details: Attached
- Garage Spaces: 2
- Spaces Total: 0
Bedroom Information
- # of Bedrooms: 3
Bathroom Information
- # of Baths (Full): 2
- # of Baths (Total): 2.0
Interior Features
- # of Rooms: 8
- # of Stories: 1
Exterior Features
- Exterior Walls Materials: Stucco
- Foundation: Slab
- Roof Material: Shingle
Land Information
- Land Use: Residential
- Land Use Subtype: Single Family Residential
Lot Information
- Parcel ID: 402212358016
- Lot Size: 12631 sqft
Property Information
- Property Type: Single Family Residence
- Style: Florida
- Year Built: 1987
Tax Information
- Annual Tax: $4,862
Utilities
- Water & Sewer: Public
- Heating: Central, Electric, Heat Pump
- Cooling: Central Air
Location
- County: Charlotte
Listing Details
Investment Summary
- Monthly Cash Flow
- -$593
- Cap Rate
- 4.0%
- Cash-on-Cash Return
- -9.3%
- Debt Coverage Ratio
- 0.65
- Internal Rate of Return (5 years)
- -5.0%
Cash Flow
Net Operating Income (NOI) minus mortgage payments.
Calculation:
NOI - Mortgage Payments
Cap Rate (Market Value)
Capitalization Rate is a rate of return that compares the yearly Net Operating Income (NOI) to the market value.
Calculation:
NOI / Market Value
Cash-on-Cash Return (CoC)
Annual Cash Flow / Cash Invested
Calculation:
Annual cash flow divided by initial cash invested.
Debt Coverage Ratio (DCR)
Net Operating Income (NOI) divided by total debt payments.
Calculation:
NOI / Total Debt Payments
Internal Rate of Return (IRR)
A metric for assessing profitability over time. IRR is the discount rate at which the net present value (NPV) of all future cash flows (positive and negative) from an investment equals zero — including both periodic cash flow (such as rent) and a projected sale at the end of the holding period. It represents the expected annualized return, accounting for income, expenses, and the recovery of capital through a future sale.
Purchase Details
Purchase PriceThe price paid for the property. Purchase price:
| $333,000 |
|---|---|
Amount FinancedThe amount of the purchase financed through a loan. Amount financed:
| -$266,400 |
Down paymentThe initial payment made towards the purchase. Down payment:
| $66,600 |
Closing CostsFees and expenses associated with purchasing a property, typically ranging from 2% to 5% of the home’s purchase price, paid at the end of a home purchase to cover services like lending, title transfer, and taxes. Closing costs:
| $9,990 |
Rehab CostsCosts incurred to repair or improve the property, including: roof, flooring, exterior siding, kitchen, exterior paint, bathrooms, etc. Rehab costs:
| $0 |
Initial Cash InvestedThe total initial cash invested in the property. Calculation:Down payment + Buying costs + Rehab costs Initial cash invested:
| $76,590 |
Square Feet (SQFT)The total square footage of the property. Square feet:
| 2,062 |
Cost Per Square FootCost per square foot of the property. Calculation:Purchase Price / Square Feet Cost per square foot:
| $161 |
Monthly Rent Per Square FootMonthly rent divided by the number of square feet. This ratio helps investors compare rental income efficiency across properties, markets, and unit sizes Calculation:Monthly Rent / Square Feet Monthly rent per square foot:
| $1.07 |
Financing Details
Loan AmountThe total sum of money borrowed from a lender to finance a property purchase. Calculation:Purchase Price - Down Payment
Loan amount:
| $266,400 |
|---|---|
Loan to Value Ratio (LTV)Loan amount divided by the market value of the property. Calculation:Loan Amount / Market Value
Loan to value ratio:
| 80.0% |
Loan TypeThe type of loan (e.g., fixed, adjustable).
Loan type:
| Amortizing |
TermThe loan repayment period in years.
Term:
| 30 years |
Interest RateThe percentage a lender charges on the borrowed amount of a loan, determining the cost of borrowing money.
Interest rate:
| 6.625% |
Principal & Interest (PI)The principal is the portion of the loan payment that reduces the loan balance. The interest is the lender's charge for borrowing money. Calculation:(P * r * (1 + r) ** n) / ((1 + r) ** n - 1) Where:
P = Loan amount (principal)
Principal & interest:
| $1,706 |
Property TaxesAnnual taxes levied by local governments on real estate properties. These taxes fund public services like schools, roads, and emergency services.
Property tax:
| $405 |
InsuranceThe costs for insurance coverage to protect against financial losses due to risks like fire, natural disasters, theft, liability, or tenant-related damages. Calculation:Assumes 7% of gross rental income, unless insurance rates are specified.
Insurance:
| $154 |
Private Mortgage Insurance (PMI)A fee that borrowers pay when they take out a conventional loan with a loan-to-value (LTV) ratio above 80%.
Private mortgage insurance (PMI):
| $0 |
Monthly PaymentThe fixed amount a borrower pays each month to repay a loan. It typically includes principal and interest (P&I) and may also cover property taxes, insurance, HOA fees, and PMI if escrowed. Monthly payment:
| $2,265 |
Operating Income
| % Rent | Monthly | Yearly | |
|---|---|---|---|
Gross RentThe total rental income received from tenants before deducting any expenses. Includes base rent, late fees, pet fees, parking fees, and other recurring charges.
Gross rent:
| $2,200 | $26,400 | |
Vacancy LossExpected loss of rent due to vacancies.
Vacancy loss:
(6%)
| 6% | -$132 | -$1,584 |
Operating IncomeGross rental income minus vacancy loss. Calculation:Gross rent - Vacancy loss
Operating income:
| $2,068 | $24,816 |
Operating Expenses
| % Rent | Monthly | Yearly | |
|---|---|---|---|
Property TaxesAnnual taxes levied by local governments on real estate properties. These taxes fund public services like schools, roads, and emergency services. | 18% | -$405 | -$4,863 |
InsuranceThe costs for insurance coverage to protect against financial losses due to risks like fire, natural disasters, theft, liability, or tenant-related damages. Calculation:Assumes 7% of gross rental income, unless insurance rates are specified. | 7% | -$154 | -$1,848 |
Property ManagementThe costs associated with hiring a property manager to handle the day-to-day operations of a rental property. Includes management fees, leasing fes, eviction fees, etc. Calculation:Assumes 8% of gross rental income. | 8% | -$176 | -$2,112 |
Repairs & MaintenanceOngoing costs for routine upkeep and minor fixes needed to keep a property in good working condition. Calculation:Assumes 5% of gross rental income. Varies by property age and condition. | 5% | -$110 | -$1,320 |
Capital ExpensesLarge, infrequent costs for major improvements or replacements, like a new roof, HVAC system, or appliances. Calculation:Assumes 5% of gross rental income. Varies by property age. | 5% | -$110 | -$1,320 |
HOA FeesRegular dues paid to a Homeowners Association for community maintenance, amenities, and management. Similar fees include: Condo Association Fees, Co-op Maintenance Fees, etc. | n/a | n/a | n/a |
Operating ExpensesRecurring costs required to maintain and manage a rental property, including property taxes, insurance, maintenance, repairs, utilities (if paid by the owner), property management fees, and other day-to-day expenses. Calculation:Insurance + Property Taxes + Property Management + Repairs & Maintenance + Capital Expenditures + HOA Fees | 43% | -$955 | -$11,463 |
Cash Flow
| Monthly | Yearly | |
|---|---|---|
Net Operating Income (NOI)The income generated from a property after deducting all operating expenses but before deducting mortgage payments, taxes, and capital expenditures. Calculation:Gross Operating Income - Operating Expenses
Net operating income:
| $1,113 | $13,356 |
Mortgage PaymentThe fixed amount a borrower pays each month to repay a loan. It typically includes principal and interest (P&I) and may also cover property taxes, insurance, HOA fees, and PMI if escrowed. | -$1,706 | -$20,472 |
Cash FlowNet Operating Income (NOI) minus mortgage payments. Calculation:NOI - Mortgage Payments | -$593 | -$7,116 |