

$685,000
Investment Summary
- Monthly Cash Flow
- -$1,006
- Cap Rate
- 3.9%
- Cash-on-Cash Return
- -7.7%
- Debt Coverage Ratio
- 0.69
- Internal Rate of Return (5 years)
- -3.4%
Cash Flow
Net Operating Income (NOI) minus mortgage payments.
Calculation:
NOI - Mortgage Payments
Cap Rate (Market Value)
Capitalization Rate is a rate of return that compares the yearly Net Operating Income (NOI) to the market value.
Calculation:
NOI / Market Value
Cash-on-Cash Return (CoC)
Annual Cash Flow / Cash Invested
Calculation:
Annual cash flow divided by initial cash invested.
Debt Coverage Ratio (DCR)
Net Operating Income (NOI) divided by total debt payments.
Calculation:
NOI / Total Debt Payments
Internal Rate of Return (IRR)
A metric for assessing profitability over time. IRR is the discount rate at which the net present value (NPV) of all future cash flows (positive and negative) from an investment equals zero — including both periodic cash flow (such as rent) and a projected sale at the end of the holding period. It represents the expected annualized return, accounting for income, expenses, and the recovery of capital through a future sale.
Property Description
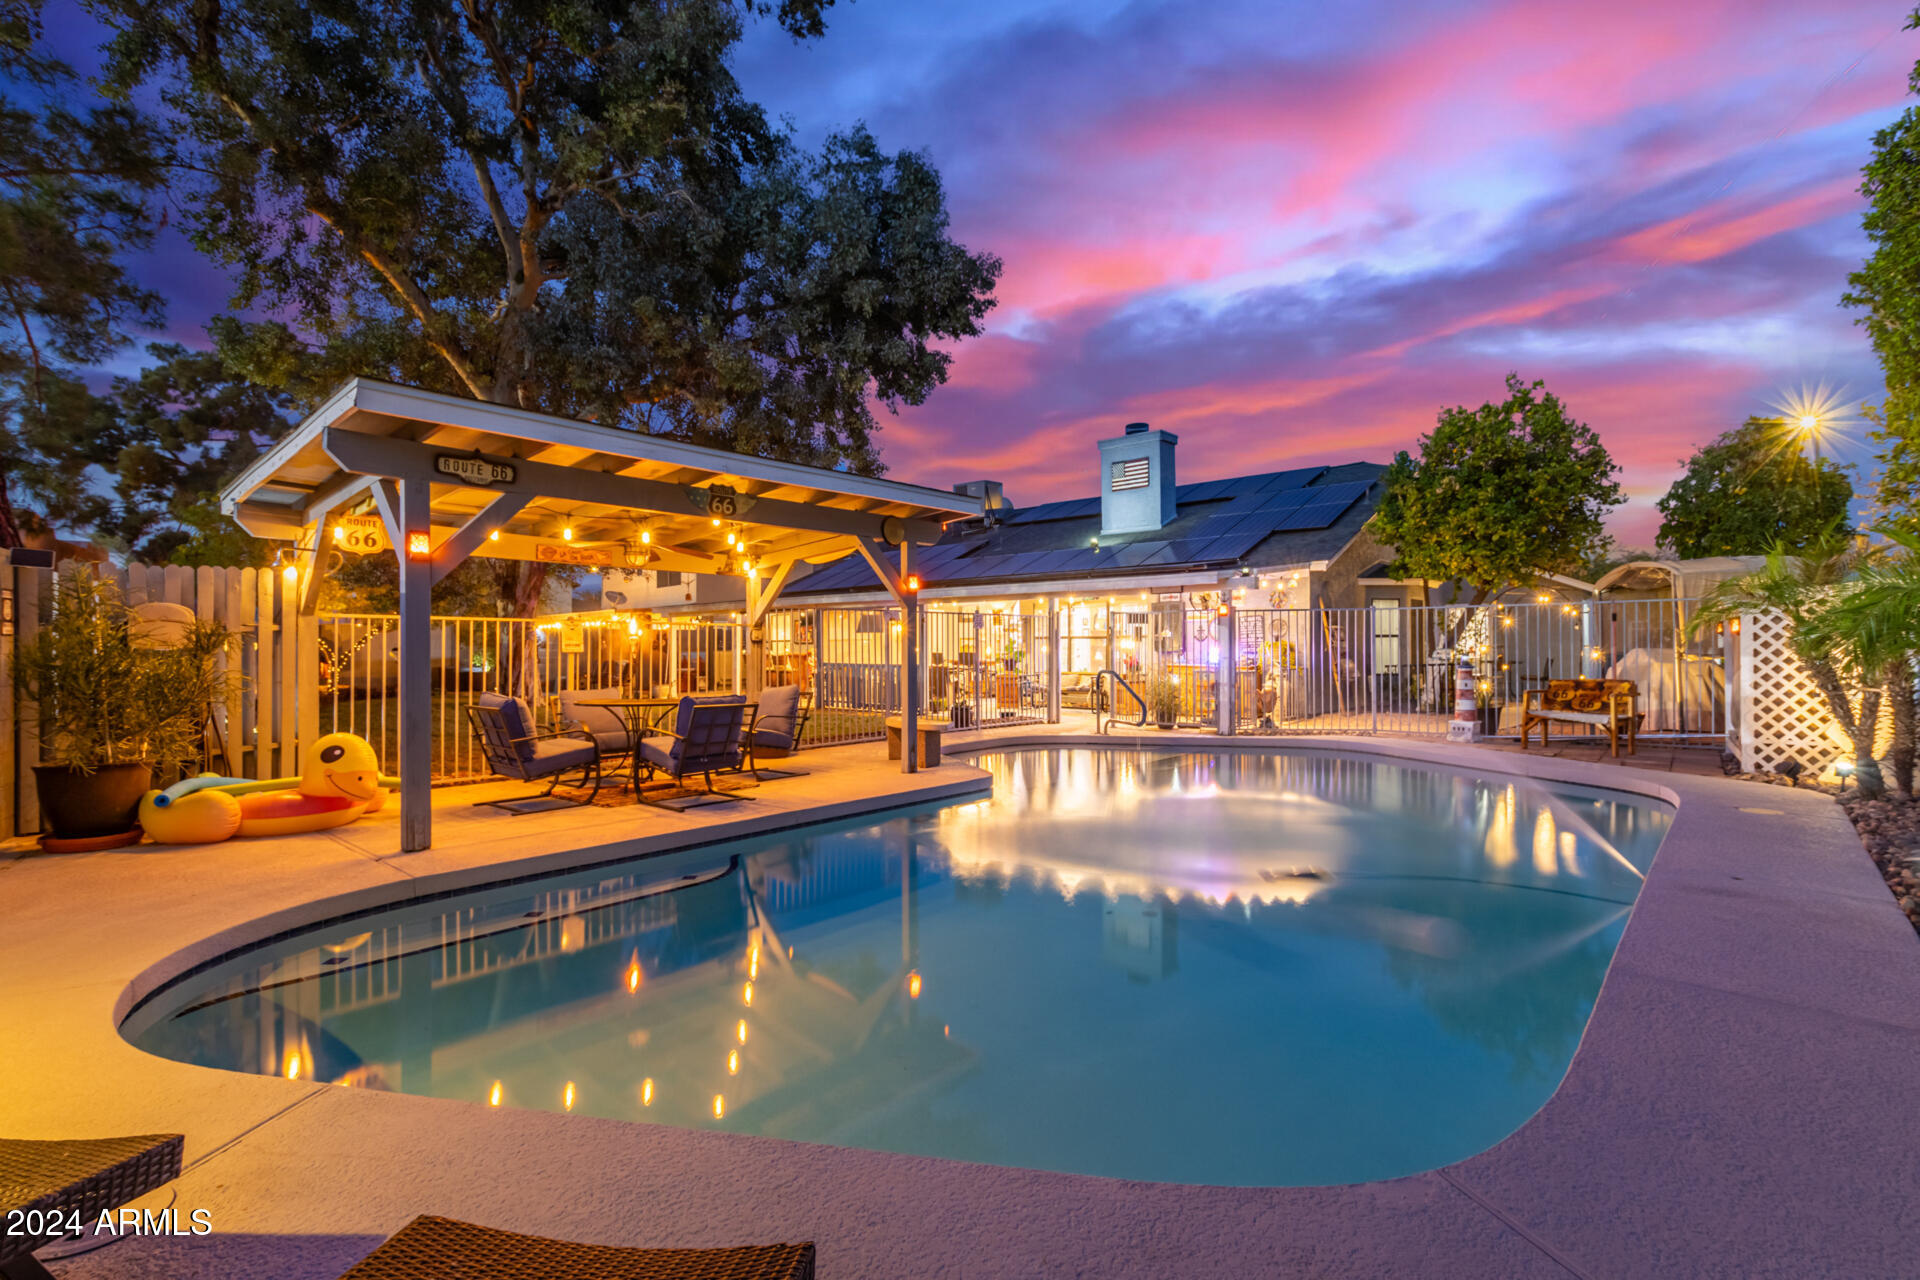
Private Pool & Hot Tub, Large Lot, RV Gate, Solar Panels, NO HOA, Extended Patio, Charming Home with updates throughout! Nestled in a serene neighborhood, this immaculate thoughtfully designed home awaits your personal touches to enhance the pristine upgrades & calm feeling when entering in through all entrances. Amazing, there are no neighbors behind, only stunning breath-taking sunset views! The home offers a dining area that faces the view of the backyard to enjoy your morning coffee with the plethora of natural light from the sun shining in the windows enjoying the oasis of the backyard. Discover new wood plank flooring throughout, vaulted ceilings, & the ambiance of a two-way fireplace that connects the living room & family room, enhancing the home's personal character! Enhanced by an L-shaped island, tile counters, & mosaic backsplash. This versatile layout has a unique appeal, whether in the kitchen, living room or dining area you're all together to enjoy gatherings, entertaining or movie watching, with the unique design. The primary suite is split from the other bedrooms. One bedroom is used as a bedroom office and its equipped with a queen size murphy bed with dual access. The kitchen boasts an island big enough to place bar stools and have your meals. This island offers an easy access when entertaining to have full access to all the cabinets, counters and the pantry within a short reach.. The primary suite is a sight to behold. It magnifies a spacious walk-in closet, with shelving up to the ceiling with crazy amounts of room. Every lady's dream closet. The master bathroom has a 3-piece bath with a private toilet area, separate shower with a glass enclosure which is the ultimate convenience . A wall of counters, ample amount of space, mirrors, a built-in fireplace, yes, a built-in fireplace enhancing the coziness while getting ready for your day. Lets Step outside from your master suite to an upgraded backyard oasis, where a shimmering swimming pool invites relaxation and recreation, creating an idyllic setting for endless summer days and starlit evenings enhanced with full back designed lighting. The grassy backyard is complemented by fruit trees, firepit, two Ramadas, above-ground spa, & full-length extended covered patio. Unwind in the serene backyard, with the wow feeling when coming home after work at the end of the day, put your feet up, click on the backyard lights and take a deep breath and enjoy the bright moon shadows and starlit nights. This home is a stay vacation resort, perfect for making lasting memories. The 3-car garage has a full attic storage with a drop down ladder, work bench and a pvt entrance to the back yard. Bonus, this home is equipped with an RV gate/parking which is an added space for your extra or play vehicles! Plus, did I mention solar panels! Who doesn't want a break in the electric bill. This home truly offers the best of Arizona living! The location doesn't get any better than this either, No Hoa ,close to schools, churches, shopping, and easy access to the Red Mountain 202 freeway. Don't take my word for it and don't miss out, come see for yourself and lock this in!
Build Your Team
Quickly find investor-friendly professionals who can help you succeed in real estate investing at any stage of the investing journey.


Agents
Match with investor-friendly agents who can help you find, analyze, and close your next deal


Lenders
Get the best funding…find investor-friendly lenders who specialize in your deal strategy


Property Managers
Transition to passive investing. Find a trusted property management partnership that lasts.


Tax Pros & Accountants
Taxes and financial reporting made easy—find experts to create tax savings strategies, file taxes, and more
Location
Property Details
Parking
- Description: Dir Entry frm Garage, Electric Door Opener, RV Gate, RV Access/Parking
- Details: RV Access/Parking, Garage Door Opener, Direct Access
- Garage Spaces: 3
- Spaces Total: 3
Bedroom Information
- # of Bedrooms: 4
Bathroom Information
- # of Baths (Total): 2.0
Interior Features
- # of Rooms: 7
- # of Stories: 1
- Fireplace: Yes
Exterior Features
- Exterior Walls Materials: Stucco
- Roof Material: Composition
- Pool: Yes
- Solar Panels: Yes
Land Information
- Land Use: Residential
- Land Use Subtype: Single Family Residential
Lot Information
- Parcel ID: 14187012
- Lot Size: 10474 sqft
Property Information
- Property Type: Single Family Residence
- Style: Ranch
- Year Built: 1987
Tax Information
- Annual Tax: $2,148
Utilities
- Water & Sewer: Public
- Heating: Electric
- Cooling: Central Air, Ceiling Fan(s)
Location
- County: Maricopa
Listing Details
Investment Summary
- Monthly Cash Flow
- -$1,006
- Cap Rate
- 3.9%
- Cash-on-Cash Return
- -7.7%
- Debt Coverage Ratio
- 0.69
- Internal Rate of Return (5 years)
- -3.4%
Cash Flow
Net Operating Income (NOI) minus mortgage payments.
Calculation:
NOI - Mortgage Payments
Cap Rate (Market Value)
Capitalization Rate is a rate of return that compares the yearly Net Operating Income (NOI) to the market value.
Calculation:
NOI / Market Value
Cash-on-Cash Return (CoC)
Annual Cash Flow / Cash Invested
Calculation:
Annual cash flow divided by initial cash invested.
Debt Coverage Ratio (DCR)
Net Operating Income (NOI) divided by total debt payments.
Calculation:
NOI / Total Debt Payments
Internal Rate of Return (IRR)
A metric for assessing profitability over time. IRR is the discount rate at which the net present value (NPV) of all future cash flows (positive and negative) from an investment equals zero — including both periodic cash flow (such as rent) and a projected sale at the end of the holding period. It represents the expected annualized return, accounting for income, expenses, and the recovery of capital through a future sale.
Purchase Details
Purchase PriceThe price paid for the property. Purchase price:
| $685,000 |
|---|---|
Amount FinancedThe amount of the purchase financed through a loan. Amount financed:
| -$548,000 |
Down paymentThe initial payment made towards the purchase. Down payment:
| $137,000 |
Closing CostsFees and expenses associated with purchasing a property, typically ranging from 2% to 5% of the home’s purchase price, paid at the end of a home purchase to cover services like lending, title transfer, and taxes. Closing costs:
| $20,550 |
Rehab CostsCosts incurred to repair or improve the property, including: roof, flooring, exterior siding, kitchen, exterior paint, bathrooms, etc. Rehab costs:
| $0 |
Initial Cash InvestedThe total initial cash invested in the property. Calculation:Down payment + Buying costs + Rehab costs Initial cash invested:
| $157,550 |
Square Feet (SQFT)The total square footage of the property. Square feet:
| 1,918 |
Cost Per Square FootCost per square foot of the property. Calculation:Purchase Price / Square Feet Cost per square foot:
| $357 |
Monthly Rent Per Square FootMonthly rent divided by the number of square feet. This ratio helps investors compare rental income efficiency across properties, markets, and unit sizes Calculation:Monthly Rent / Square Feet Monthly rent per square foot:
| $1.82 |
Financing Details
Loan AmountThe total sum of money borrowed from a lender to finance a property purchase. Calculation:Purchase Price - Down Payment
Loan amount:
| $548,000 |
|---|---|
Loan to Value Ratio (LTV)Loan amount divided by the market value of the property. Calculation:Loan Amount / Market Value
Loan to value ratio:
| 80.0% |
Loan TypeThe type of loan (e.g., fixed, adjustable).
Loan type:
| Amortizing |
TermThe loan repayment period in years.
Term:
| 30 years |
Interest RateThe percentage a lender charges on the borrowed amount of a loan, determining the cost of borrowing money.
Interest rate:
| 5.875% |
Principal & Interest (PI)The principal is the portion of the loan payment that reduces the loan balance. The interest is the lender's charge for borrowing money. Calculation:(P * r * (1 + r) ** n) / ((1 + r) ** n - 1) Where:
P = Loan amount (principal)
Principal & interest:
| $3,242 |
Property TaxesAnnual taxes levied by local governments on real estate properties. These taxes fund public services like schools, roads, and emergency services.
Property tax:
| $179 |
InsuranceThe costs for insurance coverage to protect against financial losses due to risks like fire, natural disasters, theft, liability, or tenant-related damages. Calculation:Assumes 7% of gross rental income, unless insurance rates are specified.
Insurance:
| $245 |
Private Mortgage Insurance (PMI)A fee that borrowers pay when they take out a conventional loan with a loan-to-value (LTV) ratio above 80%.
Private mortgage insurance (PMI):
| $0 |
Monthly PaymentThe fixed amount a borrower pays each month to repay a loan. It typically includes principal and interest (P&I) and may also cover property taxes, insurance, HOA fees, and PMI if escrowed. Monthly payment:
| $3,666 |
Operating Income
| % Rent | Monthly | Yearly | |
|---|---|---|---|
Gross RentThe total rental income received from tenants before deducting any expenses. Includes base rent, late fees, pet fees, parking fees, and other recurring charges.
Gross rent:
| $3,500 | $42,000 | |
Vacancy LossExpected loss of rent due to vacancies.
Vacancy loss:
(6%)
| 6% | -$210 | -$2,520 |
Operating IncomeGross rental income minus vacancy loss. Calculation:Gross rent - Vacancy loss
Operating income:
| $3,290 | $39,480 |
Operating Expenses
| % Rent | Monthly | Yearly | |
|---|---|---|---|
Property TaxesAnnual taxes levied by local governments on real estate properties. These taxes fund public services like schools, roads, and emergency services. | 5% | -$179 | -$2,148 |
InsuranceThe costs for insurance coverage to protect against financial losses due to risks like fire, natural disasters, theft, liability, or tenant-related damages. Calculation:Assumes 7% of gross rental income, unless insurance rates are specified. | 7% | -$245 | -$2,940 |
Property ManagementThe costs associated with hiring a property manager to handle the day-to-day operations of a rental property. Includes management fees, leasing fes, eviction fees, etc. Calculation:Assumes 8% of gross rental income. | 8% | -$280 | -$3,360 |
Repairs & MaintenanceOngoing costs for routine upkeep and minor fixes needed to keep a property in good working condition. Calculation:Assumes 5% of gross rental income. Varies by property age and condition. | 5% | -$175 | -$2,100 |
Capital ExpensesLarge, infrequent costs for major improvements or replacements, like a new roof, HVAC system, or appliances. Calculation:Assumes 5% of gross rental income. Varies by property age. | 5% | -$175 | -$2,100 |
HOA FeesRegular dues paid to a Homeowners Association for community maintenance, amenities, and management. Similar fees include: Condo Association Fees, Co-op Maintenance Fees, etc. | n/a | n/a | n/a |
Operating ExpensesRecurring costs required to maintain and manage a rental property, including property taxes, insurance, maintenance, repairs, utilities (if paid by the owner), property management fees, and other day-to-day expenses. Calculation:Insurance + Property Taxes + Property Management + Repairs & Maintenance + Capital Expenditures + HOA Fees | 30% | -$1,054 | -$12,648 |
Cash Flow
| Monthly | Yearly | |
|---|---|---|
Net Operating Income (NOI)The income generated from a property after deducting all operating expenses but before deducting mortgage payments, taxes, and capital expenditures. Calculation:Gross Operating Income - Operating Expenses
Net operating income:
| $2,236 | $26,832 |
Mortgage PaymentThe fixed amount a borrower pays each month to repay a loan. It typically includes principal and interest (P&I) and may also cover property taxes, insurance, HOA fees, and PMI if escrowed. | -$3,242 | -$38,904 |
Cash FlowNet Operating Income (NOI) minus mortgage payments. Calculation:NOI - Mortgage Payments | $1,006 | $12,072 |