$534,900
Investment Summary
- Monthly Cash Flow
- -$1,162
- Cap Rate
- 3.5%
- Cash-on-Cash Return
- -11.3%
- Debt Coverage Ratio
- 0.58
- Internal Rate of Return (5 years)
- -7.0%
Cash Flow
Net Operating Income (NOI) minus mortgage payments.
Calculation:
NOI - Mortgage Payments
Cap Rate (Market Value)
Capitalization Rate is a rate of return that compares the yearly Net Operating Income (NOI) to the market value.
Calculation:
NOI / Market Value
Cash-on-Cash Return (CoC)
Annual Cash Flow / Cash Invested
Calculation:
Annual cash flow divided by initial cash invested.
Debt Coverage Ratio (DCR)
Net Operating Income (NOI) divided by total debt payments.
Calculation:
NOI / Total Debt Payments
Internal Rate of Return (IRR)
A metric for assessing profitability over time. IRR is the discount rate at which the net present value (NPV) of all future cash flows (positive and negative) from an investment equals zero — including both periodic cash flow (such as rent) and a projected sale at the end of the holding period. It represents the expected annualized return, accounting for income, expenses, and the recovery of capital through a future sale.
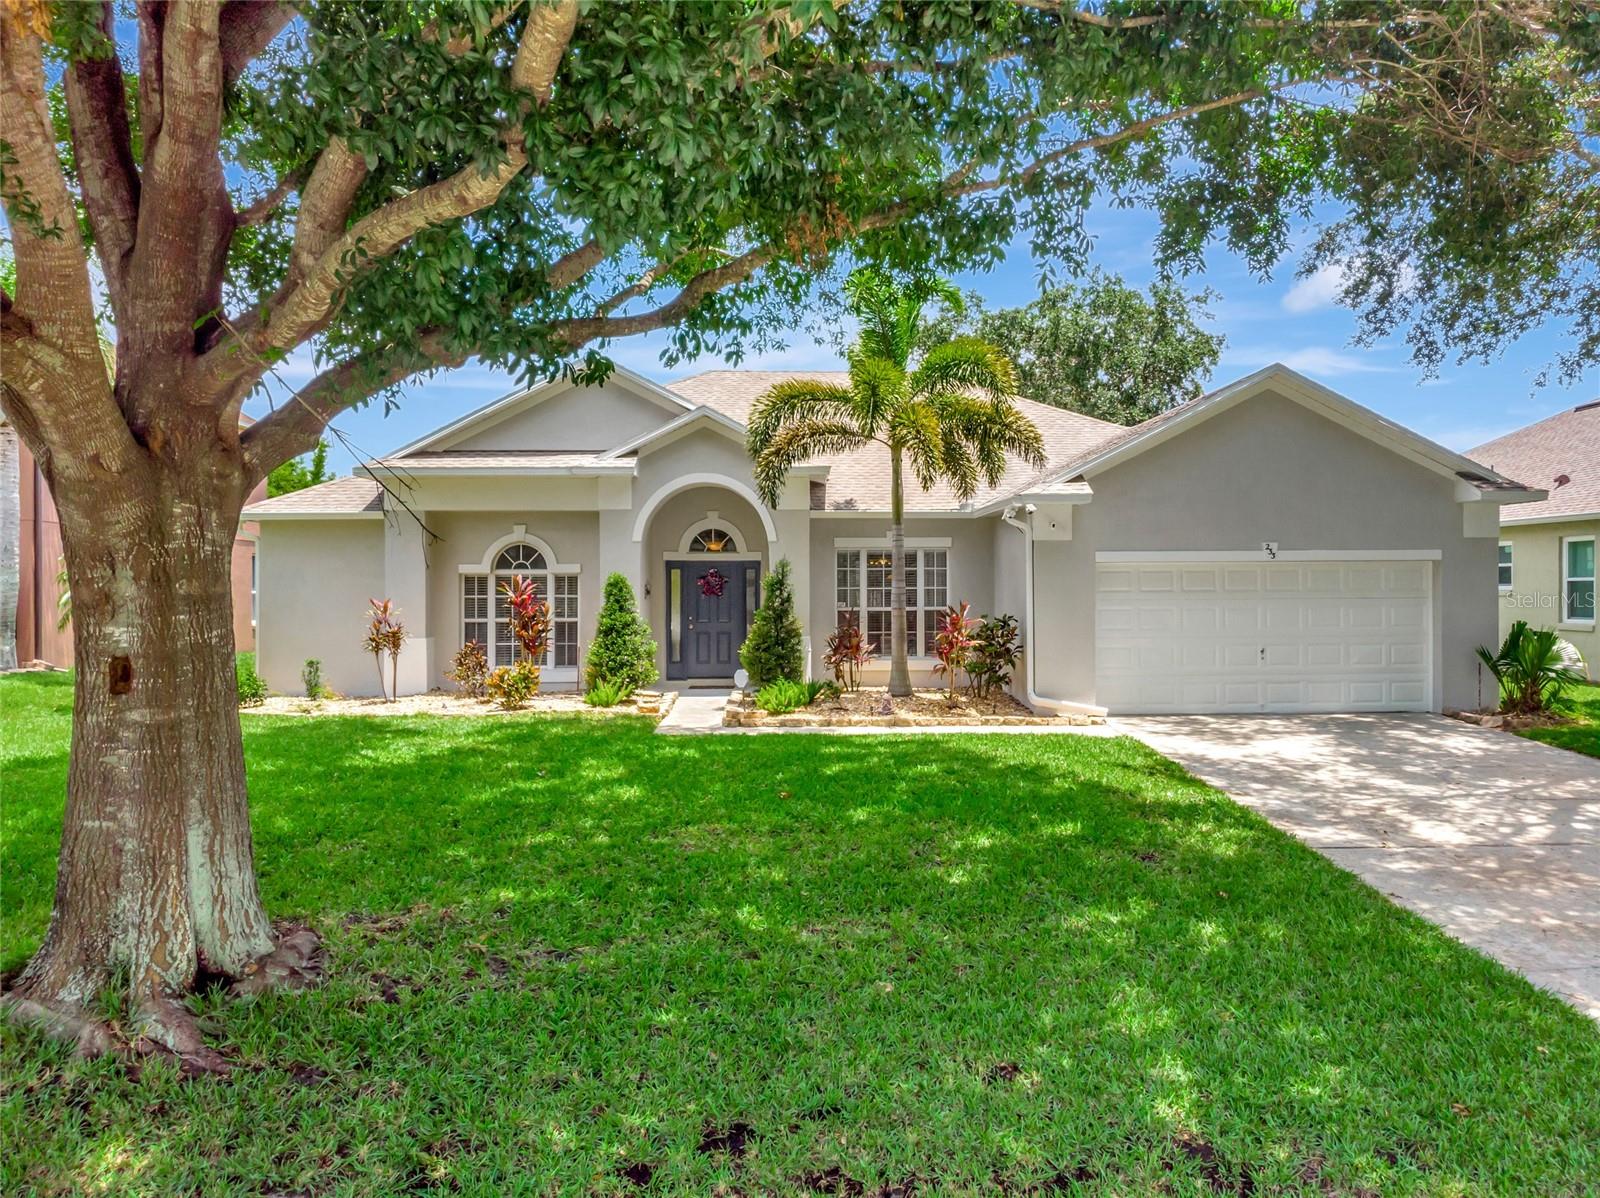
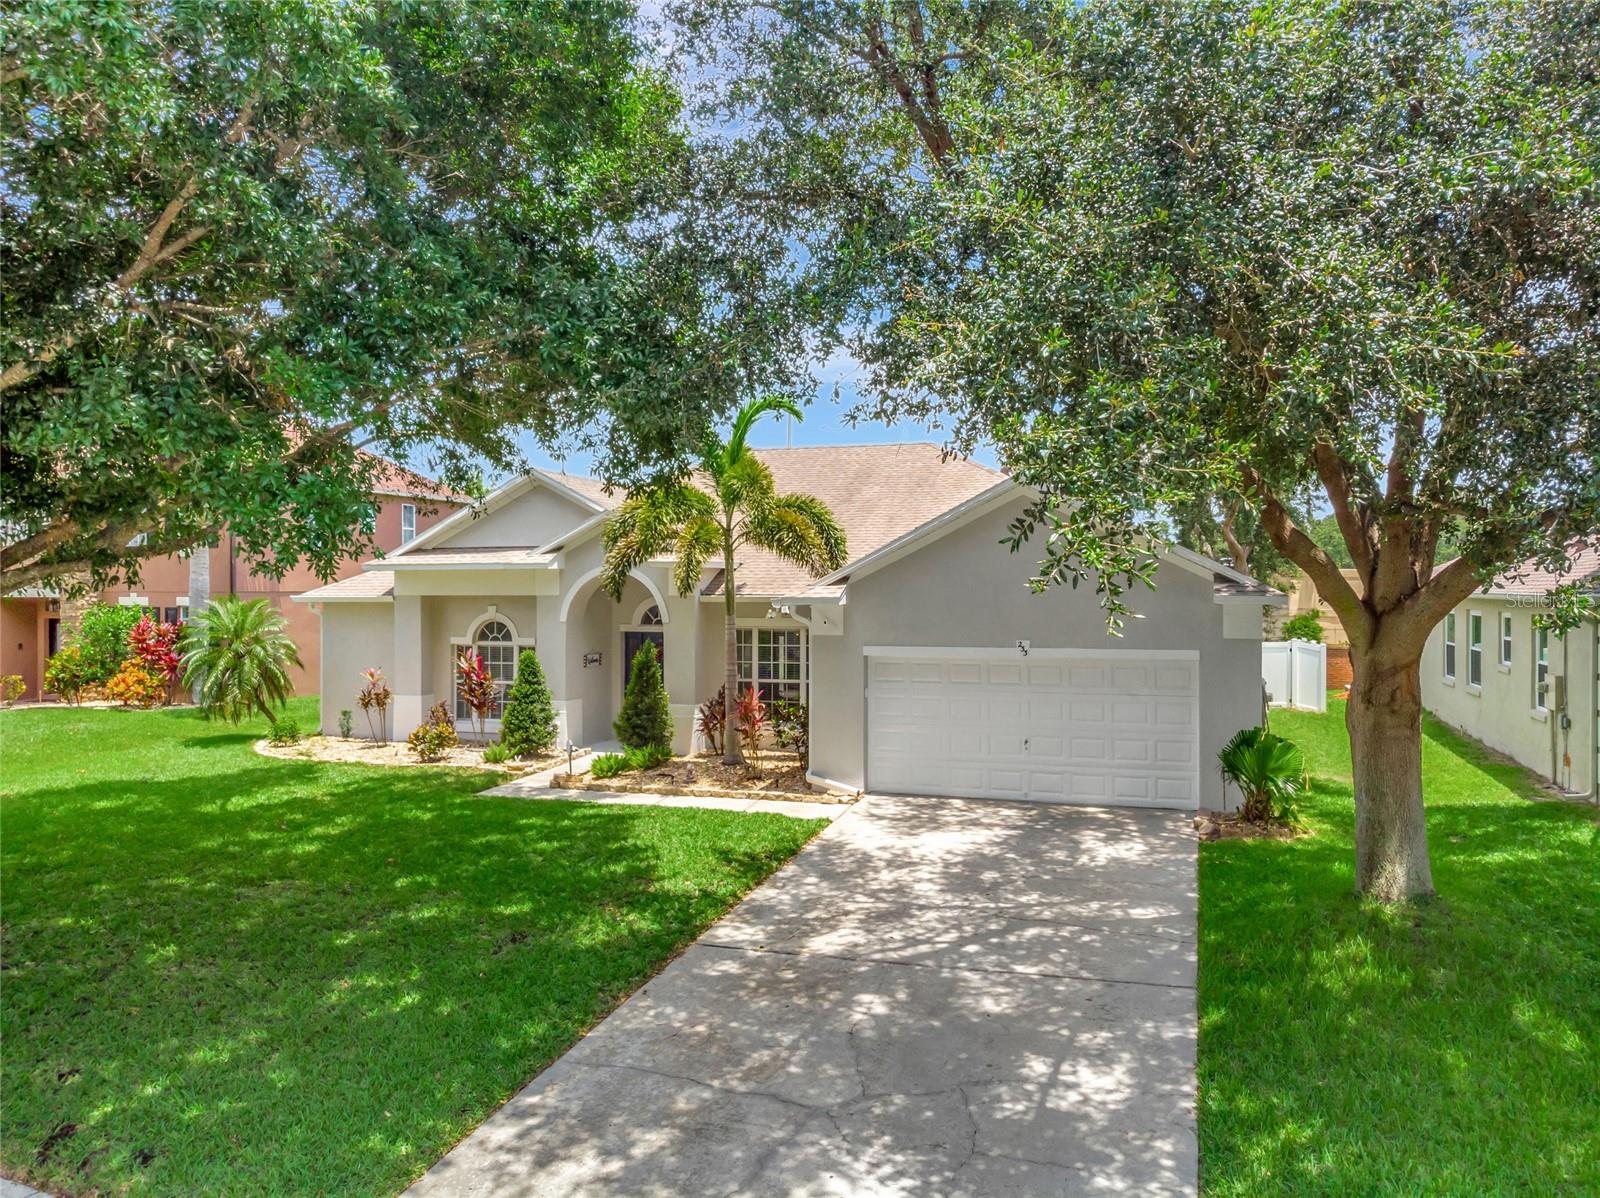
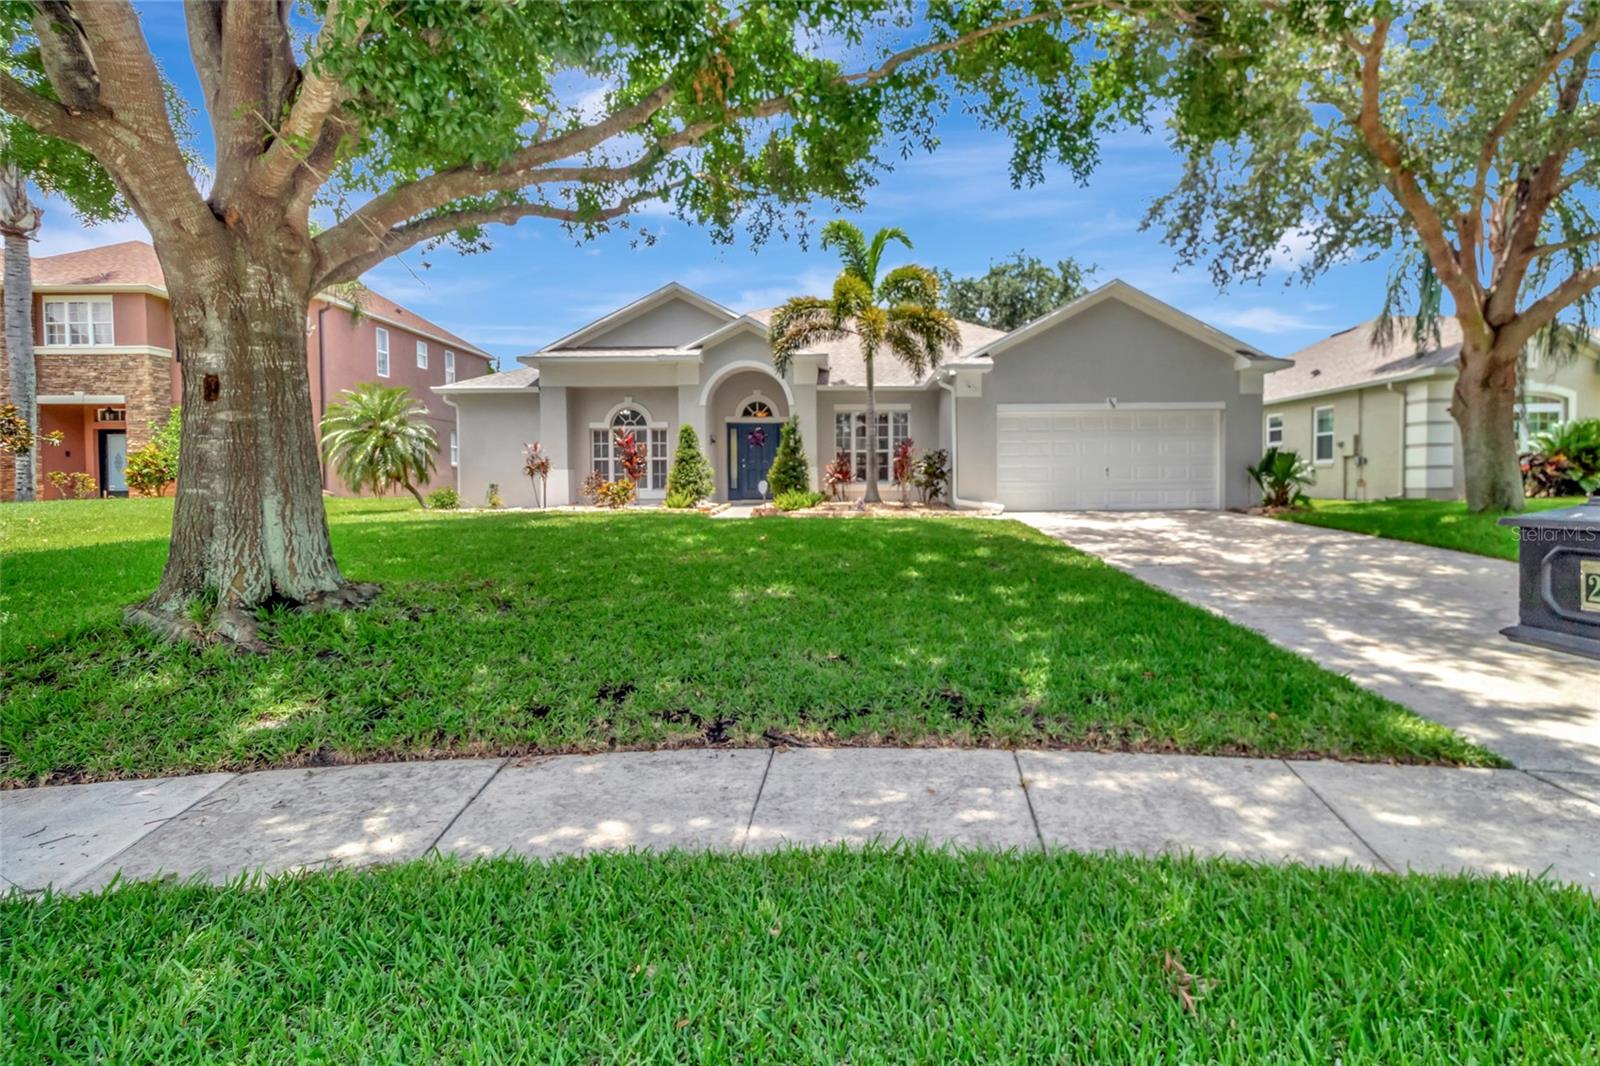
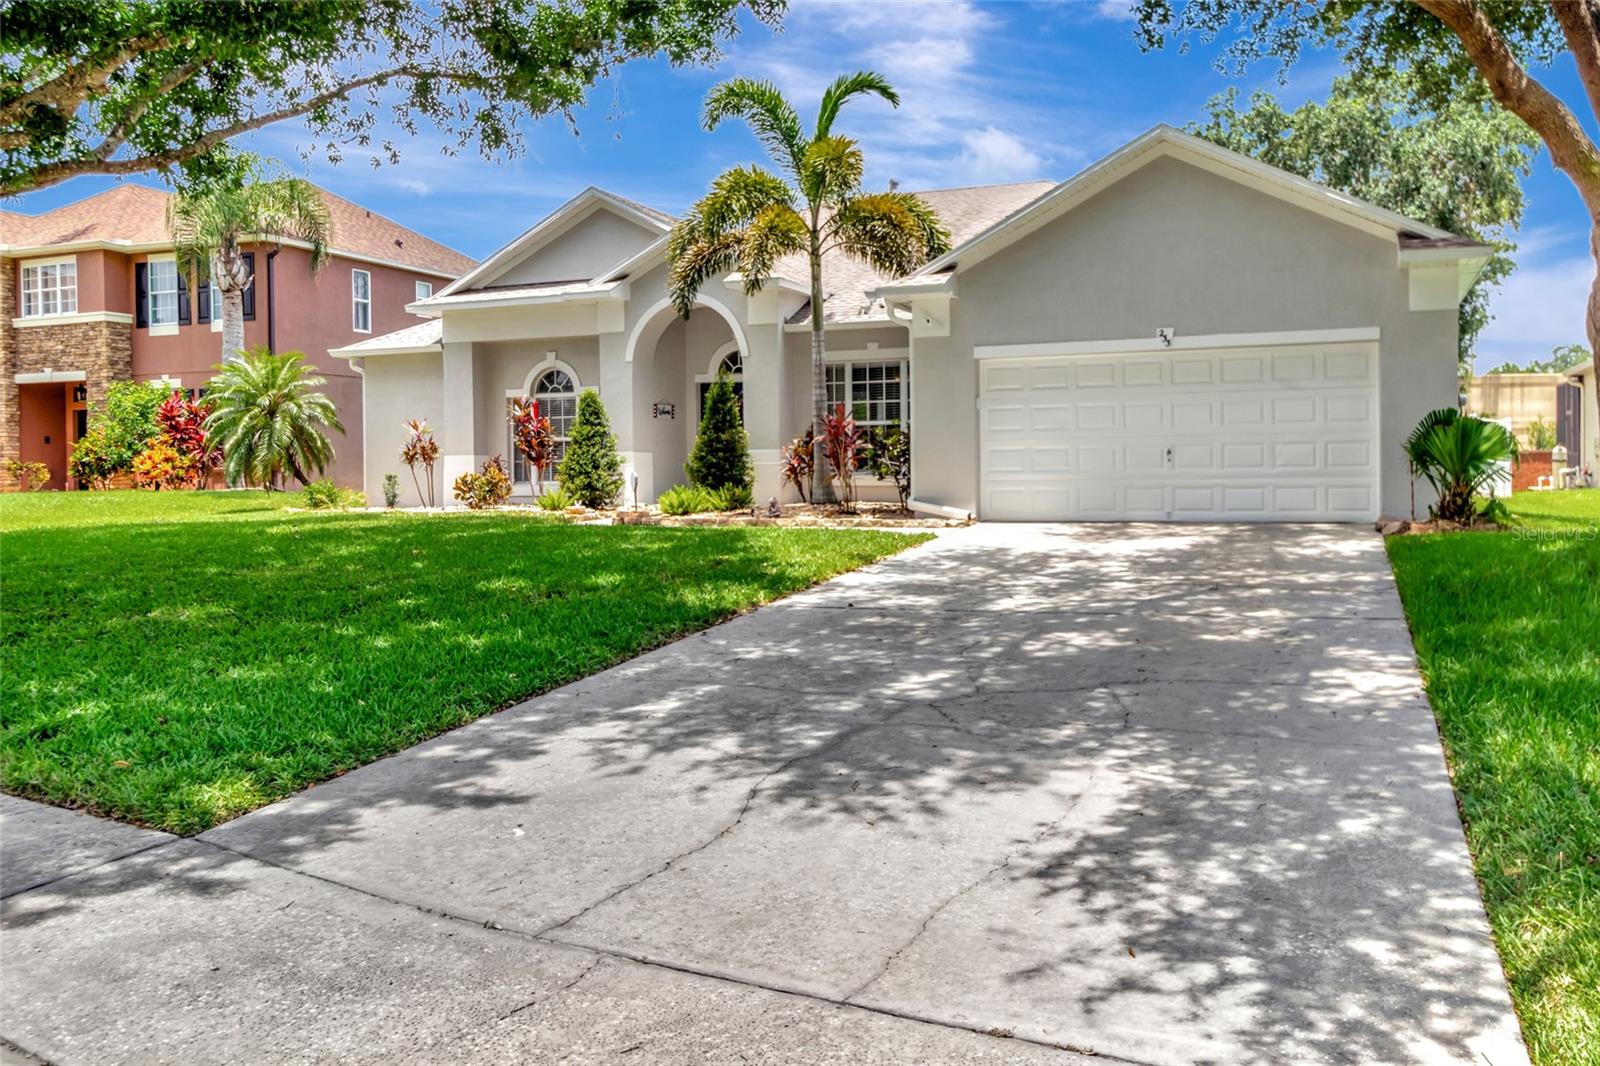
Property Description
Luxury, Convenience, and Comfort in John’s Landing! This thoughtfully updated and move-in ready 4-bedroom, 2-bath home offers flexible living in one of Oakland/Winter Garden’s most desirable gated communities, the gorgeous John’s Landing. You will feel welcomed home with mature landscaping, an extended driveway, a covered entry, Ring doorbell, and exterior lighting—perfect for a warm arrival day or night. Natural light fills the home, showcasing fresh neutral paint, new 9” LVP flooring (2024) and 5” baseboards throughout. A spacious front living room off the foyer provides a warm greeting, while a formal dining room easily flexes as a home office or den to fit your lifestyle. The heart of the home is the huge updated kitchen featuring granite counters, a stylish backsplash, ample storage, under-cabinet microwave, beverage station/wine rack, and a large pantry. There’s plenty of prep space with a breakfast bar and an additional eat-in nook overlooking the outdoor patio and family room—perfect for gatherings. The primary suite offers a serene retreat with sliding glass doors to the screened-in patio, dual large walk-in closets, and a spacious en suite spa-like bath with soaking tub, walk-in shower, and private water closet, and a private door to the second bedroom for optional nursery or office use. The split floor plan offers two additional spacious bedrooms and a second updated full bathroom for added privacy with lots of extra storage and closet space. Step outside to your backyard oasis, featuring a large screened-in patio that flows to an expansive paved area (sealed & painted 2025) with an amazing in-ground spa with updated pump (2025), separate covered grill area, and a tiered patio with a fire pit area—ideal for Florida evenings under the stars, perfect for cozy gatherings and sunset chats. A graceful row of bamboo along the back creates a soft natural screen, adding a layer of privacy while allowing you to enjoy the breeze and creates a low-maintenance back yard so you can spend your time enjoying the Florida Sunshine! For added flexibility and future growth, the extended 2-car garage offers ample shelving, a two-bike pulley system, and space for workshop or additional storage for kayaks, SUPs or boating equipment, making it easy to keep everything organized while fitting your lifestyle. The community offers a private boat ramp for easy access to John’s Lake for boating, fishing, jet skiing, and amenities include pickleball, tennis, basketball, and a playground. The location is unbeatable, with top-rated schools, easy access to the West Orange Trail, and minutes from historic Downtown Winter Garden, Plant Street Market, lots of shopping, parks, dining, and the renowned farmers market. Enjoy an easy commute to Disney, Universal, downtown Orlando, and the airport, with a new hospital and much more coming nearby! Don’t miss the chance to live in the heart of one of Central Florida’s fastest-growing and most loved communities in this beautiful move-in-ready home with room to live, work, and play! Schedule your showing today and discovery your next chapter in John’s Landing! Roof 2019, HVAC 2019, Some windows replaced 2022.
Build Your Team
Quickly find investor-friendly professionals who can help you succeed in real estate investing at any stage of the investing journey.


Agents
Match with investor-friendly agents who can help you find, analyze, and close your next deal


Lenders
Get the best funding…find investor-friendly lenders who specialize in your deal strategy


Property Managers
Transition to passive investing. Find a trusted property management partnership that lasts.


Tax Pros & Accountants
Taxes and financial reporting made easy—find experts to create tax savings strategies, file taxes, and more
Location
Property Details
Parking
- Description: Garage Door Opener
- Details: Garage Door Opener, Oversized, Attached
- Garage Spaces: 2
- Spaces Total: 0
Bedroom Information
- # of Bedrooms: 4
Bathroom Information
- # of Baths (Full): 2
- # of Baths (Total): 2.0
Interior Features
- # of Rooms: 9
- # of Stories: 1
Exterior Features
- Exterior Walls Materials: Stucco
- Foundation: Slab
- Roof Type: Gable or Hip
- Roof Material: Shingle
HOA
- Has HOA: Yes
- Association: John’s Landing HOA / Folio Association Mgmt
- HOA Fee: $550/semi-annually
Land Information
- Land Use: Residential
- Land Use Subtype: Single Family Residential
Lot Information
- Parcel ID: 292227402001890
- Lot Size: 9746 sqft
Property Information
- Property Type: Single Family Residence
- Year Built: 2004
Tax Information
- Annual Tax: $3,968
Utilities
- Water & Sewer: Public
- Heating: Electric
- Cooling: Central Air
Location
- County: Orange
Listing Details
Investment Summary
- Monthly Cash Flow
- -$1,162
- Cap Rate
- 3.5%
- Cash-on-Cash Return
- -11.3%
- Debt Coverage Ratio
- 0.58
- Internal Rate of Return (5 years)
- -7.0%
Cash Flow
Net Operating Income (NOI) minus mortgage payments.
Calculation:
NOI - Mortgage Payments
Cap Rate (Market Value)
Capitalization Rate is a rate of return that compares the yearly Net Operating Income (NOI) to the market value.
Calculation:
NOI / Market Value
Cash-on-Cash Return (CoC)
Annual Cash Flow / Cash Invested
Calculation:
Annual cash flow divided by initial cash invested.
Debt Coverage Ratio (DCR)
Net Operating Income (NOI) divided by total debt payments.
Calculation:
NOI / Total Debt Payments
Internal Rate of Return (IRR)
A metric for assessing profitability over time. IRR is the discount rate at which the net present value (NPV) of all future cash flows (positive and negative) from an investment equals zero — including both periodic cash flow (such as rent) and a projected sale at the end of the holding period. It represents the expected annualized return, accounting for income, expenses, and the recovery of capital through a future sale.
Purchase Details
Purchase PriceThe price paid for the property. Purchase price:
| $534,900 |
|---|---|
Amount FinancedThe amount of the purchase financed through a loan. Amount financed:
| -$427,920 |
Down paymentThe initial payment made towards the purchase. Down payment:
| $106,980 |
Closing CostsFees and expenses associated with purchasing a property, typically ranging from 2% to 5% of the home’s purchase price, paid at the end of a home purchase to cover services like lending, title transfer, and taxes. Closing costs:
| $16,047 |
Rehab CostsCosts incurred to repair or improve the property, including: roof, flooring, exterior siding, kitchen, exterior paint, bathrooms, etc. Rehab costs:
| $0 |
Initial Cash InvestedThe total initial cash invested in the property. Calculation:Down payment + Buying costs + Rehab costs Initial cash invested:
| $123,027 |
Square Feet (SQFT)The total square footage of the property. Square feet:
| 2,176 |
Cost Per Square FootCost per square foot of the property. Calculation:Purchase Price / Square Feet Cost per square foot:
| $246 |
Monthly Rent Per Square FootMonthly rent divided by the number of square feet. This ratio helps investors compare rental income efficiency across properties, markets, and unit sizes Calculation:Monthly Rent / Square Feet Monthly rent per square foot:
| $1.33 |
Financing Details
Loan AmountThe total sum of money borrowed from a lender to finance a property purchase. Calculation:Purchase Price - Down Payment
Loan amount:
| $427,920 |
|---|---|
Loan to Value Ratio (LTV)Loan amount divided by the market value of the property. Calculation:Loan Amount / Market Value
Loan to value ratio:
| 80.0% |
Loan TypeThe type of loan (e.g., fixed, adjustable).
Loan type:
| Amortizing |
TermThe loan repayment period in years.
Term:
| 30 years |
Interest RateThe percentage a lender charges on the borrowed amount of a loan, determining the cost of borrowing money.
Interest rate:
| 6.625% |
Principal & Interest (PI)The principal is the portion of the loan payment that reduces the loan balance. The interest is the lender's charge for borrowing money. Calculation:(P * r * (1 + r) ** n) / ((1 + r) ** n - 1) Where:
P = Loan amount (principal)
Principal & interest:
| $2,740 |
Property TaxesAnnual taxes levied by local governments on real estate properties. These taxes fund public services like schools, roads, and emergency services.
Property tax:
| $331 |
InsuranceThe costs for insurance coverage to protect against financial losses due to risks like fire, natural disasters, theft, liability, or tenant-related damages. Calculation:Assumes 7% of gross rental income, unless insurance rates are specified.
Insurance:
| $203 |
Private Mortgage Insurance (PMI)A fee that borrowers pay when they take out a conventional loan with a loan-to-value (LTV) ratio above 80%.
Private mortgage insurance (PMI):
| $0 |
Monthly PaymentThe fixed amount a borrower pays each month to repay a loan. It typically includes principal and interest (P&I) and may also cover property taxes, insurance, HOA fees, and PMI if escrowed. Monthly payment:
| $3,274 |
Operating Income
| % Rent | Monthly | Yearly | |
|---|---|---|---|
Gross RentThe total rental income received from tenants before deducting any expenses. Includes base rent, late fees, pet fees, parking fees, and other recurring charges.
Gross rent:
| $2,900 | $34,800 | |
Vacancy LossExpected loss of rent due to vacancies.
Vacancy loss:
(6%)
| 6% | -$174 | -$2,088 |
Operating IncomeGross rental income minus vacancy loss. Calculation:Gross rent - Vacancy loss
Operating income:
| $2,726 | $32,712 |
Operating Expenses
| % Rent | Monthly | Yearly | |
|---|---|---|---|
Property TaxesAnnual taxes levied by local governments on real estate properties. These taxes fund public services like schools, roads, and emergency services. | 11% | -$331 | -$3,969 |
InsuranceThe costs for insurance coverage to protect against financial losses due to risks like fire, natural disasters, theft, liability, or tenant-related damages. Calculation:Assumes 7% of gross rental income, unless insurance rates are specified. | 7% | -$203 | -$2,436 |
Property ManagementThe costs associated with hiring a property manager to handle the day-to-day operations of a rental property. Includes management fees, leasing fes, eviction fees, etc. Calculation:Assumes 8% of gross rental income. | 8% | -$232 | -$2,784 |
Repairs & MaintenanceOngoing costs for routine upkeep and minor fixes needed to keep a property in good working condition. Calculation:Assumes 5% of gross rental income. Varies by property age and condition. | 5% | -$145 | -$1,740 |
Capital ExpensesLarge, infrequent costs for major improvements or replacements, like a new roof, HVAC system, or appliances. Calculation:Assumes 5% of gross rental income. Varies by property age. | 5% | -$145 | -$1,740 |
HOA FeesRegular dues paid to a Homeowners Association for community maintenance, amenities, and management. Similar fees include: Condo Association Fees, Co-op Maintenance Fees, etc. | 3% | -$92 | -$1,104 |
Operating ExpensesRecurring costs required to maintain and manage a rental property, including property taxes, insurance, maintenance, repairs, utilities (if paid by the owner), property management fees, and other day-to-day expenses. Calculation:Insurance + Property Taxes + Property Management + Repairs & Maintenance + Capital Expenditures + HOA Fees | 40% | -$1,148 | -$13,773 |
Cash Flow
| Monthly | Yearly | |
|---|---|---|
Net Operating Income (NOI)The income generated from a property after deducting all operating expenses but before deducting mortgage payments, taxes, and capital expenditures. Calculation:Gross Operating Income - Operating Expenses
Net operating income:
| $1,578 | $18,936 |
Mortgage PaymentThe fixed amount a borrower pays each month to repay a loan. It typically includes principal and interest (P&I) and may also cover property taxes, insurance, HOA fees, and PMI if escrowed. | -$2,740 | -$32,880 |
Cash FlowNet Operating Income (NOI) minus mortgage payments. Calculation:NOI - Mortgage Payments | -$1,162 | -$13,944 |