
$1,200,000
Investment Summary
- Monthly Cash Flow
- -$4,293
- Cap Rate
- 1.9%
- Cash-on-Cash Return
- -18.7%
- Debt Coverage Ratio
- 0.30
- Internal Rate of Return (5 years)
- -14.0%
Cash Flow
Net Operating Income (NOI) minus mortgage payments.
Calculation:
NOI - Mortgage Payments
Cap Rate (Market Value)
Capitalization Rate is a rate of return that compares the yearly Net Operating Income (NOI) to the market value.
Calculation:
NOI / Market Value
Cash-on-Cash Return (CoC)
Annual Cash Flow / Cash Invested
Calculation:
Annual cash flow divided by initial cash invested.
Debt Coverage Ratio (DCR)
Net Operating Income (NOI) divided by total debt payments.
Calculation:
NOI / Total Debt Payments
Internal Rate of Return (IRR)
A metric for assessing profitability over time. IRR is the discount rate at which the net present value (NPV) of all future cash flows (positive and negative) from an investment equals zero — including both periodic cash flow (such as rent) and a projected sale at the end of the holding period. It represents the expected annualized return, accounting for income, expenses, and the recovery of capital through a future sale.
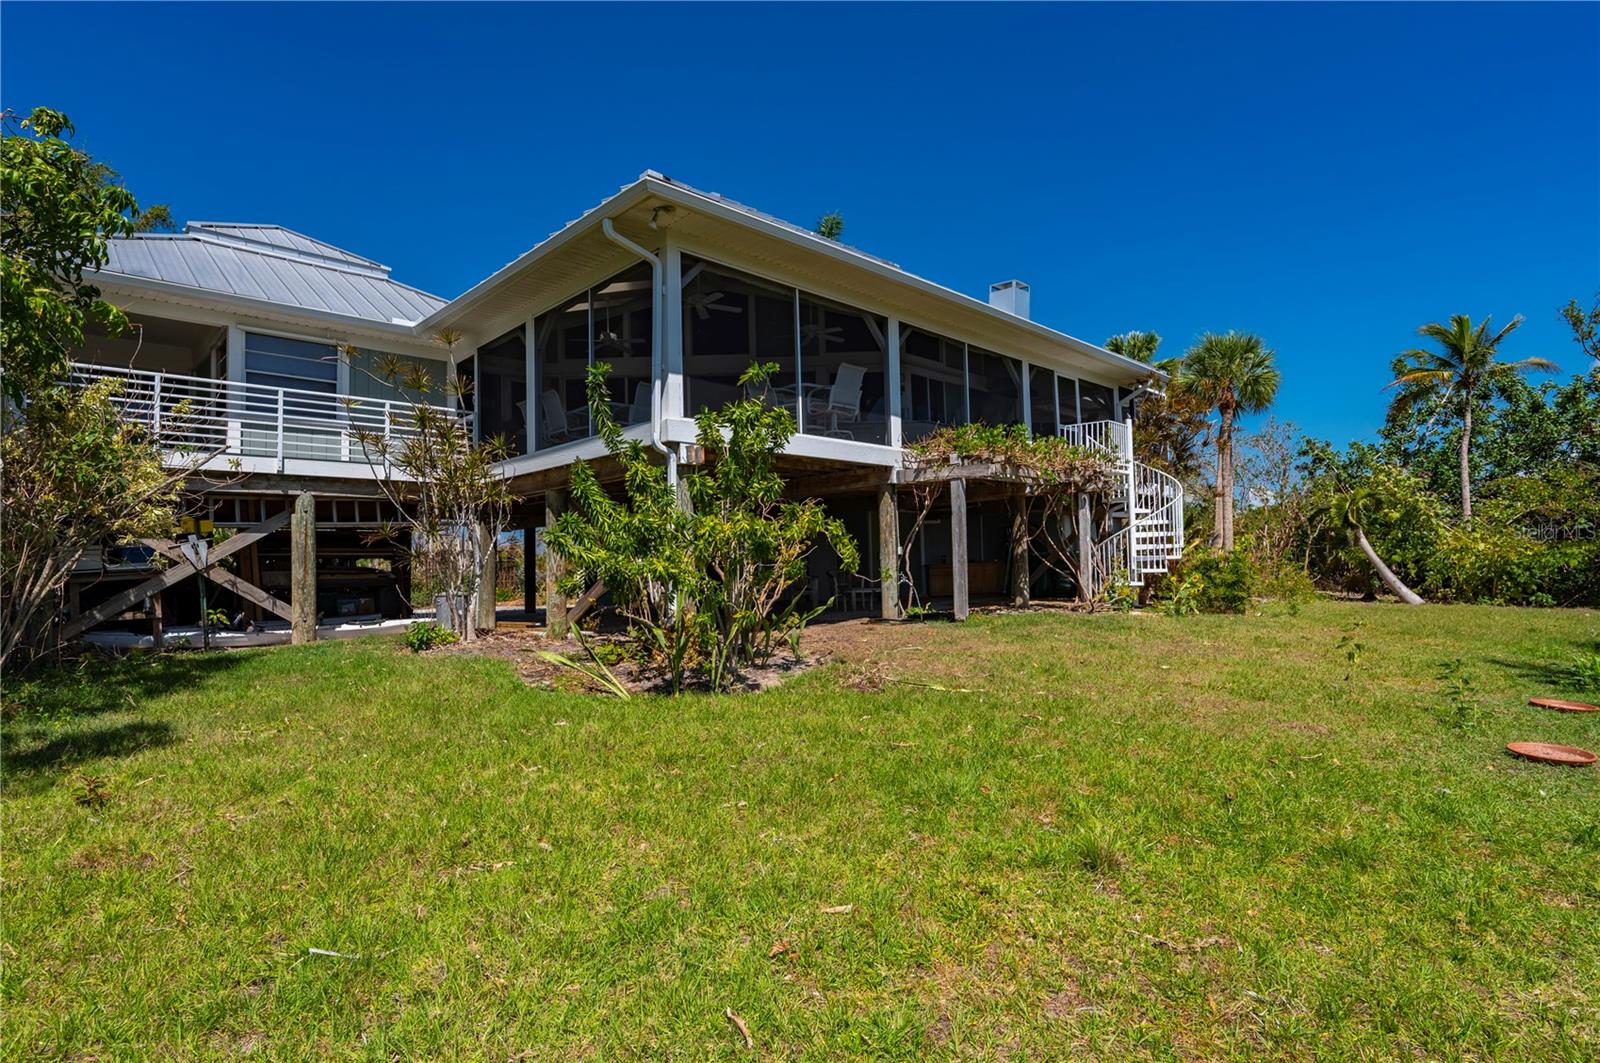
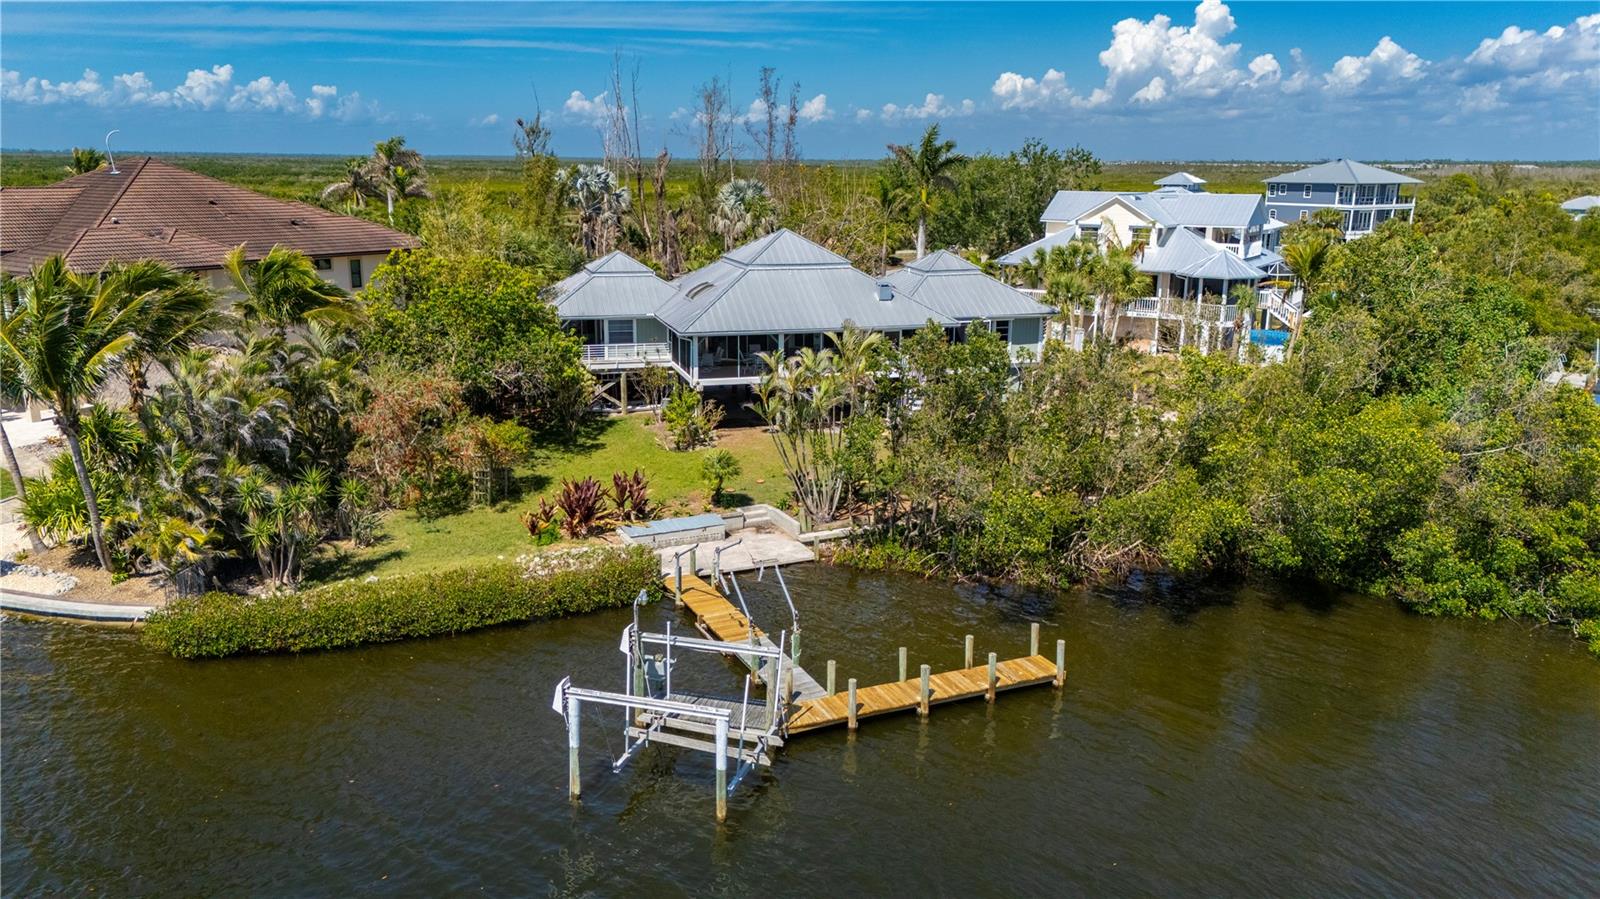
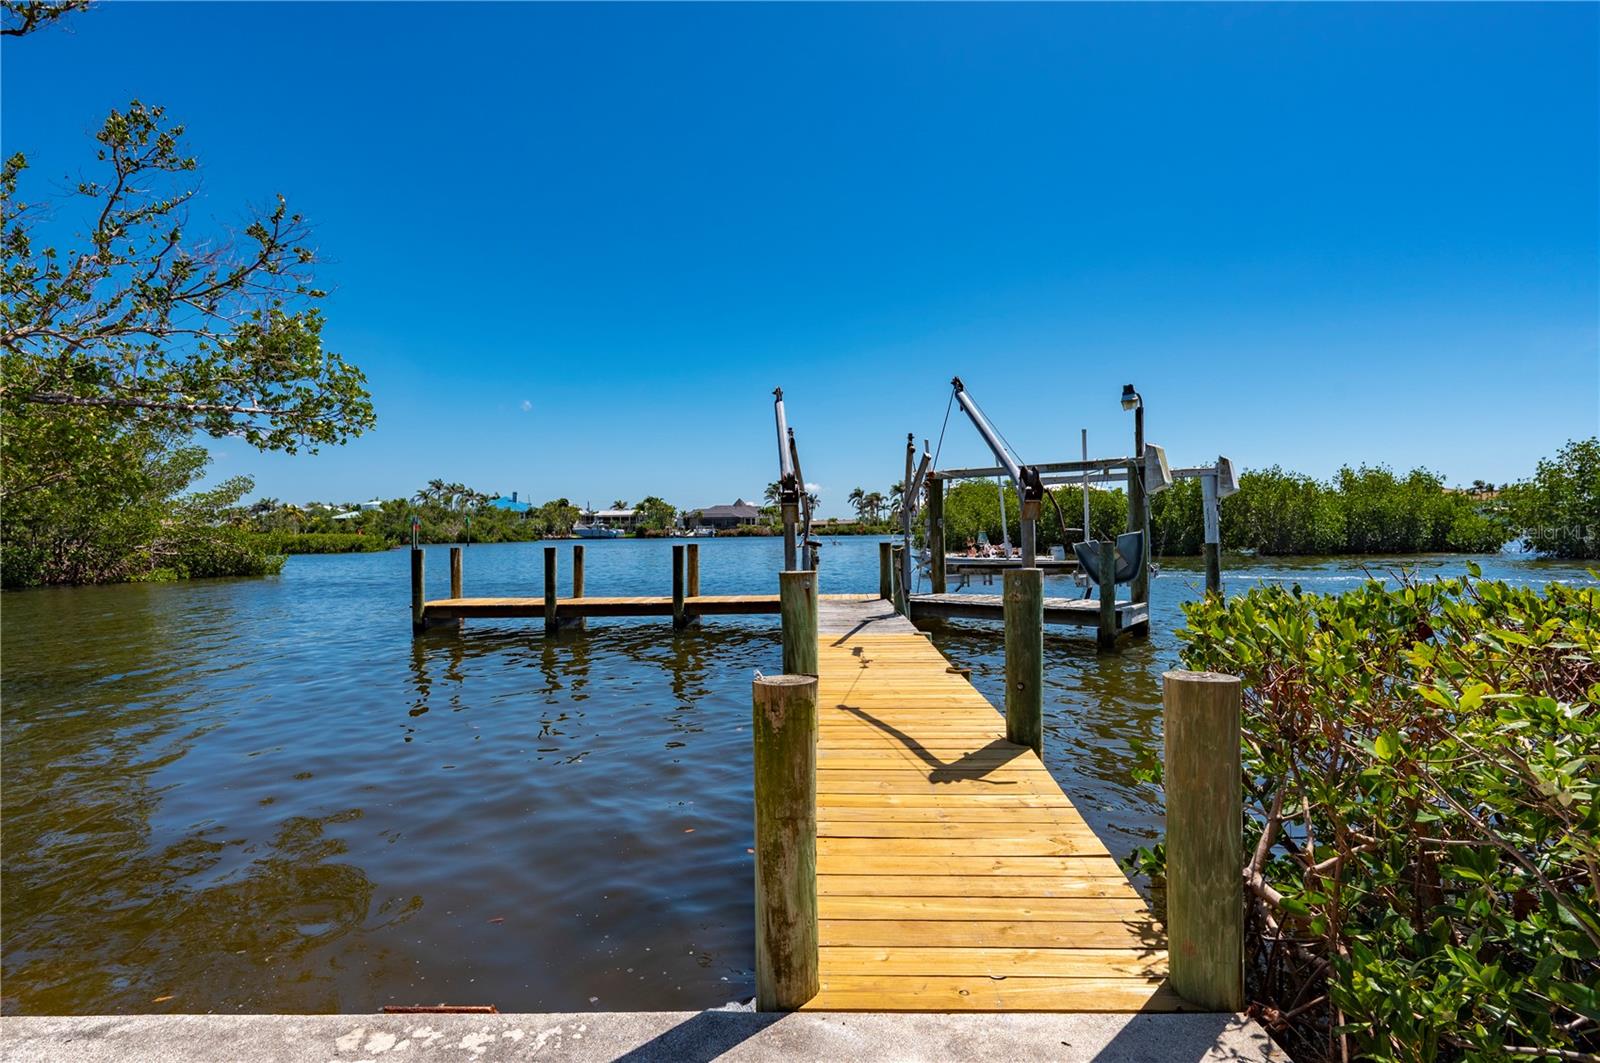
Property Description
Welcome to your very own piece of paradise in the highly sought-after Pirate Harbor Community! If you are dreaming of the Ideal Florida Waterfront Lifestyle, 210 ft. of Waterfront with unobstructed view of Charlotte Harbor and all the way thru to Boca Grande Pass and beyond to the Gulf of Mexico, protected by Seawall and Mangroves giving you complete with Direct Access to Pristine Charlotte Harbor for World Class Boating and Fishing, plus a short Boat Ride to Boca Grande and the Gulf of Mexico then this Home is your perfect choice. The Many Features of this Graceful Estate Home includes an Open Floor Plan with High Ceilings and Solid Hardwood Maple Flooring throughout, as you enter through the Double Doors with Etched Glass, you are greeted by the Fantastic Waterfront Views, Spacious Great Room, Soaring Ceilings, Semi-Separate Dining Area with one of kind built-in Wet Bar with Wine Cooler, this is a must see! Uniquely Designed and Custom Built Chef’s Kitchen with Gas Gagganeau Cooktop with separate Wok Burner, Built in Double ovens, Beautiful Solid Tiger Maple Wood Cabinets with Artisan Carved Glass Doors, track pendent and task lighting, Expansive Breakfast Bar, Stone Counters, High End Appliances, Sub-zero side-by-side Refrigerator/Freezer, undercounter GE Fridge, Indoor Grill, Miele Dishwasher, and amazing Waterfront Views. The Private Primary En-Suite, with sliding glass door offers access to the Screened Deck, Custom Designed Primary Spa with Freestanding Curved Blue Glass Walk in Shower, Granite Counters and His and Her's Vanities, Walk in Closet, Italina Slate Tile and Custom Lighting. Split Floor Plan with Two Guest Bedrooms and a Guest Bath, all rooms have Water Views, Inside Laundry Room with extra Storage, Exterior tankless propane Water Heater, Whole House water softener system with R/O Drinking water system, Closed cell foam insulation sprayed throughout the attic and underside of the home. South Facing Screened Deck provides Year-around enjoyment with protection from the Winter's North winds and gives way to additional Living Space overlooking the Waterfront plus all the benefits of taking in the Stunning views, with taking your eyes towards Boca Grande, experience the joy of remarkable Sunsets every evening. On the lower level there is a workshop and/or a Fisherman's room for Gear, a Generator Hookup, plus room to park up to 3-4 Cars and all of your Toys. This Home is situated on 210ft. of Waterfront with Concrete Seawall, Concrete Dock, Wooden Boat Dock with Boat Lift, it’s every boater's dream, and mere minutes separating you from Boca Grande, Cayo Costa, and the interconnected waterways of Charlotte Harbor and the Gulf of Mexico. Here, you can relish both stunning Sunsets and breathtaking Sunrises, all while indulging in Boating and Fishing opportunities. Your Waterfront Lifestyle Awaits, we invite you for a Private Tour today.
Build Your Team
Quickly find investor-friendly professionals who can help you succeed in real estate investing at any stage of the investing journey.


Agents
Match with investor-friendly agents who can help you find, analyze, and close your next deal


Lenders
Get the best funding…find investor-friendly lenders who specialize in your deal strategy


Property Managers
Transition to passive investing. Find a trusted property management partnership that lasts.


Tax Pros & Accountants
Taxes and financial reporting made easy—find experts to create tax savings strategies, file taxes, and more
Location
Property Details
Parking
- Details: Boat, Covered, Oversized, Workshop in Garage
- Garage Spaces: 0
- Spaces Total: 0
Bedroom Information
- # of Bedrooms: 3
Bathroom Information
- # of Baths (Full): 2
- # of Baths (Total): 2.0
Interior Features
- # of Rooms: 5
- # of Stories: 1
Exterior Features
- Exterior Walls Materials: Wood
- Roof Material: Metal
Land Information
- Land Use: Residential
- Land Use Subtype: Single Family Residential
Lot Information
- Parcel ID: 422319301009
- Lot Size: 18292 sqft
Property Information
- Property Type: Single Family Residence
- Style: Key West
- Year Built: 1988
Tax Information
- Annual Tax: $6,727
Utilities
- Water & Sewer: Public
- Heating: Central, Electric
- Cooling: Central Air
Location
- County: Charlotte
Listing Details
Investment Summary
- Monthly Cash Flow
- -$4,293
- Cap Rate
- 1.9%
- Cash-on-Cash Return
- -18.7%
- Debt Coverage Ratio
- 0.30
- Internal Rate of Return (5 years)
- -14.0%
Cash Flow
Net Operating Income (NOI) minus mortgage payments.
Calculation:
NOI - Mortgage Payments
Cap Rate (Market Value)
Capitalization Rate is a rate of return that compares the yearly Net Operating Income (NOI) to the market value.
Calculation:
NOI / Market Value
Cash-on-Cash Return (CoC)
Annual Cash Flow / Cash Invested
Calculation:
Annual cash flow divided by initial cash invested.
Debt Coverage Ratio (DCR)
Net Operating Income (NOI) divided by total debt payments.
Calculation:
NOI / Total Debt Payments
Internal Rate of Return (IRR)
A metric for assessing profitability over time. IRR is the discount rate at which the net present value (NPV) of all future cash flows (positive and negative) from an investment equals zero — including both periodic cash flow (such as rent) and a projected sale at the end of the holding period. It represents the expected annualized return, accounting for income, expenses, and the recovery of capital through a future sale.
Purchase Details
Purchase PriceThe price paid for the property. Purchase price:
| $1,200,000 |
|---|---|
Amount FinancedThe amount of the purchase financed through a loan. Amount financed:
| -$960,000 |
Down paymentThe initial payment made towards the purchase. Down payment:
| $240,000 |
Closing CostsFees and expenses associated with purchasing a property, typically ranging from 2% to 5% of the home’s purchase price, paid at the end of a home purchase to cover services like lending, title transfer, and taxes. Closing costs:
| $36,000 |
Rehab CostsCosts incurred to repair or improve the property, including: roof, flooring, exterior siding, kitchen, exterior paint, bathrooms, etc. Rehab costs:
| $0 |
Initial Cash InvestedThe total initial cash invested in the property. Calculation:Down payment + Buying costs + Rehab costs Initial cash invested:
| $276,000 |
Square Feet (SQFT)The total square footage of the property. Square feet:
| 1,687 |
Cost Per Square FootCost per square foot of the property. Calculation:Purchase Price / Square Feet Cost per square foot:
| $711 |
Monthly Rent Per Square FootMonthly rent divided by the number of square feet. This ratio helps investors compare rental income efficiency across properties, markets, and unit sizes Calculation:Monthly Rent / Square Feet Monthly rent per square foot:
| $2.07 |
Financing Details
Loan AmountThe total sum of money borrowed from a lender to finance a property purchase. Calculation:Purchase Price - Down Payment
Loan amount:
| $960,000 |
|---|---|
Loan to Value Ratio (LTV)Loan amount divided by the market value of the property. Calculation:Loan Amount / Market Value
Loan to value ratio:
| 80.0% |
Loan TypeThe type of loan (e.g., fixed, adjustable).
Loan type:
| Amortizing |
TermThe loan repayment period in years.
Term:
| 30 years |
Interest RateThe percentage a lender charges on the borrowed amount of a loan, determining the cost of borrowing money.
Interest rate:
| 6.625% |
Principal & Interest (PI)The principal is the portion of the loan payment that reduces the loan balance. The interest is the lender's charge for borrowing money. Calculation:(P * r * (1 + r) ** n) / ((1 + r) ** n - 1) Where:
P = Loan amount (principal)
Principal & interest:
| $6,147 |
Property TaxesAnnual taxes levied by local governments on real estate properties. These taxes fund public services like schools, roads, and emergency services.
Property tax:
| $561 |
InsuranceThe costs for insurance coverage to protect against financial losses due to risks like fire, natural disasters, theft, liability, or tenant-related damages. Calculation:Assumes 7% of gross rental income, unless insurance rates are specified.
Insurance:
| $245 |
Private Mortgage Insurance (PMI)A fee that borrowers pay when they take out a conventional loan with a loan-to-value (LTV) ratio above 80%.
Private mortgage insurance (PMI):
| $0 |
Monthly PaymentThe fixed amount a borrower pays each month to repay a loan. It typically includes principal and interest (P&I) and may also cover property taxes, insurance, HOA fees, and PMI if escrowed. Monthly payment:
| $6,953 |
Operating Income
| % Rent | Monthly | Yearly | |
|---|---|---|---|
Gross RentThe total rental income received from tenants before deducting any expenses. Includes base rent, late fees, pet fees, parking fees, and other recurring charges.
Gross rent:
| $3,500 | $42,000 | |
Vacancy LossExpected loss of rent due to vacancies.
Vacancy loss:
(6%)
| 6% | -$210 | -$2,520 |
Operating IncomeGross rental income minus vacancy loss. Calculation:Gross rent - Vacancy loss
Operating income:
| $3,290 | $39,480 |
Operating Expenses
| % Rent | Monthly | Yearly | |
|---|---|---|---|
Property TaxesAnnual taxes levied by local governments on real estate properties. These taxes fund public services like schools, roads, and emergency services. | 16% | -$561 | -$6,727 |
InsuranceThe costs for insurance coverage to protect against financial losses due to risks like fire, natural disasters, theft, liability, or tenant-related damages. Calculation:Assumes 7% of gross rental income, unless insurance rates are specified. | 7% | -$245 | -$2,940 |
Property ManagementThe costs associated with hiring a property manager to handle the day-to-day operations of a rental property. Includes management fees, leasing fes, eviction fees, etc. Calculation:Assumes 8% of gross rental income. | 8% | -$280 | -$3,360 |
Repairs & MaintenanceOngoing costs for routine upkeep and minor fixes needed to keep a property in good working condition. Calculation:Assumes 5% of gross rental income. Varies by property age and condition. | 5% | -$175 | -$2,100 |
Capital ExpensesLarge, infrequent costs for major improvements or replacements, like a new roof, HVAC system, or appliances. Calculation:Assumes 5% of gross rental income. Varies by property age. | 5% | -$175 | -$2,100 |
HOA FeesRegular dues paid to a Homeowners Association for community maintenance, amenities, and management. Similar fees include: Condo Association Fees, Co-op Maintenance Fees, etc. | n/a | n/a | n/a |
Operating ExpensesRecurring costs required to maintain and manage a rental property, including property taxes, insurance, maintenance, repairs, utilities (if paid by the owner), property management fees, and other day-to-day expenses. Calculation:Insurance + Property Taxes + Property Management + Repairs & Maintenance + Capital Expenditures + HOA Fees | 41% | -$1,436 | -$17,227 |
Cash Flow
| Monthly | Yearly | |
|---|---|---|
Net Operating Income (NOI)The income generated from a property after deducting all operating expenses but before deducting mortgage payments, taxes, and capital expenditures. Calculation:Gross Operating Income - Operating Expenses
Net operating income:
| $1,854 | $22,248 |
Mortgage PaymentThe fixed amount a borrower pays each month to repay a loan. It typically includes principal and interest (P&I) and may also cover property taxes, insurance, HOA fees, and PMI if escrowed. | -$6,147 | -$73,764 |
Cash FlowNet Operating Income (NOI) minus mortgage payments. Calculation:NOI - Mortgage Payments | $4,293 | $51,516 |