$1,725,000
Investment Summary
- Monthly Cash Flow
- -$7,012
- Cap Rate
- 1.3%
- Cash-on-Cash Return
- -21.2%
- Debt Coverage Ratio
- 0.21
- Internal Rate of Return (5 years)
- -16.5%
Cash Flow
Net Operating Income (NOI) minus mortgage payments.
Calculation:
NOI - Mortgage Payments
Cap Rate (Market Value)
Capitalization Rate is a rate of return that compares the yearly Net Operating Income (NOI) to the market value.
Calculation:
NOI / Market Value
Cash-on-Cash Return (CoC)
Annual Cash Flow / Cash Invested
Calculation:
Annual cash flow divided by initial cash invested.
Debt Coverage Ratio (DCR)
Net Operating Income (NOI) divided by total debt payments.
Calculation:
NOI / Total Debt Payments
Internal Rate of Return (IRR)
A metric for assessing profitability over time. IRR is the discount rate at which the net present value (NPV) of all future cash flows (positive and negative) from an investment equals zero — including both periodic cash flow (such as rent) and a projected sale at the end of the holding period. It represents the expected annualized return, accounting for income, expenses, and the recovery of capital through a future sale.
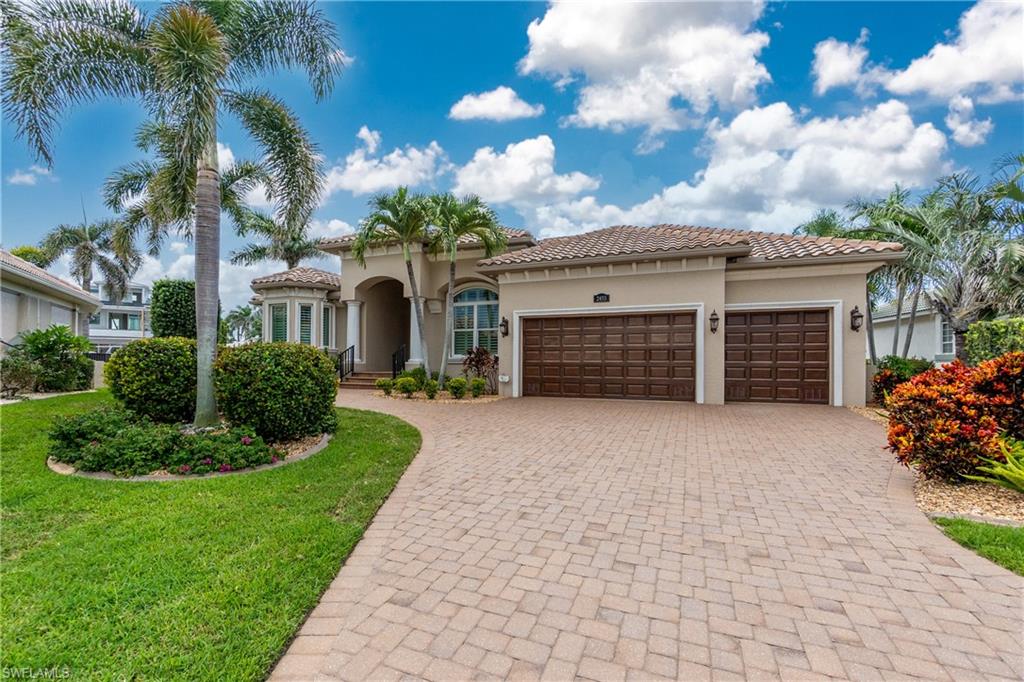
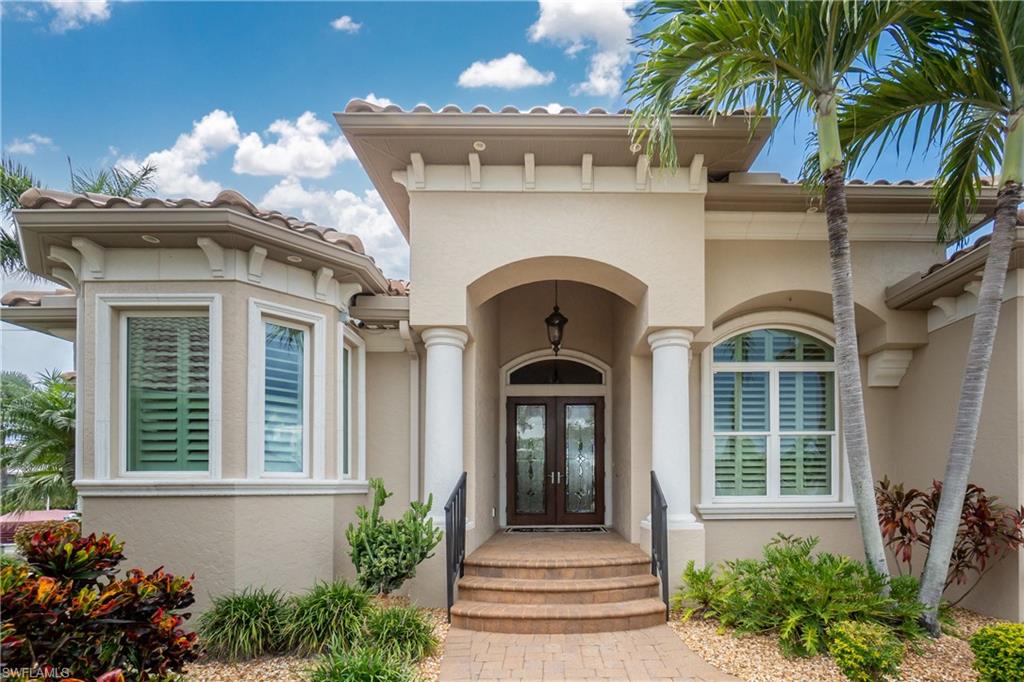
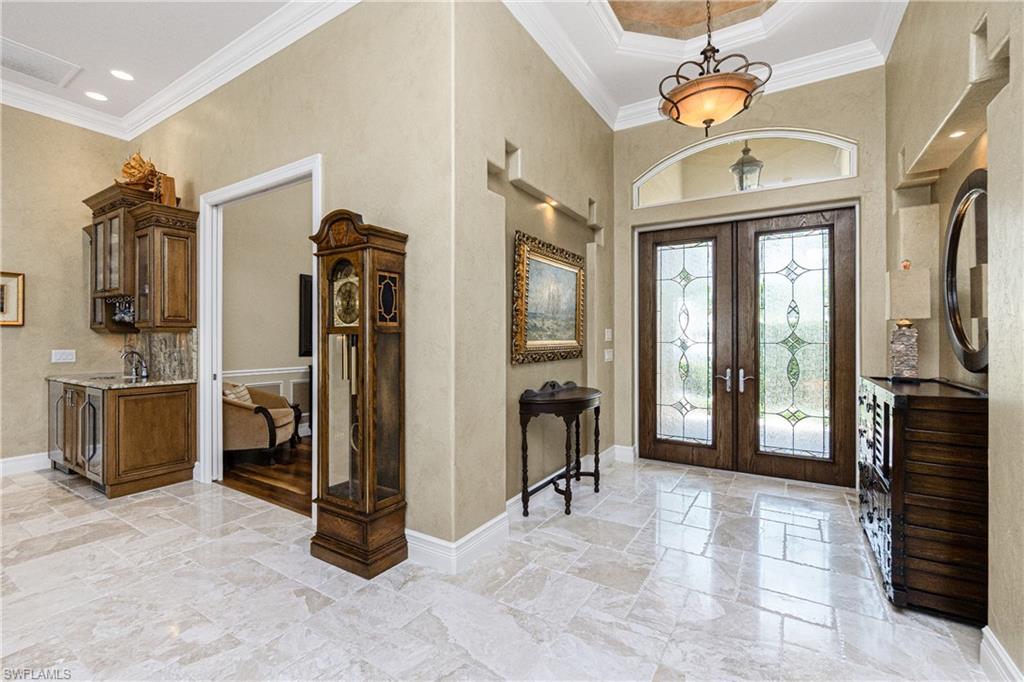
Property Description
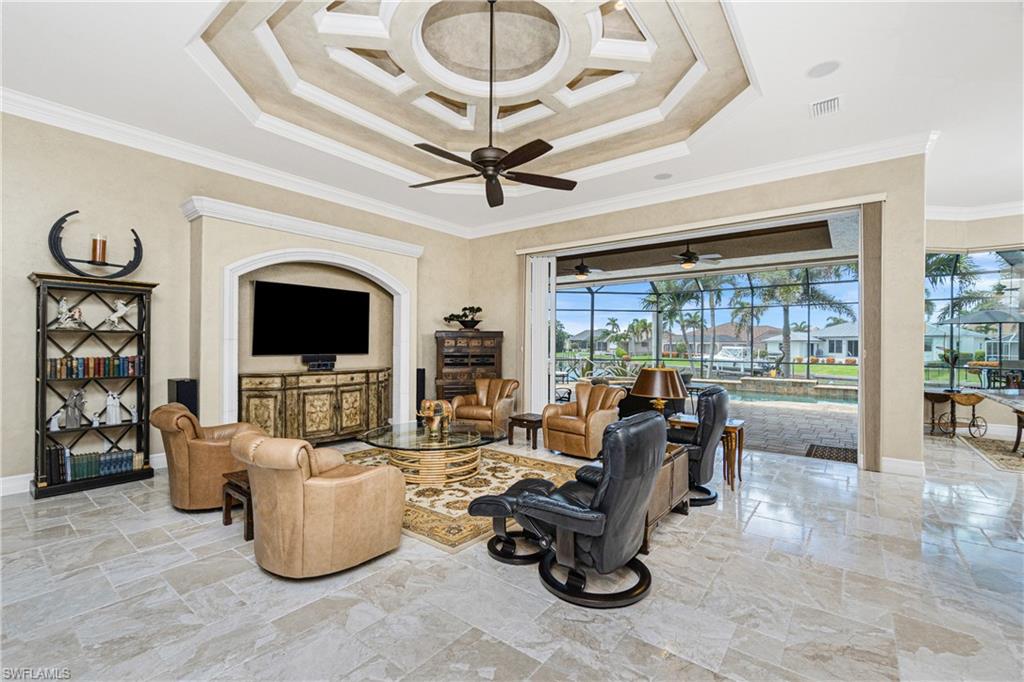
This perfectly positioned custom West Coast built residence is situated in one of PGI’s most desirable neighborhoods on a choice southwest facing tip lot with 174’ of frontage & thoughtfully designed features inside & out! Pride of ownership abounds in this well maintained 3BR + den boasts great curb appeal with well manicured grounds. Decorative impact-rated double glass doors welcome you into an attractive foyer featuring illuminated torii gate styled art niches. Dramatic soaring 16-foot custom designed coffered ceilings & rich marble flooring will lure you to explore this quality property. Impressive ten foot disappearing sliding glass doors create a seamless connection between indoors & out. Utopia awaits out on the sprawling lanai. This grand outdoor living space is the ultimate entertaining spot, with no detail overlooked. Ambiance abounds in this spectacular 36’ wide covered space featuring a stately accent wall w/built-in fireplace & wall mounted TV flanked by a handsome summer kitchen & warm cedar tray ceilings A motorized retractable awning adds to the ambiance & shields from the afternoon sun. You will enjoy cooling off in the refreshing PebbleTec pool, or relax in the spacious spa. Take a walk down the paver path to the 154-foot wrap around concrete dock- complete w/26,000 lb boat lift + 1,000 lb dinghy lift—all just a 10 minute boat ride to open water via Ponce Inlet. Inside, the expansive great room is a great venue…complete w/wine cooler, built-in ice maker, & handsome wet bar featuring elaborate wood cabinetry w/illuminated display shelving, The kitchen is truly a chef’s dream w/European styled custom maple wood raised-panel cabinetry w/decorative corbels, millwork & illuminated moldings, granite tops & an island w/raised bar seating. Premium appliances include GE Induction cooktop w/range hood, &stainless GE Profile double oven (convection/microwave/standard). Sit down to a lovely meal while enjoying the panoramic pool & water views through the large aquarium glass window. Work in comfort from the expansive study, featuring cherry plank engineered wood flooring, plantation shutters, tray ceiling w/crown molding & glass pocket doors for privacy. The primary suite offers peaceful water views, pocket sliders to the lanai, illuminated coffered ceiling, & dual custom walk-in closets w/built-in cabinetry & shoe storage. The spa-inspired bath includes a 10’ custom wood vanity w/built in storage & tasteful surround. A discretely installed TV can be enjoyed thru the expansive vanity mirror over the dual sinks & granite tops. Cosmetic station enjoys abundant natural light. A large pass through shower is finished w/Onyx mosaic tile & triple shower heads. Guest wing w/two large guest rooms each showcasing tray ceilings & crown molding. One features an en-suite bath w/dual sinks, Roman shower & access to the pool, while the other accesses a full hall bath. An oversized 29’ x 24’ three-car garage offers ample space for vehicles & storage.
Build Your Team
Quickly find investor-friendly professionals who can help you succeed in real estate investing at any stage of the investing journey.


Agents
Match with investor-friendly agents who can help you find, analyze, and close your next deal


Lenders
Get the best funding…find investor-friendly lenders who specialize in your deal strategy


Property Managers
Transition to passive investing. Find a trusted property management partnership that lasts.


Tax Pros & Accountants
Taxes and financial reporting made easy—find experts to create tax savings strategies, file taxes, and more
Location
Property Details
Parking
- Description: Garage
- Details: Garage Door Opener, Paved, Attached
- Garage Spaces: 3
- Spaces Total: 3
Bedroom Information
- # of Bedrooms: 3
Bathroom Information
- # of Baths (Full): 3
- # of Baths (Total): 3.0
Interior Features
- # of Rooms: 9
- # of Stories: 1
- Fireplace: Yes
Exterior Features
- Exterior Walls Materials: Stucco
- Roof Material: Tile
- Pool: Yes
Land Information
- Land Use: Residential
- Land Use Subtype: Single Family Residential
Lot Information
- Parcel ID: 412214383002
- Lot Size: 13068 sqft
Property Information
- Property Type: Single Family Residence
- Style: Florida, Single Family
- Year Built: 2013
Tax Information
- Annual Tax: $11,229
Utilities
- Heating: Central, Electric
- Cooling: Ceiling Fan(s)
Location
- County: Charlotte
Listing Details
Investment Summary
- Monthly Cash Flow
- -$7,012
- Cap Rate
- 1.3%
- Cash-on-Cash Return
- -21.2%
- Debt Coverage Ratio
- 0.21
- Internal Rate of Return (5 years)
- -16.5%
Cash Flow
Net Operating Income (NOI) minus mortgage payments.
Calculation:
NOI - Mortgage Payments
Cap Rate (Market Value)
Capitalization Rate is a rate of return that compares the yearly Net Operating Income (NOI) to the market value.
Calculation:
NOI / Market Value
Cash-on-Cash Return (CoC)
Annual Cash Flow / Cash Invested
Calculation:
Annual cash flow divided by initial cash invested.
Debt Coverage Ratio (DCR)
Net Operating Income (NOI) divided by total debt payments.
Calculation:
NOI / Total Debt Payments
Internal Rate of Return (IRR)
A metric for assessing profitability over time. IRR is the discount rate at which the net present value (NPV) of all future cash flows (positive and negative) from an investment equals zero — including both periodic cash flow (such as rent) and a projected sale at the end of the holding period. It represents the expected annualized return, accounting for income, expenses, and the recovery of capital through a future sale.
Purchase Details
Purchase PriceThe price paid for the property. Purchase price:
| $1,725,000 |
|---|---|
Amount FinancedThe amount of the purchase financed through a loan. Amount financed:
| -$1,380,000 |
Down paymentThe initial payment made towards the purchase. Down payment:
| $345,000 |
Closing CostsFees and expenses associated with purchasing a property, typically ranging from 2% to 5% of the home’s purchase price, paid at the end of a home purchase to cover services like lending, title transfer, and taxes. Closing costs:
| $51,750 |
Rehab CostsCosts incurred to repair or improve the property, including: roof, flooring, exterior siding, kitchen, exterior paint, bathrooms, etc. Rehab costs:
| $0 |
Initial Cash InvestedThe total initial cash invested in the property. Calculation:Down payment + Buying costs + Rehab costs Initial cash invested:
| $396,750 |
Square Feet (SQFT)The total square footage of the property. Square feet:
| 2,950 |
Cost Per Square FootCost per square foot of the property. Calculation:Purchase Price / Square Feet Cost per square foot:
| $585 |
Monthly Rent Per Square FootMonthly rent divided by the number of square feet. This ratio helps investors compare rental income efficiency across properties, markets, and unit sizes Calculation:Monthly Rent / Square Feet Monthly rent per square foot:
| $1.36 |
Financing Details
Loan AmountThe total sum of money borrowed from a lender to finance a property purchase. Calculation:Purchase Price - Down Payment
Loan amount:
| $1,380,000 |
|---|---|
Loan to Value Ratio (LTV)Loan amount divided by the market value of the property. Calculation:Loan Amount / Market Value
Loan to value ratio:
| 80.0% |
Loan TypeThe type of loan (e.g., fixed, adjustable).
Loan type:
| Amortizing |
TermThe loan repayment period in years.
Term:
| 30 years |
Interest RateThe percentage a lender charges on the borrowed amount of a loan, determining the cost of borrowing money.
Interest rate:
| 6.625% |
Principal & Interest (PI)The principal is the portion of the loan payment that reduces the loan balance. The interest is the lender's charge for borrowing money. Calculation:(P * r * (1 + r) ** n) / ((1 + r) ** n - 1) Where:
P = Loan amount (principal)
Principal & interest:
| $8,836 |
Property TaxesAnnual taxes levied by local governments on real estate properties. These taxes fund public services like schools, roads, and emergency services.
Property tax:
| $936 |
InsuranceThe costs for insurance coverage to protect against financial losses due to risks like fire, natural disasters, theft, liability, or tenant-related damages. Calculation:Assumes 7% of gross rental income, unless insurance rates are specified.
Insurance:
| $280 |
Private Mortgage Insurance (PMI)A fee that borrowers pay when they take out a conventional loan with a loan-to-value (LTV) ratio above 80%.
Private mortgage insurance (PMI):
| $0 |
Monthly PaymentThe fixed amount a borrower pays each month to repay a loan. It typically includes principal and interest (P&I) and may also cover property taxes, insurance, HOA fees, and PMI if escrowed. Monthly payment:
| $10,052 |
Operating Income
| % Rent | Monthly | Yearly | |
|---|---|---|---|
Gross RentThe total rental income received from tenants before deducting any expenses. Includes base rent, late fees, pet fees, parking fees, and other recurring charges.
Gross rent:
| $4,000 | $48,000 | |
Vacancy LossExpected loss of rent due to vacancies.
Vacancy loss:
(6%)
| 6% | -$240 | -$2,880 |
Operating IncomeGross rental income minus vacancy loss. Calculation:Gross rent - Vacancy loss
Operating income:
| $3,760 | $45,120 |
Operating Expenses
| % Rent | Monthly | Yearly | |
|---|---|---|---|
Property TaxesAnnual taxes levied by local governments on real estate properties. These taxes fund public services like schools, roads, and emergency services. | 23% | -$936 | -$11,230 |
InsuranceThe costs for insurance coverage to protect against financial losses due to risks like fire, natural disasters, theft, liability, or tenant-related damages. Calculation:Assumes 7% of gross rental income, unless insurance rates are specified. | 7% | -$280 | -$3,360 |
Property ManagementThe costs associated with hiring a property manager to handle the day-to-day operations of a rental property. Includes management fees, leasing fes, eviction fees, etc. Calculation:Assumes 8% of gross rental income. | 8% | -$320 | -$3,840 |
Repairs & MaintenanceOngoing costs for routine upkeep and minor fixes needed to keep a property in good working condition. Calculation:Assumes 5% of gross rental income. Varies by property age and condition. | 5% | -$200 | -$2,400 |
Capital ExpensesLarge, infrequent costs for major improvements or replacements, like a new roof, HVAC system, or appliances. Calculation:Assumes 5% of gross rental income. Varies by property age. | 5% | -$200 | -$2,400 |
HOA FeesRegular dues paid to a Homeowners Association for community maintenance, amenities, and management. Similar fees include: Condo Association Fees, Co-op Maintenance Fees, etc. | n/a | n/a | n/a |
Operating ExpensesRecurring costs required to maintain and manage a rental property, including property taxes, insurance, maintenance, repairs, utilities (if paid by the owner), property management fees, and other day-to-day expenses. Calculation:Insurance + Property Taxes + Property Management + Repairs & Maintenance + Capital Expenditures + HOA Fees | 48% | -$1,936 | -$23,230 |
Cash Flow
| Monthly | Yearly | |
|---|---|---|
Net Operating Income (NOI)The income generated from a property after deducting all operating expenses but before deducting mortgage payments, taxes, and capital expenditures. Calculation:Gross Operating Income - Operating Expenses
Net operating income:
| $1,824 | $21,888 |
Mortgage PaymentThe fixed amount a borrower pays each month to repay a loan. It typically includes principal and interest (P&I) and may also cover property taxes, insurance, HOA fees, and PMI if escrowed. | -$8,836 | -$106,032 |
Cash FlowNet Operating Income (NOI) minus mortgage payments. Calculation:NOI - Mortgage Payments | -$7,012 | -$84,144 |