$419,900
Investment Summary
- Monthly Cash Flow
- -$936
- Cap Rate
- 3.5%
- Cash-on-Cash Return
- -11.6%
- Debt Coverage Ratio
- 0.56
- Internal Rate of Return (5 years)
- -7.3%
Cash Flow
Net Operating Income (NOI) minus mortgage payments.
Calculation:
NOI - Mortgage Payments
Cap Rate (Market Value)
Capitalization Rate is a rate of return that compares the yearly Net Operating Income (NOI) to the market value.
Calculation:
NOI / Market Value
Cash-on-Cash Return (CoC)
Annual Cash Flow / Cash Invested
Calculation:
Annual cash flow divided by initial cash invested.
Debt Coverage Ratio (DCR)
Net Operating Income (NOI) divided by total debt payments.
Calculation:
NOI / Total Debt Payments
Internal Rate of Return (IRR)
A metric for assessing profitability over time. IRR is the discount rate at which the net present value (NPV) of all future cash flows (positive and negative) from an investment equals zero — including both periodic cash flow (such as rent) and a projected sale at the end of the holding period. It represents the expected annualized return, accounting for income, expenses, and the recovery of capital through a future sale.
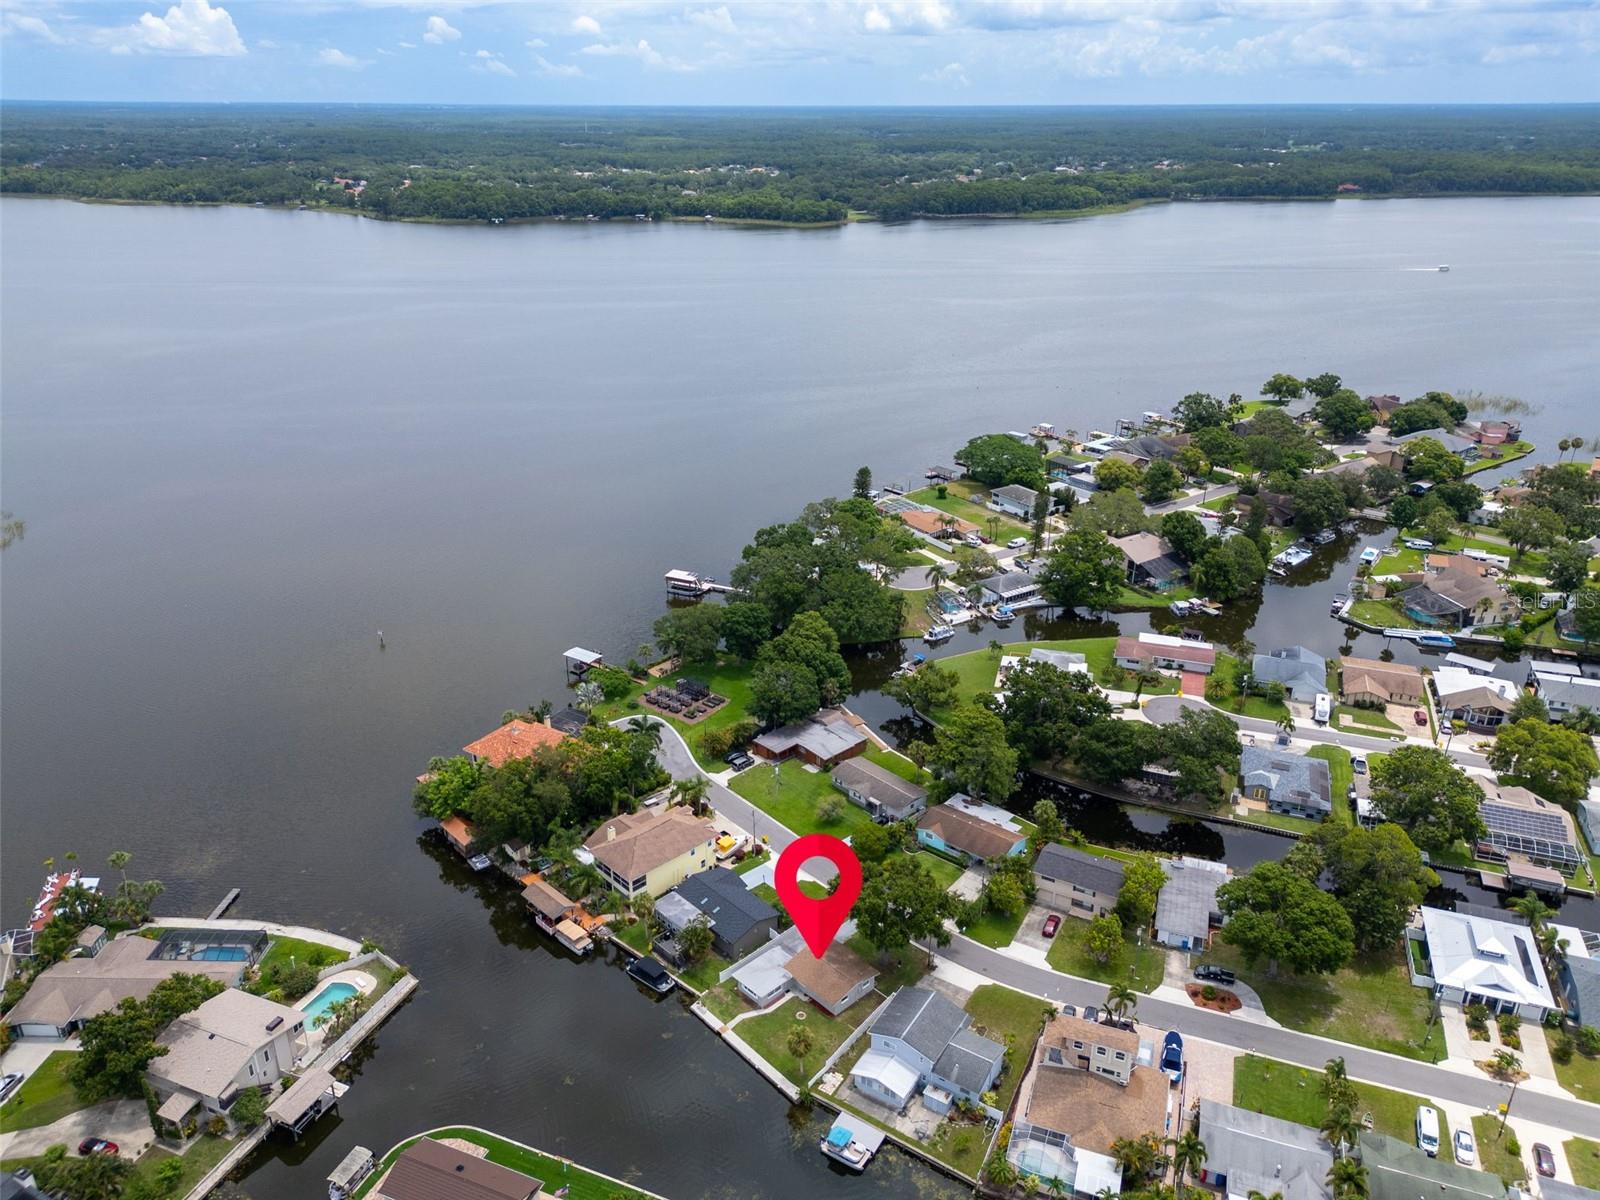
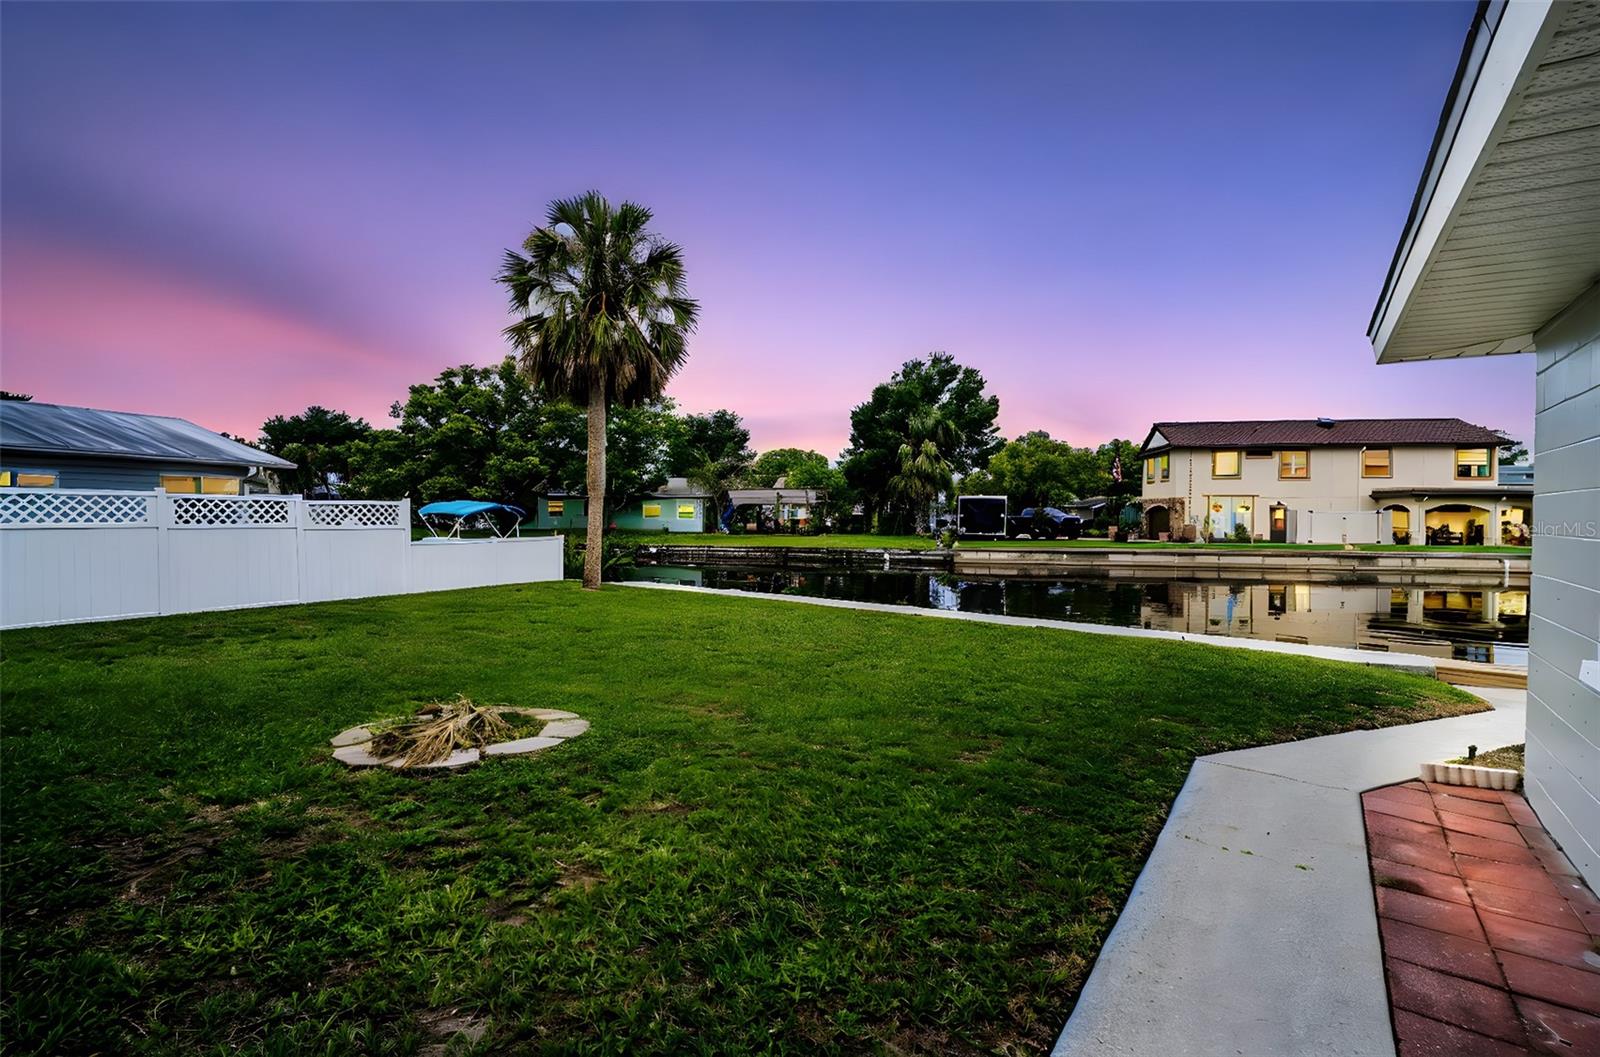
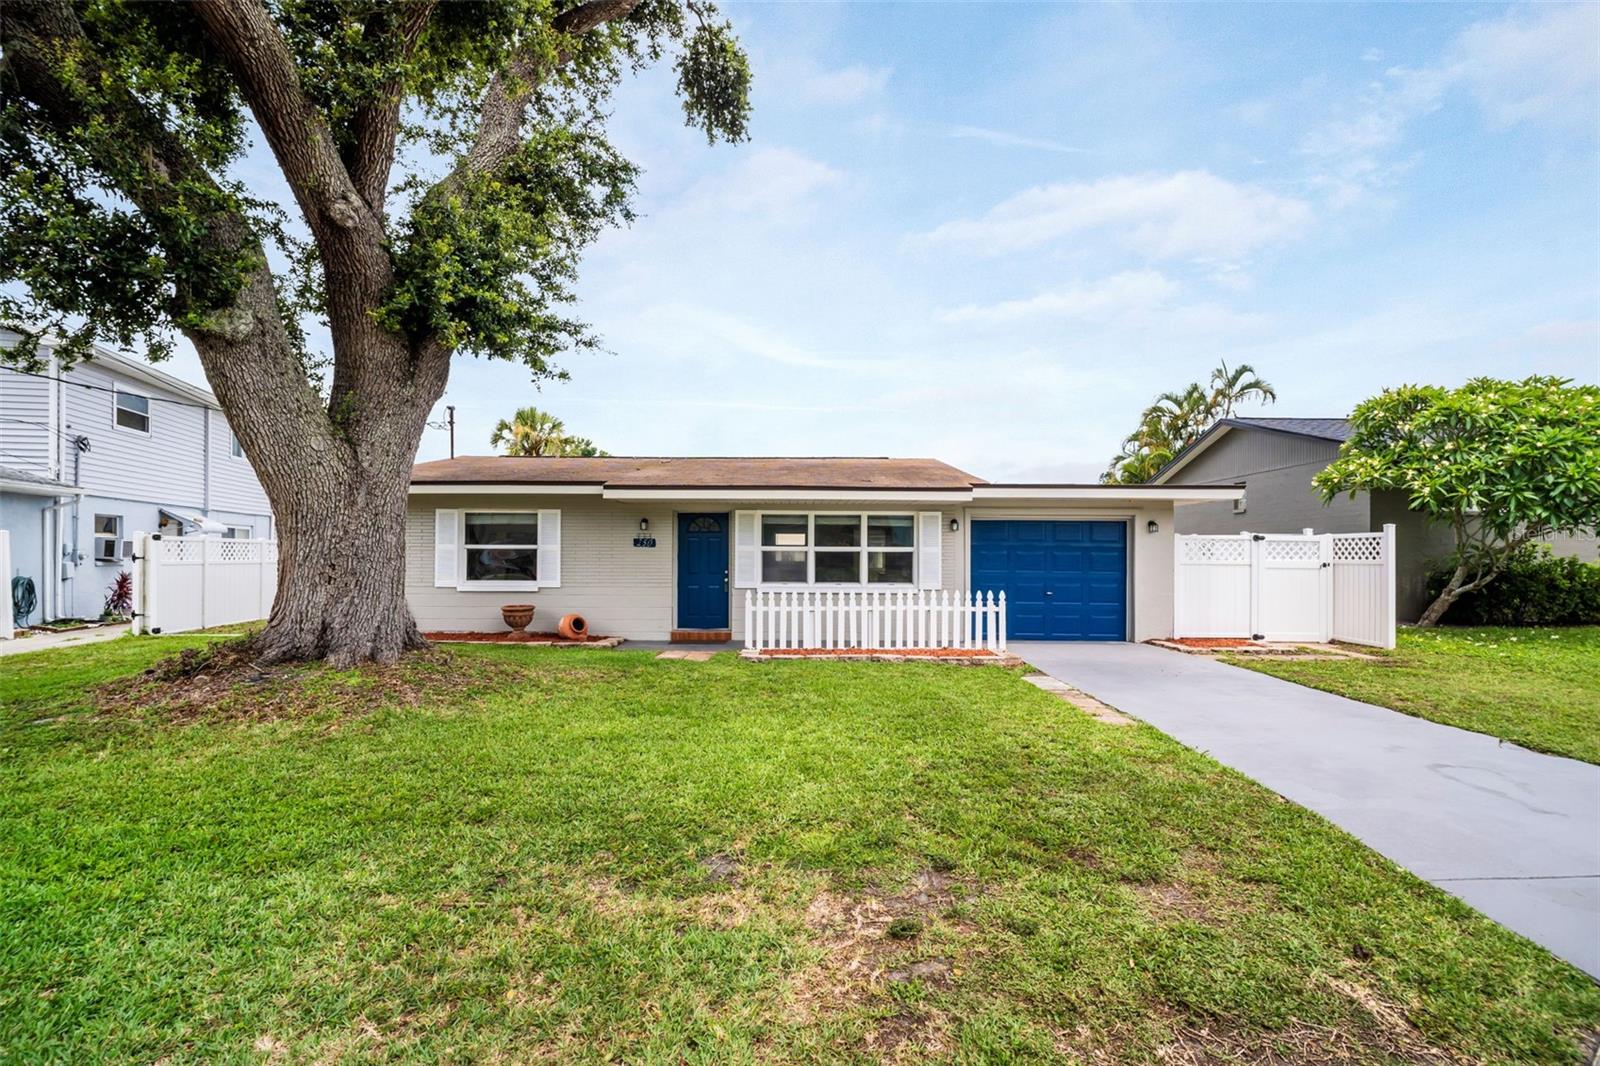
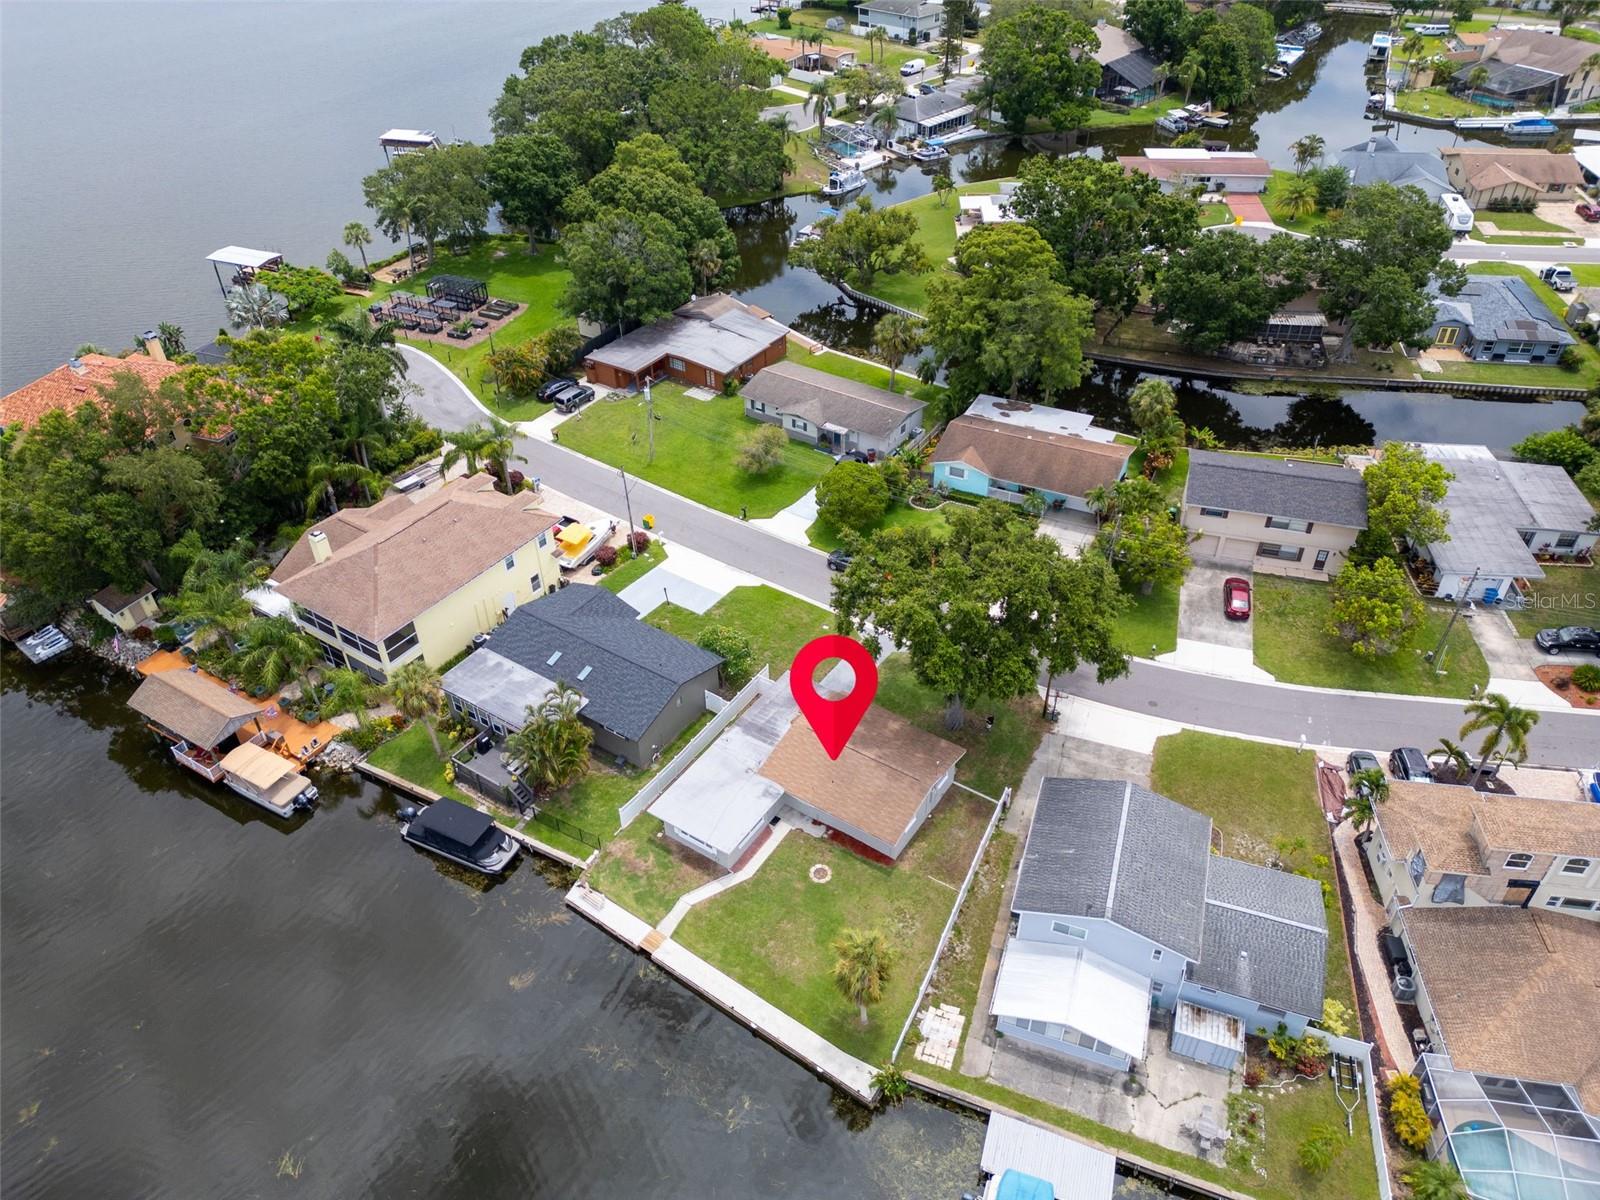
Property Description
One or more photo(s) has been virtually staged. Owner is open to partial owner financing with substantial downpayment and 5 year balloon payment. Welcome to the lake!! Walk out your door and onto your boat in the deep water canal behind your home. Access to Lake Tarpon is just 3 doors away. You also have beautiful lake views from your front door. With No HOA, No deed restrictions, and No lease restrictions, you can enjoy your property or rent it out as a lake get away. This charming 2/2/1 canal home has a fresh exterior coat of paint (May 2025) is an opportunity for you to affordably live lake life. This home has a passing 4-point inspection. (May 2025) (HVAC 2016, Roof 2016, Hot Water Heater 2025) The home has an oversized kitchen and stainless-steel appliances including refrigerator, range, and dishwasher. It is sure to be the gathering place to enjoy a good meal. The home boasts hardwood and tile flooring throughout. The home flows into the living area which also has ample room and is ready for you to entertain or just sit back and enjoy the water view. There is plenty of storage as each bedroom has it's own closet, and there is a one car garage. The garage has a laundry area, and has a freestanding AC unit in case you enjoy spending time with projects in the garage. This home has its own sea wall so bring your boat or wave runner. NO, THIS HOME IS NOT DAMAGED, AND NO, IT HAS NEVER FLOODED!! No worries here as this home has survived all recent storms without any flooding issues. The lake is lowered several feet prior to major storm events. The locks on the lake are opened, releasing water into the Tampa Bay in anticipation of any water accumulation. The canal leads right onto Florida’s second largest freshwater lake, Lake Tarpon. If you like boating on the Gulf of Mexico, 2.6 miles away. Anderson Park is 1.8 miles away, and accessible from both the lake and US 19. Tarpon Springs world famous Sponge Docks are 3.8 miles away. Honeymoon Island is 6.6 miles away, Dunedin Causeway is 5.4 miles away. If golf is your passion Innisbrook Country Club is 1.4 miles away and you can enjoy the annual PGA Valspar Tournament so close to home. There is a private community boat ramp a 0.2 miles away. Access to the ramp is currently optional to Lake Shore Estate residents for a $30 annual community membership. Don’t like entertaining at home? The Lake Shore Estates Club House is available to members for $60 +$50 deposit. It has a kitchen and both indoor and outdoor areas right on the lake. Bring your furry four-legged friends because there is a dog park. Get your golf cart ready as this community loves to celebrate with Halloween and Holiday parades aside from regular golf cart use on the roads. Come see what lake life is all about! All information and measurements to be verified by the buyer and or buyer’s agent.
Build Your Team
Quickly find investor-friendly professionals who can help you succeed in real estate investing at any stage of the investing journey.


Agents
Match with investor-friendly agents who can help you find, analyze, and close your next deal


Lenders
Get the best funding…find investor-friendly lenders who specialize in your deal strategy


Property Managers
Transition to passive investing. Find a trusted property management partnership that lasts.


Tax Pros & Accountants
Taxes and financial reporting made easy—find experts to create tax savings strategies, file taxes, and more
Location
Property Details
Parking
- Description: Converted Garage, None
- Details: Attached
- Garage Spaces: 1
- Spaces Total: 0
Bedroom Information
- # of Bedrooms: 2
Bathroom Information
- # of Baths (Full): 2
- # of Baths (Total): 2.0
Interior Features
- # of Rooms: 4
- # of Stories: 1
Exterior Features
- Exterior Walls Materials: Concrete Block
- Foundation: Block, Slab
- Roof Type: Gable
- Roof Material: Shingle
HOA
- Has HOA: Yes
- Association: http://www.lakeshoreestates.info/
- HOA Fee: $30/annually
Land Information
- Land Use: Residential
- Land Use Subtype: Single Family Residential
Lot Information
- Parcel ID: 302716485280002500
- Lot Size: 6212 sqft
Property Information
- Property Type: Single Family Residence
- Style: Ranch
- Year Built: 1957
Tax Information
- Annual Tax: $5,258
Utilities
- Water & Sewer: Public
- Heating: Electric
- Cooling: Central Air
Location
- County: Pinellas
Listing Details
Investment Summary
- Monthly Cash Flow
- -$936
- Cap Rate
- 3.5%
- Cash-on-Cash Return
- -11.6%
- Debt Coverage Ratio
- 0.56
- Internal Rate of Return (5 years)
- -7.3%
Cash Flow
Net Operating Income (NOI) minus mortgage payments.
Calculation:
NOI - Mortgage Payments
Cap Rate (Market Value)
Capitalization Rate is a rate of return that compares the yearly Net Operating Income (NOI) to the market value.
Calculation:
NOI / Market Value
Cash-on-Cash Return (CoC)
Annual Cash Flow / Cash Invested
Calculation:
Annual cash flow divided by initial cash invested.
Debt Coverage Ratio (DCR)
Net Operating Income (NOI) divided by total debt payments.
Calculation:
NOI / Total Debt Payments
Internal Rate of Return (IRR)
A metric for assessing profitability over time. IRR is the discount rate at which the net present value (NPV) of all future cash flows (positive and negative) from an investment equals zero — including both periodic cash flow (such as rent) and a projected sale at the end of the holding period. It represents the expected annualized return, accounting for income, expenses, and the recovery of capital through a future sale.
Purchase Details
Purchase PriceThe price paid for the property. Purchase price:
| $419,900 |
|---|---|
Amount FinancedThe amount of the purchase financed through a loan. Amount financed:
| -$335,920 |
Down paymentThe initial payment made towards the purchase. Down payment:
| $83,980 |
Closing CostsFees and expenses associated with purchasing a property, typically ranging from 2% to 5% of the home’s purchase price, paid at the end of a home purchase to cover services like lending, title transfer, and taxes. Closing costs:
| $12,597 |
Rehab CostsCosts incurred to repair or improve the property, including: roof, flooring, exterior siding, kitchen, exterior paint, bathrooms, etc. Rehab costs:
| $0 |
Initial Cash InvestedThe total initial cash invested in the property. Calculation:Down payment + Buying costs + Rehab costs Initial cash invested:
| $96,577 |
Square Feet (SQFT)The total square footage of the property. Square feet:
| 1,189 |
Cost Per Square FootCost per square foot of the property. Calculation:Purchase Price / Square Feet Cost per square foot:
| $353 |
Monthly Rent Per Square FootMonthly rent divided by the number of square feet. This ratio helps investors compare rental income efficiency across properties, markets, and unit sizes Calculation:Monthly Rent / Square Feet Monthly rent per square foot:
| $2.02 |
Financing Details
Loan AmountThe total sum of money borrowed from a lender to finance a property purchase. Calculation:Purchase Price - Down Payment
Loan amount:
| $335,920 |
|---|---|
Loan to Value Ratio (LTV)Loan amount divided by the market value of the property. Calculation:Loan Amount / Market Value
Loan to value ratio:
| 80.0% |
Loan TypeThe type of loan (e.g., fixed, adjustable).
Loan type:
| Amortizing |
TermThe loan repayment period in years.
Term:
| 30 years |
Interest RateThe percentage a lender charges on the borrowed amount of a loan, determining the cost of borrowing money.
Interest rate:
| 6.625% |
Principal & Interest (PI)The principal is the portion of the loan payment that reduces the loan balance. The interest is the lender's charge for borrowing money. Calculation:(P * r * (1 + r) ** n) / ((1 + r) ** n - 1) Where:
P = Loan amount (principal)
Principal & interest:
| $2,151 |
Property TaxesAnnual taxes levied by local governments on real estate properties. These taxes fund public services like schools, roads, and emergency services.
Property tax:
| $438 |
InsuranceThe costs for insurance coverage to protect against financial losses due to risks like fire, natural disasters, theft, liability, or tenant-related damages. Calculation:Assumes 7% of gross rental income, unless insurance rates are specified.
Insurance:
| $168 |
Private Mortgage Insurance (PMI)A fee that borrowers pay when they take out a conventional loan with a loan-to-value (LTV) ratio above 80%.
Private mortgage insurance (PMI):
| $0 |
Monthly PaymentThe fixed amount a borrower pays each month to repay a loan. It typically includes principal and interest (P&I) and may also cover property taxes, insurance, HOA fees, and PMI if escrowed. Monthly payment:
| $2,757 |
Operating Income
| % Rent | Monthly | Yearly | |
|---|---|---|---|
Gross RentThe total rental income received from tenants before deducting any expenses. Includes base rent, late fees, pet fees, parking fees, and other recurring charges.
Gross rent:
| $2,400 | $28,800 | |
Vacancy LossExpected loss of rent due to vacancies.
Vacancy loss:
(6%)
| 6% | -$144 | -$1,728 |
Operating IncomeGross rental income minus vacancy loss. Calculation:Gross rent - Vacancy loss
Operating income:
| $2,256 | $27,072 |
Operating Expenses
| % Rent | Monthly | Yearly | |
|---|---|---|---|
Property TaxesAnnual taxes levied by local governments on real estate properties. These taxes fund public services like schools, roads, and emergency services. | 18% | -$438 | -$5,258 |
InsuranceThe costs for insurance coverage to protect against financial losses due to risks like fire, natural disasters, theft, liability, or tenant-related damages. Calculation:Assumes 7% of gross rental income, unless insurance rates are specified. | 7% | -$168 | -$2,016 |
Property ManagementThe costs associated with hiring a property manager to handle the day-to-day operations of a rental property. Includes management fees, leasing fes, eviction fees, etc. Calculation:Assumes 8% of gross rental income. | 8% | -$192 | -$2,304 |
Repairs & MaintenanceOngoing costs for routine upkeep and minor fixes needed to keep a property in good working condition. Calculation:Assumes 5% of gross rental income. Varies by property age and condition. | 5% | -$120 | -$1,440 |
Capital ExpensesLarge, infrequent costs for major improvements or replacements, like a new roof, HVAC system, or appliances. Calculation:Assumes 5% of gross rental income. Varies by property age. | 5% | -$120 | -$1,440 |
HOA FeesRegular dues paid to a Homeowners Association for community maintenance, amenities, and management. Similar fees include: Condo Association Fees, Co-op Maintenance Fees, etc. | 0% | -$3 | -$36 |
Operating ExpensesRecurring costs required to maintain and manage a rental property, including property taxes, insurance, maintenance, repairs, utilities (if paid by the owner), property management fees, and other day-to-day expenses. Calculation:Insurance + Property Taxes + Property Management + Repairs & Maintenance + Capital Expenditures + HOA Fees | 43% | -$1,041 | -$12,494 |
Cash Flow
| Monthly | Yearly | |
|---|---|---|
Net Operating Income (NOI)The income generated from a property after deducting all operating expenses but before deducting mortgage payments, taxes, and capital expenditures. Calculation:Gross Operating Income - Operating Expenses
Net operating income:
| $1,215 | $14,580 |
Mortgage PaymentThe fixed amount a borrower pays each month to repay a loan. It typically includes principal and interest (P&I) and may also cover property taxes, insurance, HOA fees, and PMI if escrowed. | -$2,151 | -$25,812 |
Cash FlowNet Operating Income (NOI) minus mortgage payments. Calculation:NOI - Mortgage Payments | $936 | $11,232 |